Resetting School Funding for New Jersey’s Next Decade

Based on Estimating the Costs of an Adequate Education in New Jersey[1] by Dr. Bruce D. Baker, University of Miami.

Key Findings

  • New Jersey’s school funding formula shortchanges schools serving students from low-income families by about $5,300 per student.
  • This underfunding leaves 80 percent of Black and Latinx/Hispanic students in schools without enough resources.
  • Fixing the formula would cost about $3.5 billion each year but would close opportunity gaps and fulfill the state’s constitutional obligation.
  • This investment would bring school spending in line with levels before the 2008 recession, measured as a share of the state’s economy.

Every New Jersey student deserves access to quality education, no matter their income, race, gender, or disability. But a Black high school student, enrolled in a high-poverty district and in crisis, will have less access to a mental health professional than students in more affluent districts.[2] And a first-grader who speaks Spanish at home may have larger class sizes than students in nearby wealthier towns, preventing her from learning English as fast as she could.[3]

To deliver on the promise of a quality education, schools need enough funding to help students meet the state’s academic standards.[4] However, many New Jersey school districts, especially those in high-poverty communities, lack the resources they need to provide all students with an education that meets the state’s new, higher standards.[5] The state can fix this problem by increasing funding for school districts so they have the resources they need to educate their students properly.

This summary highlights key findings from Estimating the Costs of an Adequate Education in New Jersey by Dr. Bruce D. Baker.

A new report shows how New Jersey’s current school funding system falls short and outlines steps to fix it. The report provides a road map to guide the state toward properly funding its schools, as required by the New Jersey Constitution.

The report shows:

  • New Jersey ranks among the top states on national tests when looking at average student performance. This success stems largely from the state’s strong commitment to funding many of its schools adequately. Unfortunately, a large gap remains between test scores of students from low-income families and their wealthier peers.
  • Schools serving more students in poverty or English Language Learners (ELL) are not getting enough funding to close this opportunity gap.
  • This funding shortfall comes from problems with the state’s school funding formula. The current formula uses outdated assumptions to determine how much extra funding a district receives for each student who qualifies for free or reduced-price lunch, a measure of economic need.
  • Under the current school funding system, most Black and Latinx/Hispanic students attend schools that lack the resources they need, seriously harming their educational opportunities.
  • Fixing the formula to properly fund schools serving students from low-income families would cost about $3.5 billion; this would only be a nine percent increase in the total budgeted spending of New Jersey school districts for 2025-26.[6] This investment would bring total school spending close to what New Jersey spent before the 2008 recession, measured as a share of the state’s economy.[7]


High Test Scores for New Jersey Students, But an Opportunity Gap Remains

New Jersey ranks among the top states for school funding, spending a larger share of its economy on education than most states (see table below). However, like the rest of the nation, New Jersey’s funding dropped over recent years, with a temporary increase during the pandemic.[8] This pattern shows that the state can afford to increase school funding, climbing back to the funding levels it had before the 2008 recession.

New Jersey has has a relatively strong school funding effort, as well as high test scores.

New Jersey’s Strong Funding Yields High Test Scores

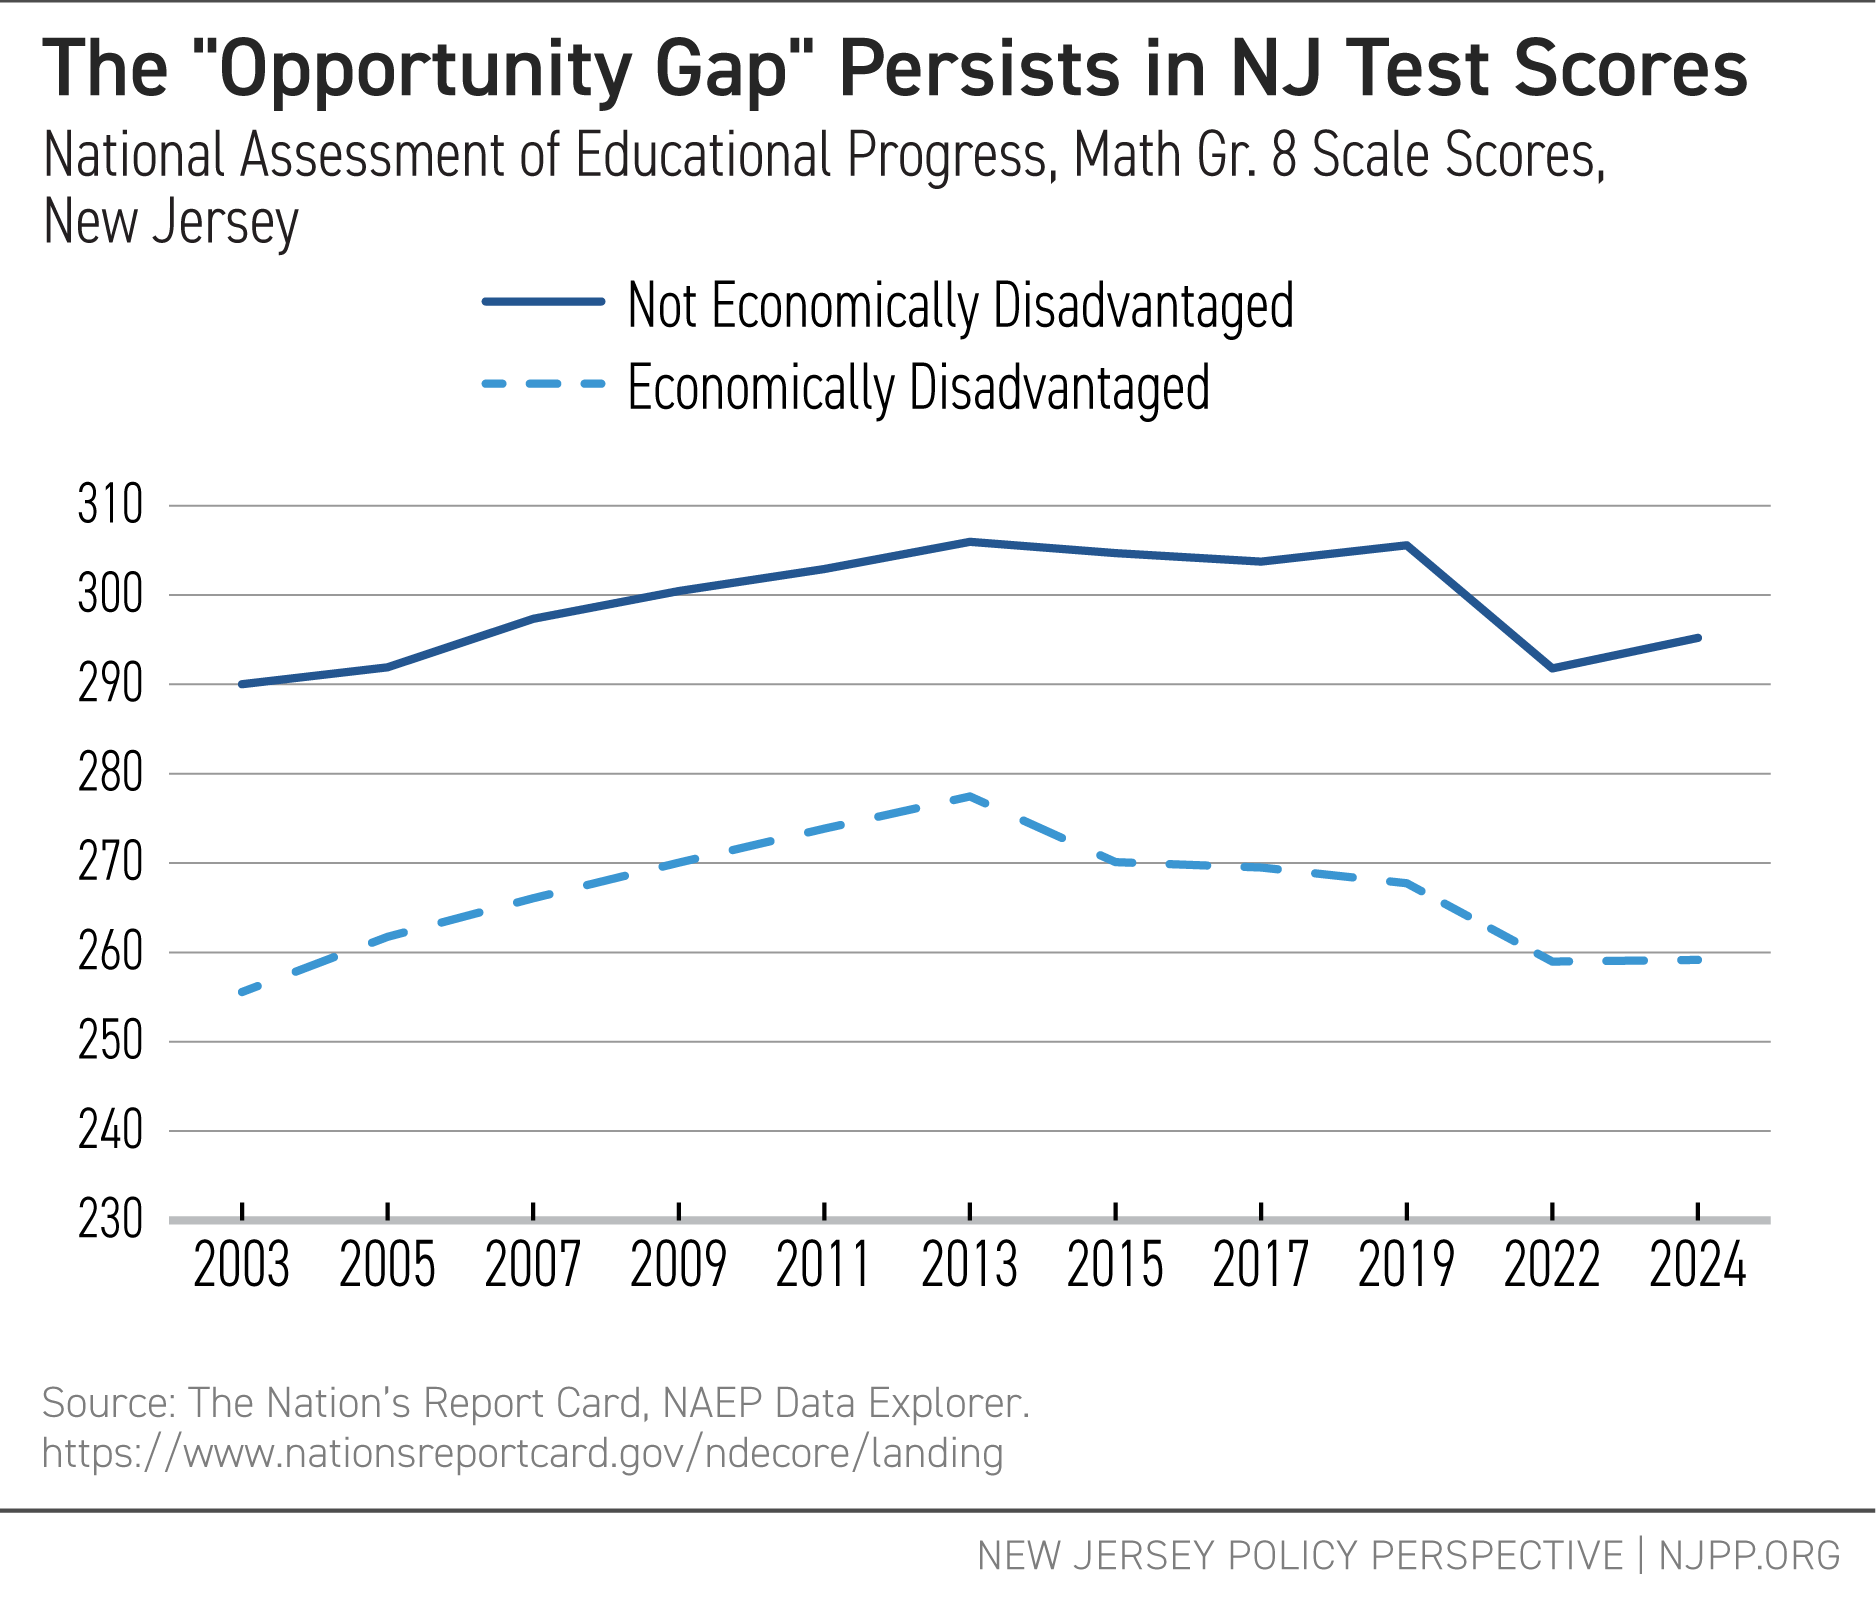
New Jersey’s strong school funding has resulted in higher test scores compared to other states, even after the nationwide drop in test scores following the Covid pandemic. For example, math scores in Grade 8 remain among the highest in the nation, even after the drop following the pandemic.

While this success should be celebrated, we must remember that these test scores are averages: many students score higher than average, but many score below.  Students in poverty continue to fall behind their peers. For example: while average Grade 8 math scores in New Jersey are high, the scores for economically disadvantaged students have consistently been below those of their more affluent peers.

The "Opportunity Gap" Persists in NJ Test Scores

These persistent gaps exist because schools serving students from low-income families lack the resources they need. Closing the opportunity gap between more and less affluent students should be a key goal of the state. That can happen only when all schools are funded properly.

Schools Serving Students Facing Economic Challenges Aren’t Getting Enough Funding

Why Additional Funding Matters

Students from low-income families need additional support to succeed in school. Smaller class sizes, trained education specialists, targeted programs, classroom supports, and extra services all require additional funding. Without these resources, students from low-income families will not have educational opportunities that equal their classmates from higher-income families.[9]

How the Formula Should Work

New Jersey’s school funding formula is based on providing additional funding for students if they qualify for free or reduced-price lunch (a measure of poverty), or if they speak English as a second language at home.[10]

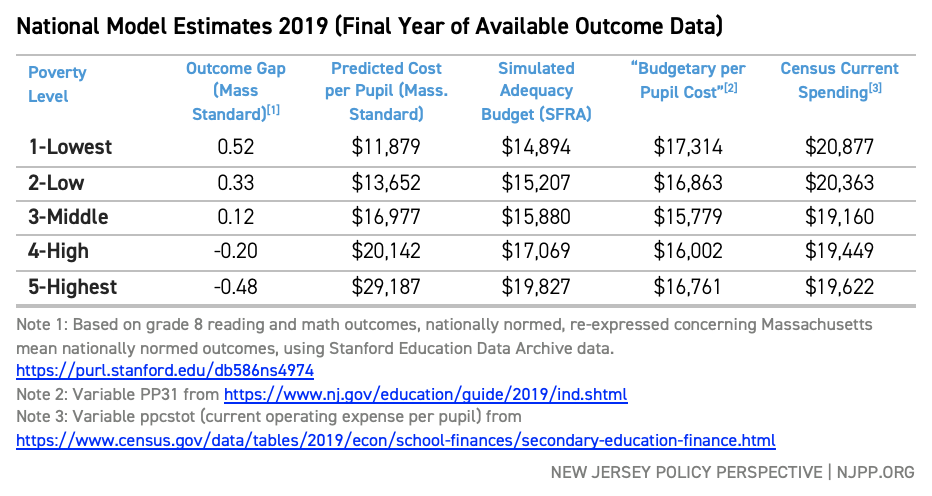
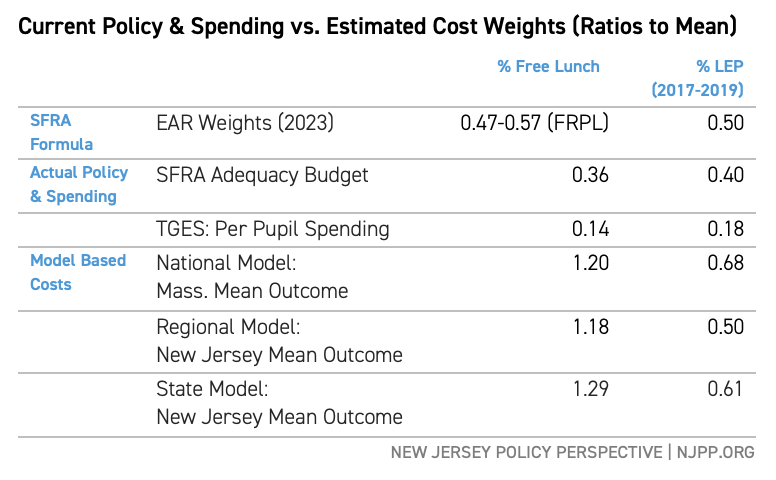
In theory, the school funding formula should provide significantly more money to schools serving more students in poverty. The formula includes extra funding for students who qualify for free or reduced-price lunch (FRPL), providing an additional 47 to 57 percent more funding per pupil. English Language Learners also receive an extra 50 percent more funding.

How the Formula Actually Works

In reality, the funding difference between high- and low-poverty schools is far too small. For every 10-percentage point increase in students qualifying for free and reduced-price lunch, schools spend only about $300 more per pupil on average. The same increase in English Language Learners results in about $400 more spending per pupil on average.[11]

Currently, for each student who qualifies for free or reduced-price lunch, schools receive only 21 percent more funding than they receive for a student who doesn’t qualify. This is far less than the 47 to 57 percent the formula intends. It’s also less than what the data says is needed to achieve rigorous outcomes.[12]

Changing the Funding Formula to Get More Money Where It Is Needed

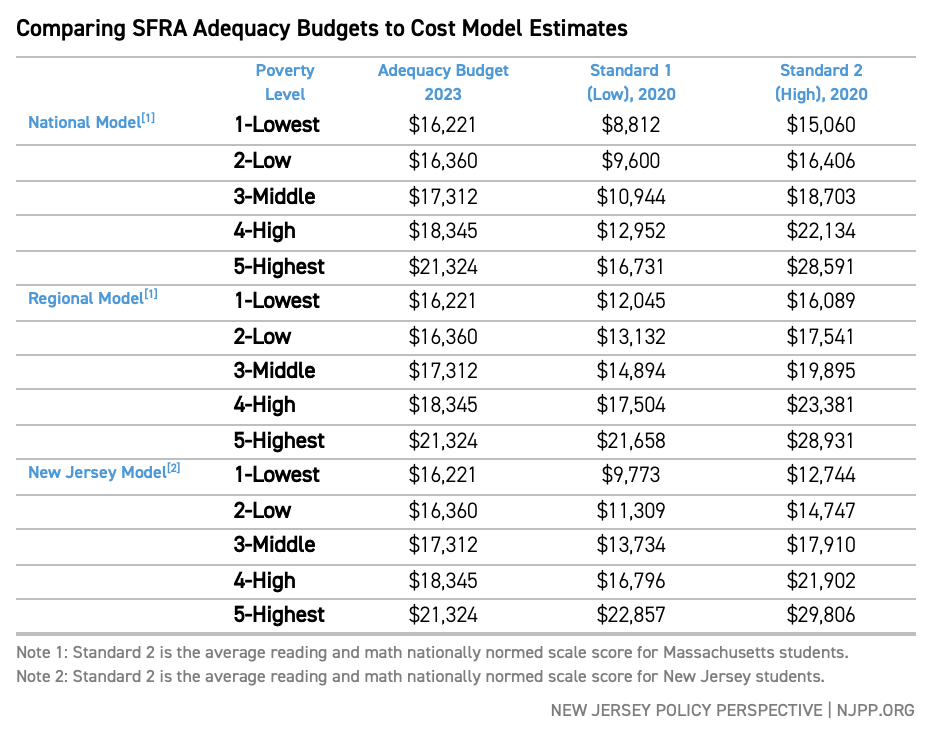
The report uses actual data on school spending, student characteristics, and test outcomes to calculate what funding is needed for all students to achieve strong results on state tests. The report calculates how much funding would raise the statewide test scores by an amount equal to the current gap between students from the wealthiest and poorest families.[13]

To Meet Its Goals, New Jersey Must Spend More on Schools With More Economically Disadvantaged Students

To meet this goal, schools should receive much more funding for each student from a low-income family.[14]  Currently, New Jersey schools spend an average of $2,960 more per student who qualifies for free or reduced-price lunch. To reach higher standards for all students, this amount should increase by $5,290 to a total of $8,880 per student.[15]

What Proper Funding Would Provide

The additional $5,290 per student from a low-income family would allow schools to:

  • Reduce class sizes so teachers can give each student more attention
  • Hire reading specialists and math coaches to help struggling students
  • Provide after-school tutoring and summer programs to prevent learning loss
  • Offer counselors and social workers to address barriers to learning that happen outside the classroom
  • Update textbooks, technology, and facilities to create better learning environments


Many of these resources are standard in schools serving wealthier students but often missing in schools serving low-income communities.

Students of Color Are More Likely to Be in Schools Without Enough Funding

New Jersey’s current school funding system severely disadvantages students of color. The majority of Black and Latinx/Hispanic students attend schools that lack adequate funding.[16] As a result, outcomes for these students suffer: Black and Latinx/Hispanic students have less access to advanced courses, experienced teachers, updated technology, and support services. These resource gaps directly limit their educational opportunities and future economic prospects. This racial and ethnic imbalance must be addressed by reforming the state’s school funding formula.

Most Black and Latinx/Hispanic Students Attend Underfunded Schools in New Jersey

Put another way: a Black or Latinx/Hispanic student in New Jersey has about a four in five chance of attending an underfunded school, while a white student has about a one in two chance. This difference reflects decades of policy decisions that have systematically underinvested in communities of color.[17]

Closing the Gap Costs $3.5 Billion, But NJ Can Afford It

Funding schools serving students in poverty properly requires tripling the additional funding these schools currently receive for each student from a low-income family who is enrolled.[18] With approximately 586,000 students who qualify for free or reduced-price lunch, the total investment would be about $3.5 billion each year.[19] To put this into perspective, New Jersey’s total state budget for fiscal year 2025 is about $59 billion.

This improvement represents about four-tenths of a percentage point of the state’s total economy.[20] Total K-12 spending would remain in line with levels before the Great Recession of 2008.[21]

More analysis will help figure out the exact formula changes needed. Until then, New Jersey policymakers must move urgently to take the following steps:

  • Change the current formula to increase the additional per-student funding for students from low-income families. Currently, each low-income student enrolled in a district raises per pupil spending $2,960; this amount should be increased to $8,880. This amount can be adjusted after conducting additional research.
  • Keep this higher funding level over the long term.
  • Remove the sliding scale that provides different amounts based on district poverty concentration.


The path forward is clear: New Jersey must return to previous levels of funding to fulfill its constitutional mandate to provide all students with an education that prepares them to succeed.


End Notes

[1] Baker, B.D. Estimating the Costs of an Adequate Education in New Jersey. Trenton, NJ: New Jersey Policy Perspective. 2025.

[2] Weber, M. A. New Jersey’s Black Students Suffer a Decline in Access to School Mental Health Staff. New Jersey Policy Perspective.

[3] Weber, M.A. The Consequences of School Underfunding. New Jersey Policy Perspective.

[4] Baker, B. D., & Knight, D. Does money matter in education? Washington, DC: Albert Shanker Institute. 2025.

[5] Baker, B.D., & Weber, M.A. New Jersey School Funding: The Higher the Goals, the Higher the Costs. Trenton, NJ: New Jersey Policy Perspective. 2022.

[6] Total expenditures for 2025-26 based on “Expenditures Net of Transfers” from the NJDOE’s User Friendly Budgets. https://www.nj.gov/education/budget/ufb/

[7] Baker, B.D. Estimating the Costs of an Adequate Education in New Jersey. Trenton, NJ: New Jersey Policy Perspective. 2025. p. 3.

[8] Baker, B.D., Di Carlo, M, & Weber, M.A. The Adequacy and Fairness of State School Finance Systems (7th edition), p. 8-11. Washington, D.C.: The Shanker Institute. 2025.

[9] Baker, B. D., & Knight, D. Does money matter in education? Washington, DC: Albert Shanker Institute. 2025.

[10] For an in-depth discussion of the  School Funding Reform Act’s (SFRA) funding formula, see: Baker, B.D., & Weber, M.A. Unlocking Academic Success: Revitalizing New Jersey’s School Funding Formula for Student Achievement. 2023.

[11] Baker, B.D. Estimating the Costs of an Adequate Education in New Jersey. Trenton, NJ: New Jersey Policy Perspective. 2025. p. 26. Table 3, “spend_2” shows the model estimate for increases in spending; the figures are divided by 10 to show the increase in spending given a 10-percentage point increase in either FRPL or ELL students.

[12] Regarding the difference between the implicit FRPL weight and the School Funding Reform Act (SFRA) formula weight: Many affluent districts spend well above the adequacy target set in the SFRA formula. The implicit weight is based on the actual differences in spending between districts: if districts with fewer FRPL students spend more than their adequacy target, the implicit FRPL weight will decrease to a level below the weight used in the SFRA formula. Put simply: the implicit weight is lower than the formula weight because low-FRPL districts spend more than their SFRA adequacy amount. It is also possible some high-FRPL districts are not spending what the formula says they should, possibly because they aren’t receiving all the local or state revenue the formula says they should receive. Further research is needed to determine the exact causes of this discrepancy.

[13] Baker, B.D. Estimating the Costs of an Adequate Education in New Jersey. Trenton, NJ: New Jersey Policy Perspective. 2025. p. 28. Formally, the report’s desired outcome is to raise the average state test score 1.0 standard deviations (1.0 SD). Several studies have found the achievement gap between 90th percentile household  income students and 10th percentile household income students is on the order of 1.0 SD. (Reardon, S.F. The Economic Achievement Gap in the US, 1960-2020:Reconciling Recent Empirical Findings. CEPA Working Paper No. 21.09. 2021. Retrieved from Stanford Center for Education Policy Analysis) The increase in funding would be due to raising the free and reduced-price lunch weight; consequently, the additional funding would be concentrated in higher-poverty districts, as would be the ensuing increase in test scores. Raising the average state test score by 1.0 SD would, therefore, be closing the opportunity gap.

[14] The School Funding Reform Act (SFRA) formula weights FRPL students between 0.47 and 0.57 based on the concentration of economic disadvantage in their school district: more concentrated disadvantage leads to a higher weight. The report’s analysis suggests this sliding scale should be replaced with a single, higher weight for all FRPL students.

[15] Baker, B.D. Estimating the Costs of an Adequate Education in New Jersey. Trenton, NJ: New Jersey Policy Perspective. 2025. Table 3, p. 26 (spending model “spend_2”). The calculation here takes the ratio of the estimated weight to the implicit weight (0.63 / 0.21 = 3.0) and multiplies that by the “actual” spending found in the model estimate.

[16] Baker, B.D. Estimating the Costs of an Adequate Education in New Jersey, Trenton, NJ: New Jersey Policy Perspective. 2025. pp. 29-30.

[17] Baker, B.D. & Weber, M.A. Separate and Unequal: Racial and Ethnic Segregation and the Case for School Funding Reparations in New Jersey. 2021.

[18] “Tripling” the weight means tripling the actual extra amount spent on a student in economic disadvantage over what is currently spent. The amount the weight would need to be changed in the SFRA formula to achieve this result would likely be different.

[19] NJDOE Fall Enrollment Reports, 2024-25.

[20] Bureau of Economic Analysis, “GDP by State.”

[21] As the table above shows, spending on K-12 education was 4.6% in 2020, 4.2% in 2021, and 5.0% in 2022 (the latest figure available). The wide swings in the latest years are due to effects from the pandemic; it is likely the effort figure will drop in 2023. Yet even if it doesn’t, a 0.4 percentage point increase still puts the effort figure near where it was before the Great Recession.

80% of Black and Latinx Students Attend Underfunded NJ Schools

TRENTON, NJ — New Jersey’s school funding formula shortchanges schools serving students from low-income families by about $5,300 per student, leaving 80 percent of Black and Latinx/Hispanic students in schools without adequate resources, according to a new report released today by New Jersey Policy Perspective (NJPP). The report, based on research by Dr. Bruce D. Baker of the University of Miami, shows that fixing the formula would cost about $3.5 billion annually — bringing school spending in line with levels before the 2008 recession, measured as a share of the state’s economy.

The report, Resetting School Funding for New Jersey’s Next Decade, reveals that while New Jersey ranks among the top states on national tests, a large gap remains between test scores of students from low-income families and their wealthier peers. Schools serving students in poverty currently receive only 21 percent more funding per student who qualifies for free or reduced-price lunch, far below the 47 to 57 percent the formula intends to provide.

“A Black high school student in a high-poverty district who is in crisis will have less access to a mental health professional than students in more affluent districts. A first-grader who speaks Spanish at home may face larger class sizes than students in nearby wealthier towns, preventing her from learning English as fast as she could,” said NJPP Special Analyst for Education Policy Dr. Mark Weber, author of the report summary and a Fellow at the National Education Policy Center. “This isn’t an accident. It’s the result of a funding formula that doesn’t provide schools with the resources they need to serve students from low-income families. New Jersey can fix this, and the path forward is clear.”

Key findings from the report:

  • Schools serving students in poverty receive far too little additional funding. For every 10-percentage point increase in students qualifying for free or reduced-price lunch, schools spend only about $300 more per pupil on average—nowhere near enough to provide smaller class sizes, specialists, and support services.
  • The racial equity crisis is stark. A Black or Latinx/Hispanic student in New Jersey has about a four in five chance of attending an underfunded school, while a white student has about a one in two chance. This difference reflects decades of policy decisions that have systematically underinvested in communities of color.
  • The solution is achievable. Schools should receive $8,880 more per student from a low-income family, up from the current $2,960. This additional $5,290 would allow schools to reduce class sizes, hire reading specialists and math coaches, provide after-school tutoring and summer programs, and offer counselors and social workers.
  • The investment is affordable. With approximately 586,000 students who qualify for free or reduced-price lunch, the total cost is about $3.5 billion each year — only a nine percent increase in the total budgeted spending of New Jersey school districts for 2025-26. This would bring total school spending close to what New Jersey spent before the 2008 recession, measured as a share of the state’s economy.


The additional funding would allow schools serving students from low-income families to provide resources that are standard in schools serving wealthier students but often missing in high-poverty communities, including smaller class sizes, reading specialists, after-school programs, and updated technology.

“New Jersey has a constitutional obligation to provide all students with an education that prepares them to succeed,” Weber added. “We know proper funding works. New Jersey’s high test scores prove that. But we’re leaving too many students behind, particularly Black and Latinx students. The state must act now to fulfill its constitutional mandate and ensure every student has the opportunity to thrive.”

The report recommends that New Jersey policymakers urgently change the current formula to increase the additional per-student funding for students from low-income families from $2,960 to $8,880, keep this higher funding level over the long term, and remove the sliding scale that provides different amounts based on district poverty concentration.

The full report is available at njpp.org.

###

How Does New Jersey Fund Its Schools — And How Can We Make It Fairer?

Table of Contents
    Add a header to begin generating the table of contents

    New Jersey leads the nation in education spending and student achievement.[1] In 2024, for example, New Jersey eighth graders ranked among the top three states in both mathematics and reading on national tests.[2] Much of the success of New Jersey’s schools can be attributed to the strong effort it makes to fund its schools: the state spends more on K-12 education, as a percentage of its economy, than any other state in the nation.[3]

    Despite these successes, New Jersey faces a persistent achievement gap. Black and Latinx/Hispanic students consistently underperform compared to white students, and students from low-income families lag behind their peers.[4] This gap stems partly from lack of funding: New Jersey’s students of color are often in schools that lack the funding they need to provide a quality education.[5]

    School funding policy affects more than students, families, teachers, and education advocates. New Jersey spends more on K-12 education than any other budget category as a percentage of state and local spending.[6] All of New Jersey’s taxpayers have an interest in understanding how the state funds its schools.

    This explainer provides an overview of school funding in New Jersey: why funding matters, where funding comes from, the state’s role in funding schools, and how school funding can be improved.

    Why does funding matter for schools?

    Funding matters for schools because schools need money to provide the services and staff necessary to support students. Greater funding leads to better outcomes: higher test scores, increased graduation rates, and better college completion rates.[7] These outcomes produce economic gains and better standards of living while improving health.[8]

    Bottomline: Students need well-funded schools to succeed.

    Do some schools need more resources than others?

    An important principle in school funding is equal educational opportunity: All students should have the same chance to achieve rigorous educational goals, regardless of their backgrounds.

    Students who struggle with economic, linguistic, or accessibility barriers face greater educational challenges than others. New Jersey school funding law recognizes three types of students in particular:[9]

    1. Students from low-income families. These are students who qualify for free or reduced-price lunch (FRPL) under the National School Lunch Program. These students live in households with an income lower than 185 percent of the poverty line.
    2. Students who are multilingual learners. These students are often referred to as "English language learners" or "Limited English Proficient" students.
    3. Students with learning disabilities. This includes speech and language impairments, autism, visual and hearing impairments, health impairments, specific learning disabilities such as dyslexia, and others. Federal and state law recognizes 13 special education classifications.

    Because these students have more obstacles to their education, they need extra support: smaller classes, specialized educators, social services, health services, remedial instruction, and so on. When a school district has more students facing these challenges, it needs more funding to serve those students’ needs.

    Where do New Jersey public schools get their funding?

    School funding is a mix of federal, state, and local revenues. Federal funding is a small part of New Jersey’s school funding. Most school funding comes from a mix of local taxes and state aid.

    Most of New Jersey's School Revenues are Split Between State and Local Sources - Pie chart illustrating the sources of school revenues: 47.2% state, 46.3% local, and 6.5% federal.

    The data above include revenues for charter schools, which are publicly-funded schools that operate independently from traditional school districts. The data does not include private schools.

    Why is state funding necessary for schools?

    The New Jersey Constitution guarantees all school-aged children in the state access to a “thorough and efficient system of free public schools.”[10] To meet this constitutional mandate, New Jersey’s courts have ruled the state must “...create a funding formula based on curriculum content standards and to demonstrate that the formula addresses the needs of disadvantaged students everywhere...”[11]

    New Jersey maintains statewide content standards across multiple content areas with clearly defined learning goals.[12] If a district cannot raise enough local revenue to meet these state standards, the state’s courts have ruled that the state must step in and help.[13]

    New Jersey school districts raise their local funds primarily through property taxes, but some districts have higher property values than other districts. Districts with higher property values can raise revenue more easily than districts with lower property values. This puts an unfair burden on less-affluent districts, which must increase their tax rates more than affluent districts to raise the same amount of money.

    Here’s how: Imagine two school districts of the same size, but with different districtwide property values per pupil. To raise an equal amount of revenue (in this example, $10,000 per pupil), the district with lower property values has to have a higher tax rate than the district with higher property values.

    Example: Property Values and Tax Rates in a Hypothetical School District - Table

    To make tax rates more fair for less-affluent districts, school districts with lower property values need more revenue from sources outside their district. This is why New Jersey provides state aid to school districts: it allows the state to fulfill its constitutional mandate and it saves local taxpayers from paying extremely high property taxes.

    How do New Jersey leaders decide how much state funding a school district will receive?

    After years of legal challenges from underfunded school districts, New Jersey state leaders passed the School Funding Reform Act (SFRA) in 2008.[14] The law spells out a formula that determines how much state funding, in the form of state aid, every school district gets. The courts have found that the SFRA formula — which accounts for a variety of student characteristics, district property values, and other factors — allows the state to meet its constitutional mandate, so long as the formula is implemented correctly and the state fully funds it.[15]

    How does the state’s school funding formula work?

    The SFRA is complex. It grants several different types of state aid to school districts. The most important of these is “equalization aid,” which is distributed through this simplified formula:

    District Adequacy Budget - Local Fair Share = Equalization Aid

    To break down each of these parts:

    • District adequacy budget. This is the amount of funding the SFRA formula says a district needs to educate its students at the level the state constitution demands.[16] Districts with more students in poverty or more Multilingual Learners will have larger adequacy budgets.
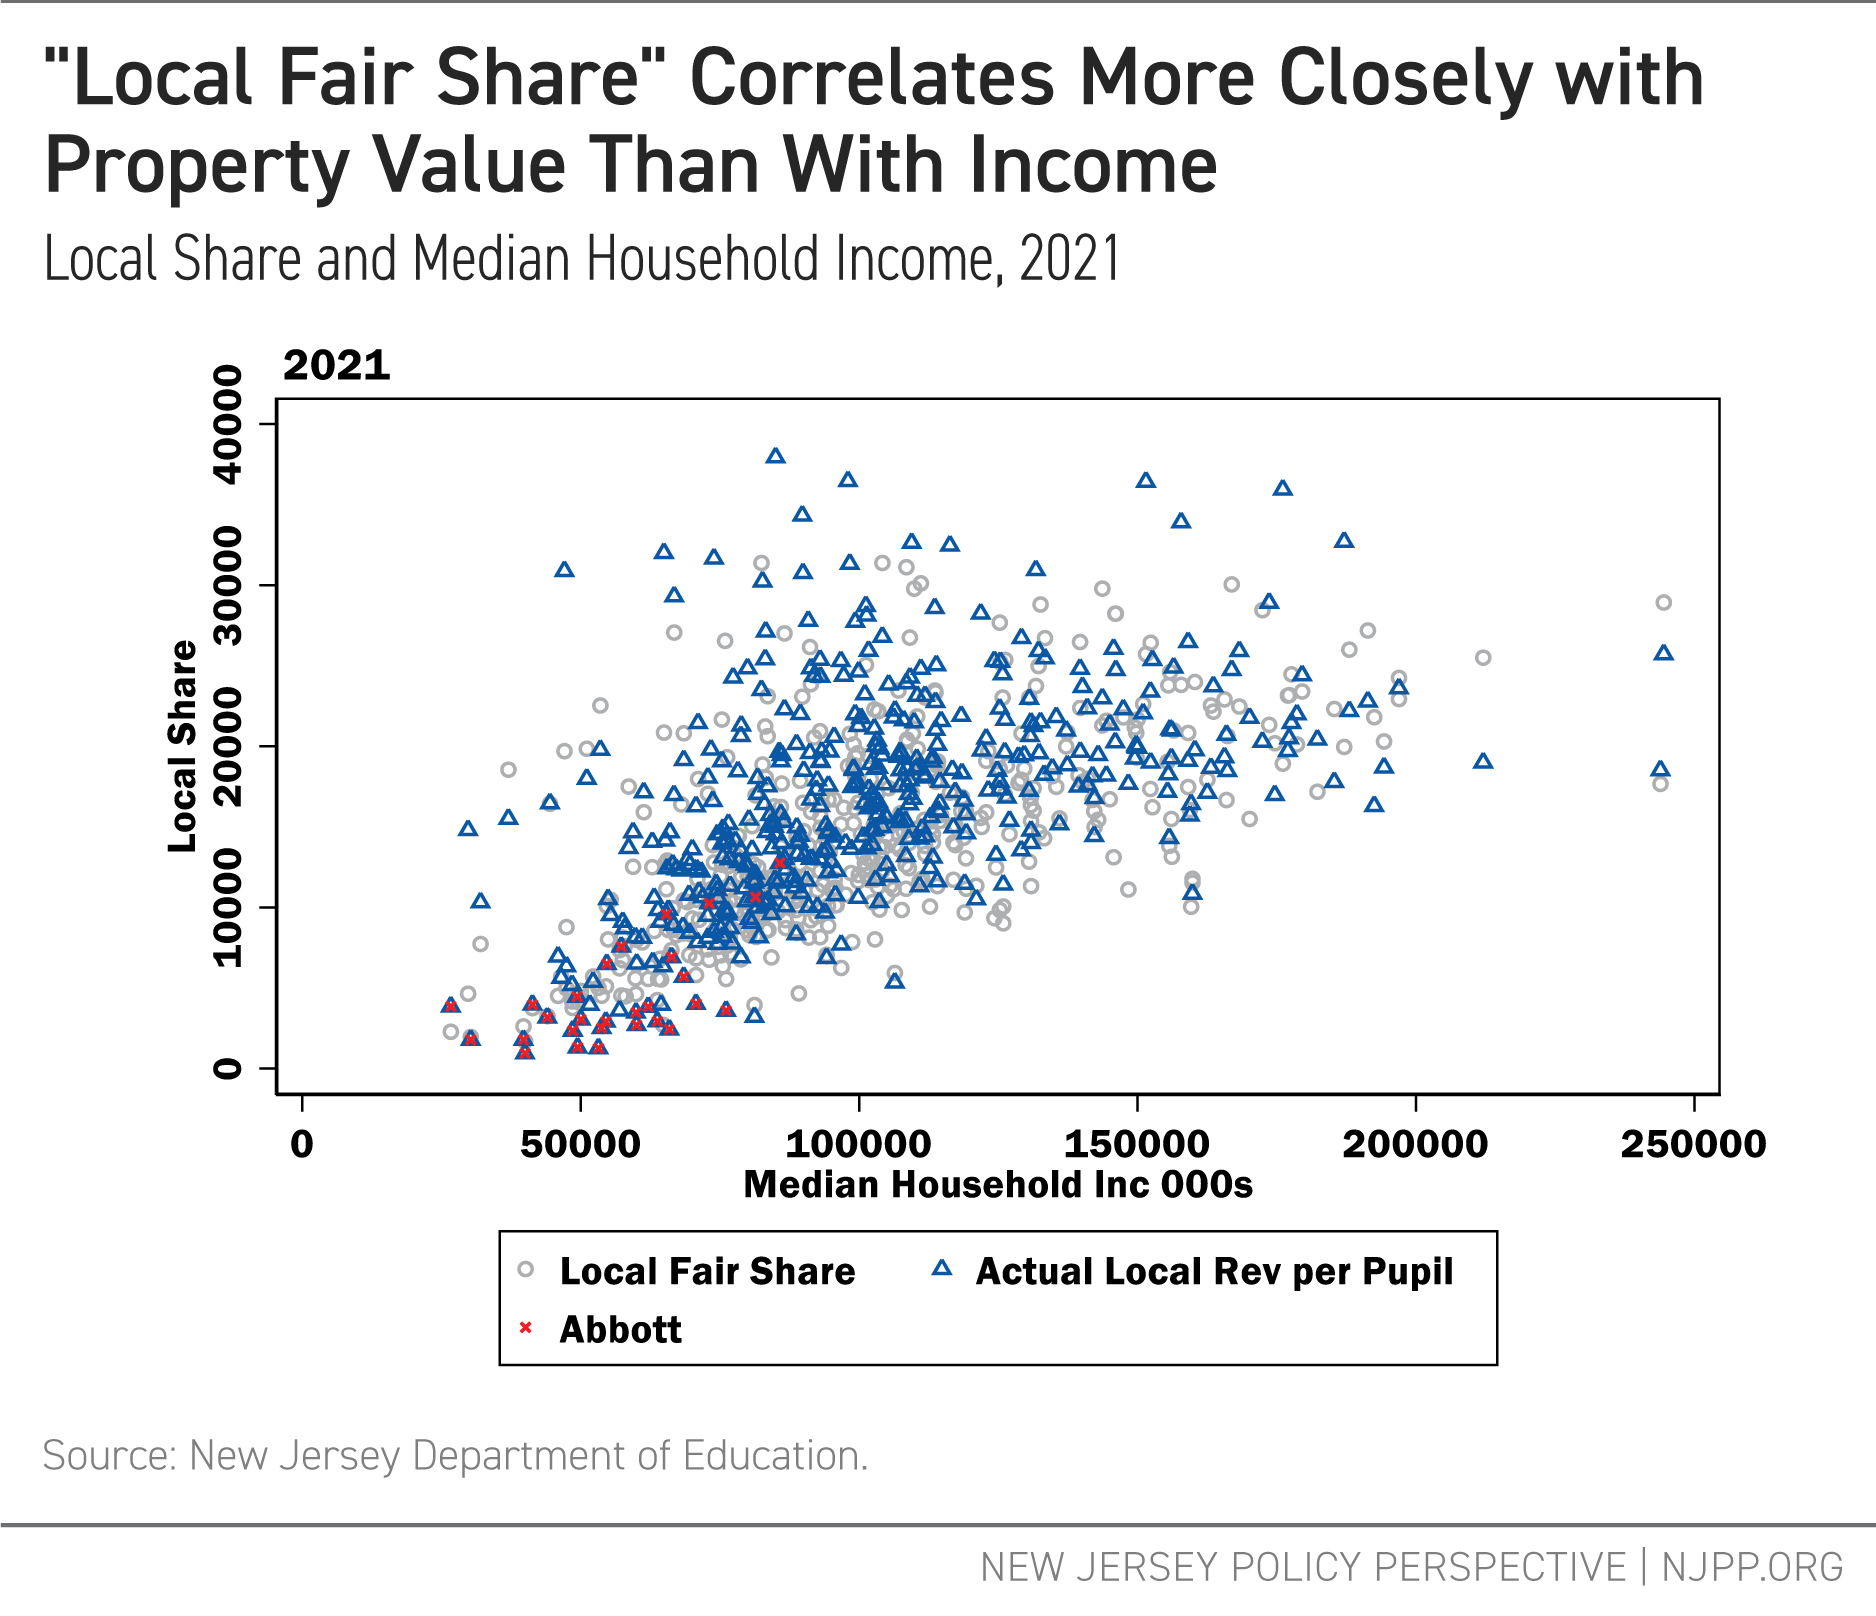
    • Local fair share. This is the amount of money the law says is fair, given the district’s property values and resident wealth, for a district to tax itself for its schools. In general, districts with higher property values (per pupil) will have higher local fair shares than districts with lower property values, because it is easier for affluent districts to raise local revenues than less-affluent districts.[17]
    • Equalization aid. When the local fair share is subtracted from the adequacy budget, the amount left is the amount of state funding a district should receive. That funding is called “equalization aid.”[18]

    In addition to adequacy aid, the SFRA also grants aid that is “off formula”:

    • Categorical aid. This is state aid districts receive even if their budgets could be covered entirely by their local fair share. In other words, categorical aid is aid outside the adequacy budget. Categorical aid includes funding for security, transportation, and, importantly, special education.

    The SFRA has several additional provisions that affect the distribution of state aid. However, the adequacy formula, local fair share, and categorical aid are the heart of its funding formula.

    It is important to note that even though this formula is spelled out in law, the state never fully funded its obligations through the formula until recently.[19] For years, districts were expected to adequately educate students, even when they weren’t receiving the state aid the SFRA says they should have. In 2024, Governor Phil Murphy announced his budget for FY2025 would “...fully fund New Jersey’s school funding formula…”[20] As we discuss below the SFRA formula is out of date and does not provide the funding needed to meet the state’s current learning standards.

    How do poverty and other factors affect the state’s calculation of school funding?

    Schools enrolling more students who live in poverty, or who are multilingual learners, require more resources to adequately meet the needs of those students. Smaller class sizes, multilingual instruction specialists, classroom supports, health services, social workers, and other supports for at-risk students all require additional funding. Without it, students facing economic barriers will not have equal educational opportunities.[21]

    In the 2024-25 school year, 42 percent of New Jersey students qualified for free or reduced-price lunch, a measure of student poverty — that's more than 550,000 students, nearly half of all students in New Jersey.[22] Eleven percent of students were multilingual learners. These students’ schools need additional funding if they are to provide an adequate education.

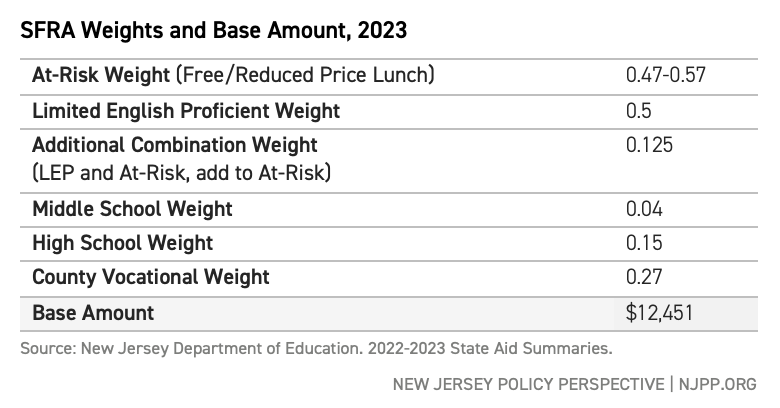
    To provide that additional funding, the SFRA adequacy formula uses “weighted student enrollment.” The formula starts by giving every student a weight of 1.0. Students who are Multilingual Learners (ML) get an extra weight of 0.5. In other words, when counting up the weighted student enrollment, every ML student counts as a student-and-a-half.

    Students who qualify for free or reduced-price lunch (FRPL) are weighted between 0.47 and 0.57 more, depending on the concentration of economic disadvantage in their district.[23] Middle school students are weighted more than elementary students. High school students are weighted more than that, and vocational-technical students even more. 

    The table below gives an example of how weighted student enrollment works. A hypothetical school district has 1,000 students. Five percent are multilingual language learners, and 10 percent qualify for free or reduced-price lunch. Because ML students are weighted at 0.5, every one counts as a student-and-a-half. Half a student is added to the total weighted student enrollment for each ML student. The FRPL weight of 0.47 adds another 47 students to the weighted count. The result is an additional 72 students are added to the final weighted student enrollment figure.

    Example: Weighted Student Enrollment in a Hypothetical School District - Table

    Calculating Adequacy Budgets

    Once the weighted student enrollment is calculated, it is multiplied by the “base cost”: the per pupil amount New Jersey has determined is needed to educate an elementary school student who is not in economic disadvantage and is not a multilingual learner. As our example shows below, the result is that school districts enrolling more students facing economic barriers or ML students will have larger adequacy budgets.

    Example: Unweighted and Weighted Adequacy Budgets in a Hypothetical School District - Table

    Note that students with learning disabilities are not weighted in the same way as FRPL or ML students. Special education funding is discussed below.

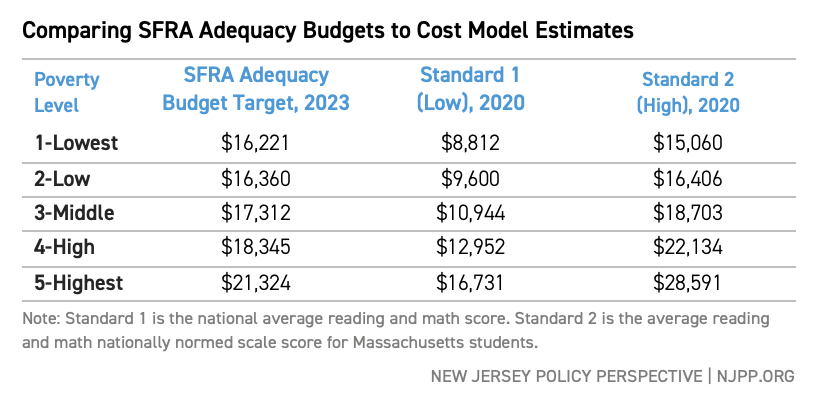
    This system can only work if the base amount and weights are correct. If the base cost is lower than what’s actually needed, the district adequacy formula will not provide enough funding for school districts to meet their goals. Furthermore, if the base cost is correct but the weights are too low (and there is not enough additional funding for students who face greater obstacles), districts with high proportions of students who live in poverty or speak English as a second language will have district adequacy budgets that are much lower than they need to be to fully support students.

    How does New Jersey fund special education?

    Students with learning disabilities are not weighted in the same way as free/reduced-price lunch or ML students in the SFRA adequacy formula. Until recently, the state assumed the same percentage of students in every district would have special education needs, and calculated aid accordingly. This is known as “census-based” funding.[25] The rationale for using it was that, if the state instead weighted students with disabilities like FRPL or ML students, districts would be incentivized to over-classify students, since more state aid would flow to them if they did.

    Recently, Governor Phil Murphy proposed using actual special education enrollment numbers in place of census-based funding.[26] The SFRA law remains unchanged as of this writing. Whether actual counts of students with disabilities will be used in the future depends on the actions of state leaders over the next year.

    A portion of special education funding is categorical aid and “off formula.” In other words, districts receive that funding, even if they have enough local funding to provide an adequate education for their students.[27] This is one of the primary reasons why even the most affluent districts, whose local fair share easily covers their budgets, still get some state funding. The SFRA also provides “extraordinary special education aid” for districts that enroll students who have exceptionally high-cost needs.[28]

    Does the school funding formula provide enough money for students to meet the state’s standards?

    The SFRA formula recognizes that students in poverty, multilingual learners, and students with disabilities need more resources to be able to meet the state’s standards. The formula can only provide New Jersey’s schools with what they need if it has been calibrated correctly. Specifically: the base amount has to match the true per pupil amount needed to provide an education that meets constitutional standards to students in grades K through 5, and the weights must accurately reflect the additional costs of providing equal educational opportunity to all students.

    Evidence shows that the SFRA weights are not correct. Therefore, districts with higher concentrations of poverty often do not receive the funding they need.[29] Since the original law passed in 2008, New Jersey has raised its educational standards. This means more money is needed to provide an adequate education for all students.[30] Resetting the weights to reflect the actual costs of meeting New Jersey’s current standards is necessary for the SFRA to remain in compliance with New Jersey’s constitution.

    How are charter schools funded?

    Charter schools are independent schools that operate separately from traditional public school districts. If a resident student chooses to attend a charter school, their home school district “passes through” 90 percent of the funding for that student, based on their characteristics (ML, FRPL, special education).[31] The funding includes both state aid and local revenues. The charter funding formula matches the SFRA adequacy formula closely, passing through more funding when more students with special needs enroll in a charter.

    The theory behind only giving 90 percent of the per student funding amount is that public school districts have fixed costs that don’t decline when students leave to attend charter schools. If a few students leave a school, the school still has to be heated, cooled, cleaned, and maintained at the same cost. This raises per pupil costs for the district. Districts are also required, by law, to provide transportation to resident students enrolled in charters, and to administer the disbursement of payments to those charters.[32]

    It is critically important that, for the fiscal health of school districts, these additional costs are reflected in the state’s school funding system. To date there has been no state-sponsored study done to determine the actual fiscal impact of charter schools on public school districts. This is a serious oversight that must be addressed.

    Other states offer vouchers for private school; how would they affect school funding in New Jersey?

    Private school vouchers would almost certainly raise costs for New Jersey taxpayers and would not close school funding gaps in the state.[33]

    In other states that have implemented voucher programs, a large proportion of students receiving vouchers were already enrolled in private schools. Because these students would attend private school even without a voucher, subsidizing them becomes an additional burden on the state budget.[34]

    Recent studies have also shown students in large-scale voucher programs perform significantly worse on standardized tests than their public school counterparts, even when controlling for student differences.[35] Worse results for more money is a bad deal for New Jersey.

    How can we improve school funding in New Jersey?

    There are several steps the state can and should take to improve school funding:

    • Make funding data transparent. The school funding formula calculations are not published publicly and are difficult to understand and interpret. The state should create an easy-to-read version of this data, as it has for other fiscal and education data.
    • Update the funding formula. The state should hire outside experts to evaluate the calibration of the school funding formula so the base and weights in the formula are set correctly.
    • Fix special education funding. The state should convene a task force on special education funding with a mandate to improve the school funding formula’s accounting for students with learning disabilities.
    • Study charter school costs. The state should undertake a study of the fiscal impact of charter schools on school districts so financial harm from charter school enrollments are reduced.
    • Reject school privatization. The state should firmly reject any attempt to bring vouchers, education savings accounts, or other forms of school privatization into New Jersey.


    End Notes

    [1] Rosenberg, L., N.J. schools are No. 1 in the nation, new ranking says. nj.com. May. 07, 2025.

    [2] National Center for Education Statistics. The Nation’s Report Card, State Profiles, New Jersey. Ranks are based on figures rounded to the nearest point. Department of Defense schools are excluded.

    [3] School Finance Indicators Database. State School Finance Profiles. 2025.

    [4] Gross, H.NJ students fail to regain ground lost during pandemic. NJ Spotlight. Jan. 29, 2025.

    [5] Baker, B.D. and Weber, M.A.. Separate and Unequal: Racial and Ethnic Segregation and the Case for School Funding Reparations in New Jersey. New Jersey Policy Perspective. 2021.

    [6] Urban Institute. State Fiscal Briefs: New Jersey. Sep. 2025.

    [7] Baker, B.D. & Knight , D. Does Money Matter In Education? Third Edition. Albert Shanker Institute. January 2025.
    Northwestern Institute for Policy Research. The Benefits of Increased School Spending. March, 2017.

    [8] Raghupathi, V., Raghupathi, W. The influence of education on health: an empirical assessment of OECD countries for the period 1995–2015. Arch Public Health 78, 20. 2020.

    Learning Policy Institute. Student Mental Health and Education [Fact sheet]. 2025.

    Learning Policy Institute. How Money Matters: Education Funding and Student Outcomes [Fact sheet]. 2025.

    Hanushek, E.A.,  Ruhose, J., & Woessmann, L. “Economic Gains from Educational Reform by US States.” Journal of Human Capital 11:4, 447-486. 2017.

    [9] N.J. P.L. 2007, Chapter 260. “The School Funding Reform Act.”

    [10] New Jersey State Constitution (1947).

    [11] Abbott, et al. v. Fred G. Burke, Commissioner of Education, et al. (Abbott XX).

    [12] NJ Dept. of Education. New Jersey Student Learning Standards. 2025.

    [13] Education Law Center. The History of Abbott v. Burke.

    [14] N.J. P.L. 2007, Chapter 260. “The School Funding Reform Act.”

    [15] Baker, B.D. &  and Weber, M. Reforming School Funding in New Jersey: Equity For Taxpayers, Excellence For Students. Trenton, NJ: New Jersey Policy Perspective. 2024.

    [16] Baker, B.D., & Weber, M.A. Unlocking Academic Success: Revitalizing New Jersey’s School Funding Formula for Student Achievement. New Jersey Policy Perspective. 2023.

    [17] The SFRA’s local fair share formula takes into account both property values and resident income. These two factors are closely correlated, but there are variations. This explains why two districts with the same property value per pupil but different income per pupil might have different local fair shares.

    [18] N.J. P.L. 2007, Chapter 260, Section 10. “The School Funding Reform Act.”

    [19] Fuller, C. Understanding New Jersey School State Aid Funding. New Jersey School Boards Association. 2024.

    [20] State of New Jersey, Governor Phil Murphy. Governor Murphy Highlights Record School Funding Increase in Fiscal Year 2025 Proposed Budget Plan Feb. 29, 2024.

    [21] Baker, B. D., & Knight, D. Does money matter in education? Albert Shanker Institute. 2025.

    [22] Data source: NJ Department of Education. Fall Enrollment Reports. 2024.

    [23] The SFRA formula has a “combo” weight for students who are both multilingual learners and qualify for free or reduced-price lunch. For simplicity’s sake, we omit this weight from our example.

    [24] NJDOE, Education Adequacy Report, p.5. 2025.

    [25] Farrie, D. & Ciullo, N. The Impact Of Census-Based Funding For Special Education. Education Law Center. April 2024.

    [26] Gross, H. NJ school aid destined for big changes? NJ Spotlight. Feb. 26, 2025.

    [27] That proportion is stated as one-third in the SFRA law. (N.J. P.L. 2007, Chapter 260. “The School Funding Reform Act.” ) In reality, however, districts have not always received this amount, as the SFRA formula was underfunded.

    [28] N.J. P.L. 2007, Chapter 260, Section 13. “The School Funding Reform Act.”

    [29] Baker, B.D. &  and Weber, M. Reforming School Funding in New Jersey: Equity For Taxpayers, Excellence For Students. Trenton, NJ: New Jersey Policy Perspective. 2024.

    [30] Baker, B.D., & Weber, M.A. New Jersey School Funding: The Higher the Goals, the Higher the Costs.  New Jersey Policy Perspective. Feb. 2, 2022.

    [31] Rubin, J.S. New Jersey Charter School Funding. Rutgers University SOAR Repository. 2015.

    [32] N.J.S.A. 18A:36A-12. “Charter School Program Act Of 1995

    [33]  Weber, M. (2024) No Matter What You Call Them, Private School Vouchers Are Bad for New Jersey. New Jersey Policy Perspective. Apr. 16, 2024.

    [34] Weber, M. (2024) No Matter What You Call Them, Private School Vouchers Are Bad for New Jersey. New Jersey Policy Perspective. Apr. 16, 2024.

    [35] Lubienski, C., Faulkner, P., Canbolat, Y., & Curlin, J. Summary of Research on School Vouchers.  Center for Evaluation and Education Policy, Indiana University, Bloomington. 2023.

    New Jersey Pensions Are the Least Generous in the U.S. For New Teachers

    Every child deserves a high-quality education, and every teacher who dedicates their career to this mission deserves financial security in retirement. Yet, in New Jersey, new teachers are getting a raw deal. As the state struggles with a growing teacher shortage, one major barrier to recruitment and retention is compensation — not just salaries, but also retirement benefits.

    Compared to states with similar pension programs, New Jersey’s retirement benefits for newly hired teachers are the least generous in the nation. Among the 38 states with defined benefit pension plans for public school teachers, New Jersey ranks dead last. This is largely due to a combination of policy choices: a low “benefit factor” (the percentage of salary that accrues toward a pension each year), a high retirement age, a long vesting period, a lengthy average salary calculation period, and the absence of cost-of-living adjustments.

    These shortfalls stem from policy changes made in 2011 through Chapter 78, which created a new pension tier (Tier 5) for teachers hired after that year. These changes raised contribution rates, increased the retirement age, and cut the value of benefits — leaving today’s teachers with the weakest defined benefit pension plans in the country.

    If New Jersey wants to attract and retain the highly qualified, diverse educator workforce that students deserve, the state must reform its pension system. Eliminating Tier 5 and restoring fairer benefits would bring the state closer in line with national standards and help ensure that the teachers shaping our future can retire with dignity.

    Background

    Like many other states, New Jersey is facing a teacher shortage.[1] As the New Jersey Policy Perspective (NJPP) has reported, the state now enrolls significantly fewer teacher candidates in preparation programs than it did a decade ago, signaling an alarming trend in the educator pipeline.[2] Compensation remains a major obstacle to attracting and retaining teachers, with research consistently showing that lower pay and weaker benefits reduce recruitment and retention.[3]

    Teacher Retirement Plan Types

    ·    Defined Benefit: Employees contribute a percentage of their income throughout their careers and receive a guaranteed benefit upon retirement. Defined benefit plans are what are typically thought of as “pensions.”

    ·    Defined Contribution: Both employees and employers contribute to the plan, but the retirement benefit is not predetermined. Instead, the final amount depends on contributions and investment performance. These plans function similarly to 401(k)s in the private sector.

    ·    Hybrid: Plans that combine elements of both defined benefit and defined contribution plans. Hybrid plans often have a defined benefit component that requires relatively smaller contributions than full defined benefit plans, but also have a smaller benefit factor.

    Strong retirement benefits can help offset lower salaries by increasing overall compensation; however, New Jersey’s pension system has moved in the opposite direction. Over the last decade, teachers have paid more into their pensions while receiving less in return.

    Chapter 78, passed in 2011, not only increased employee contribution rates to record highs but also created a new pension tier, “Tier 5,” for teachers hired after June 2011. [4] Compared to earlier tiers, Tier 5 raised the normal retirement age and lowered the benefit factor — the amount a pension grows with each year of service as a percentage of a teacher’s final salary. As a result, Chapter 78 hits new teachers the hardest, just as the state needs more qualified workers to consider entering and staying in the profession.

    In 2017, NJPP published a report quantifying the damage caused by Chapter 78, finding that New Jersey’s pensions were already among the least generous in the country. [5]  This updated analysis, using refined methods and the most recent data, finds that little has changed. Without action to address the state’s inadequate retirement benefits for new teachers, New Jersey will continue to struggle to attract and retain the high-quality educators its students deserve.

    Ranking Pension Generosity

    Retirement programs for teachers vary widely between states, making direct comparisons complex. However, there are various factors many plans have in common. This report compares these factors and ranks their relative value for plan members. It then weighs each factor and averages a state’s rank to arrive at a final grade. Further details can be found in the Appendix.

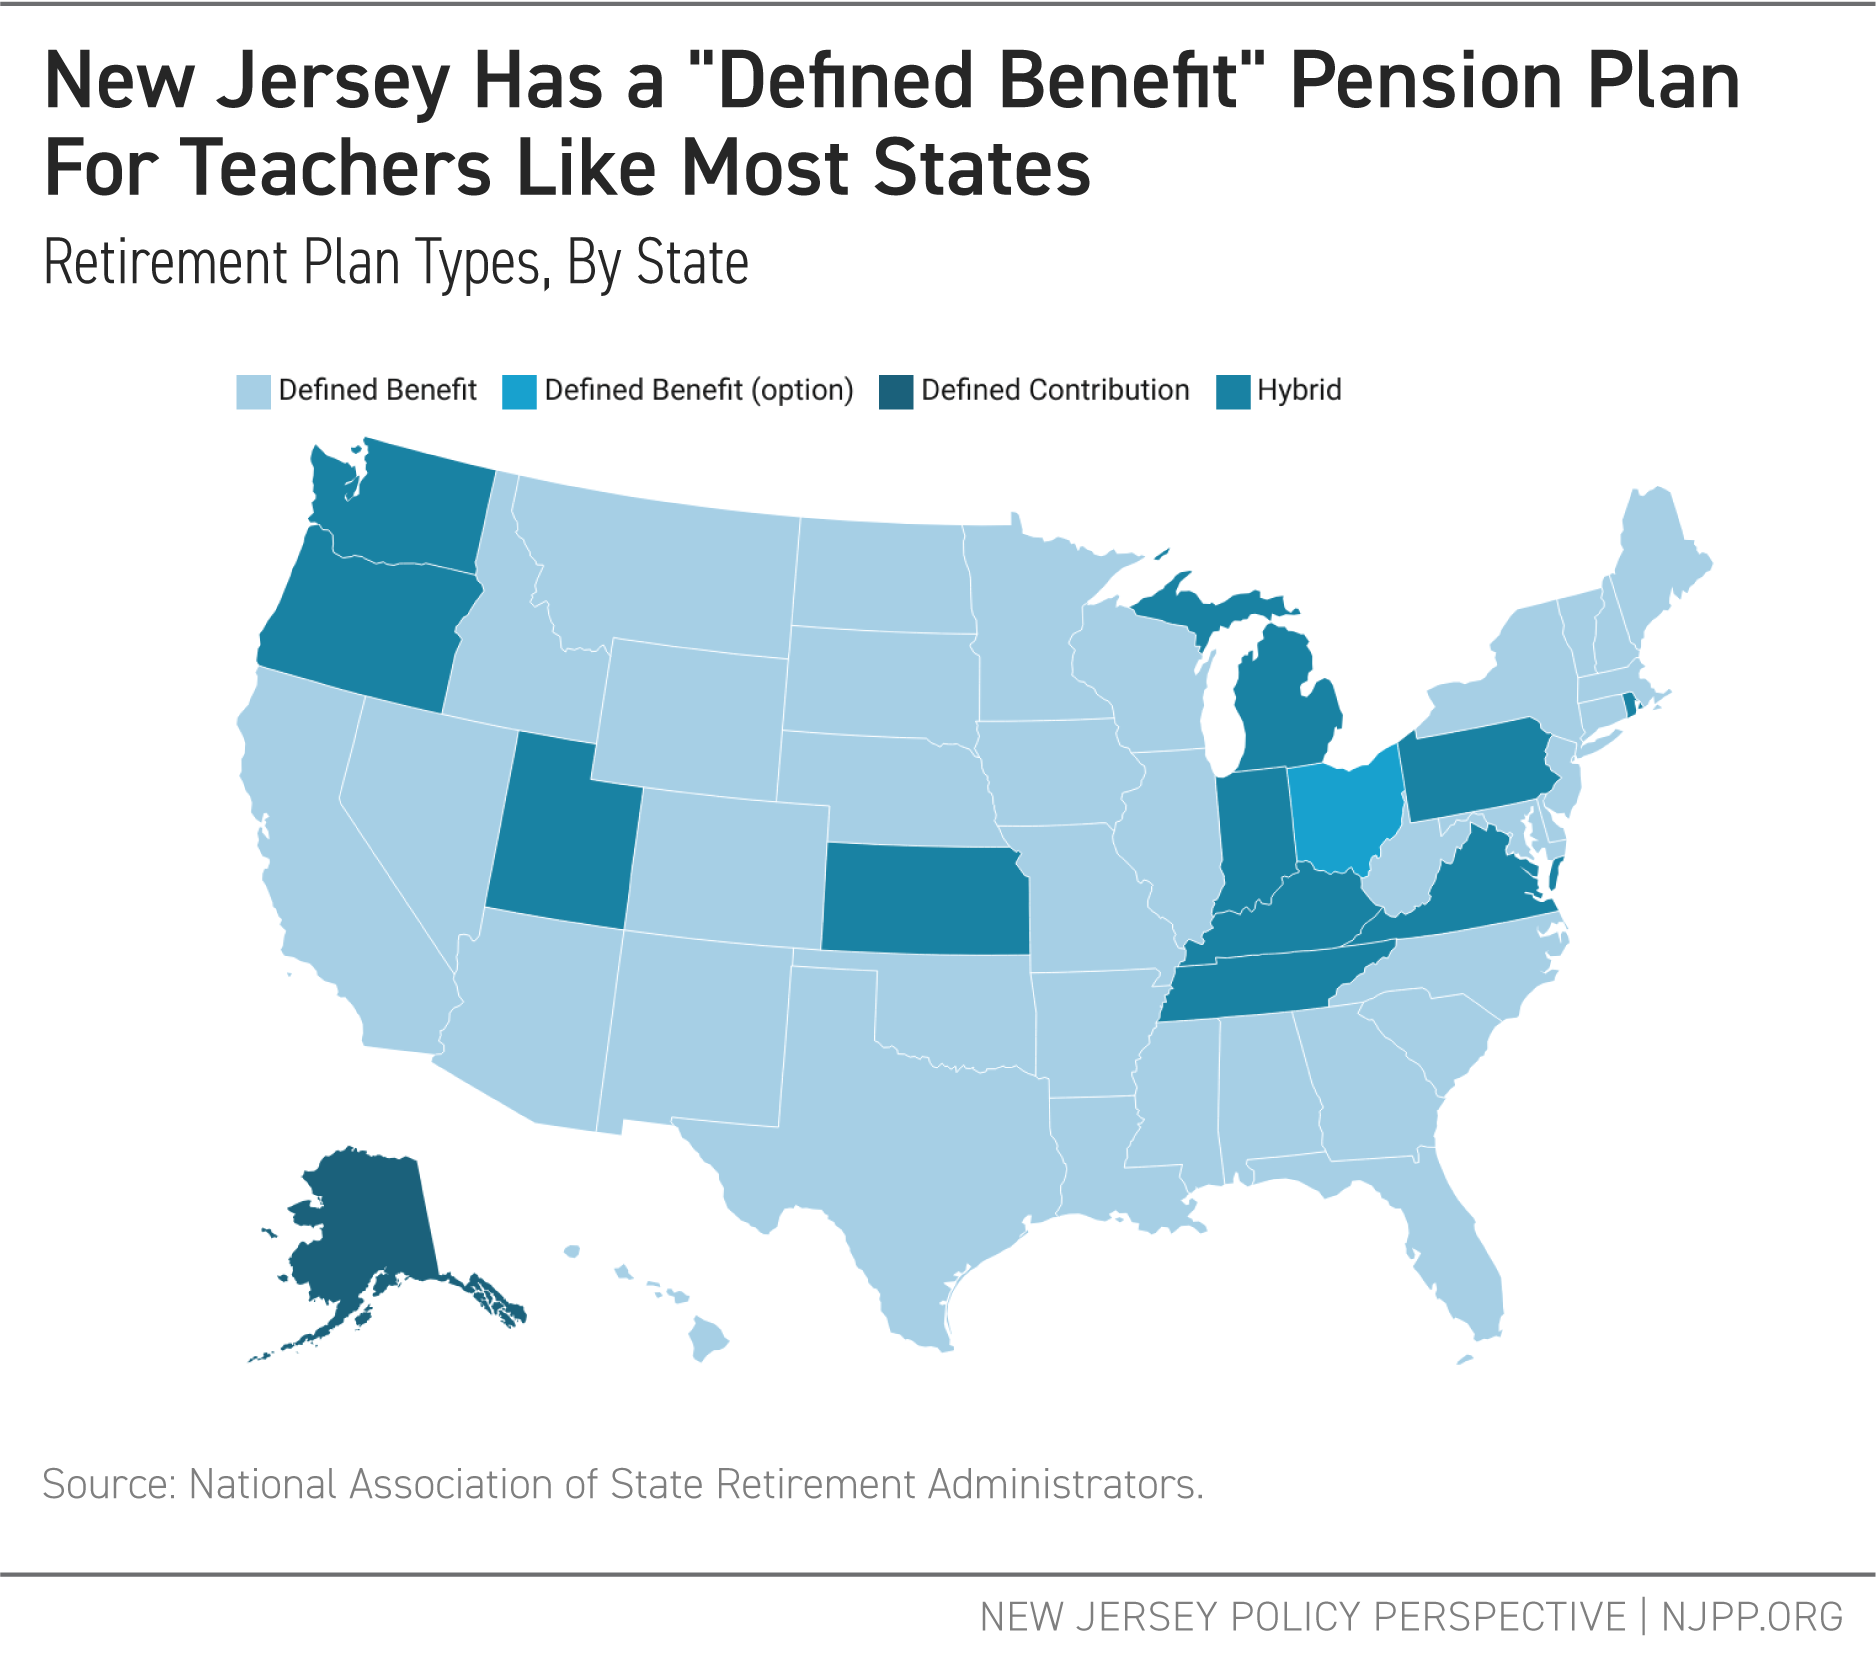
    There are three main types of teacher pensions: defined benefit, defined contribution, and hybrid (see box above). Figure 1 shows that most teacher retirement plans for recent members are defined benefit plans, although several states have moved to hybrid plans. Since defined contribution plans introduce market variables that complicate direct comparisons, this analysis focuses exclusively on the 38 states with defined benefit plans, including New Jersey.

    New Jersey Has a "Defined Benefit" Pension Plan For Teachers Like Most States

    Defined benefit plans have six major factors in common that affect their generosity:

    1. Benefit Factor: The percentage of a salary accrued annually toward the pension and the key factor of a pension’s payout (see below).
    2. Contribution Rate: The percentage of a salary that must be contributed.
    3. Average Salary Determination: The salary used to calculate benefits.
    4. Vesting Period: The number of years required before pension benefits are guaranteed.
    5. Normal Retirement Age: The earliest age at which a teacher can receive benefits without penalty.
    6. Cost of Living Allowance (COLA): The increases to the benefit to account for inflation.


    Since the benefit factor and contribution rate directly affect a teacher’s benefits, they are weighted twice as heavily as the other four factors when determining a final grade.

    Findings

    Benefit Factor

    Pension benefits follow a basic formula to determine a benefit:

    Benefit Factor x Years Employed x Average Salary Determination = Benefit[6]

    The benefit factor — sometimes called the retirement multiplier — is the percentage of an employee’s average salary they receive as a pension benefit for every year employed. For example, a teacher who works for 30 years and has a final average salary of $100,000 would receive a pension plan of $30,000 with a benefit factor of 1.0:

    1.0 (benefit factor, divided by 100) x 30 (years) x $100,000 (salary) = $30,000

    With a benefit factor of 2.0, their pension benefit would double:

    2.0 (benefit factor, divided by 100) x 30 (years) x $100,000 (salary) = $60,000

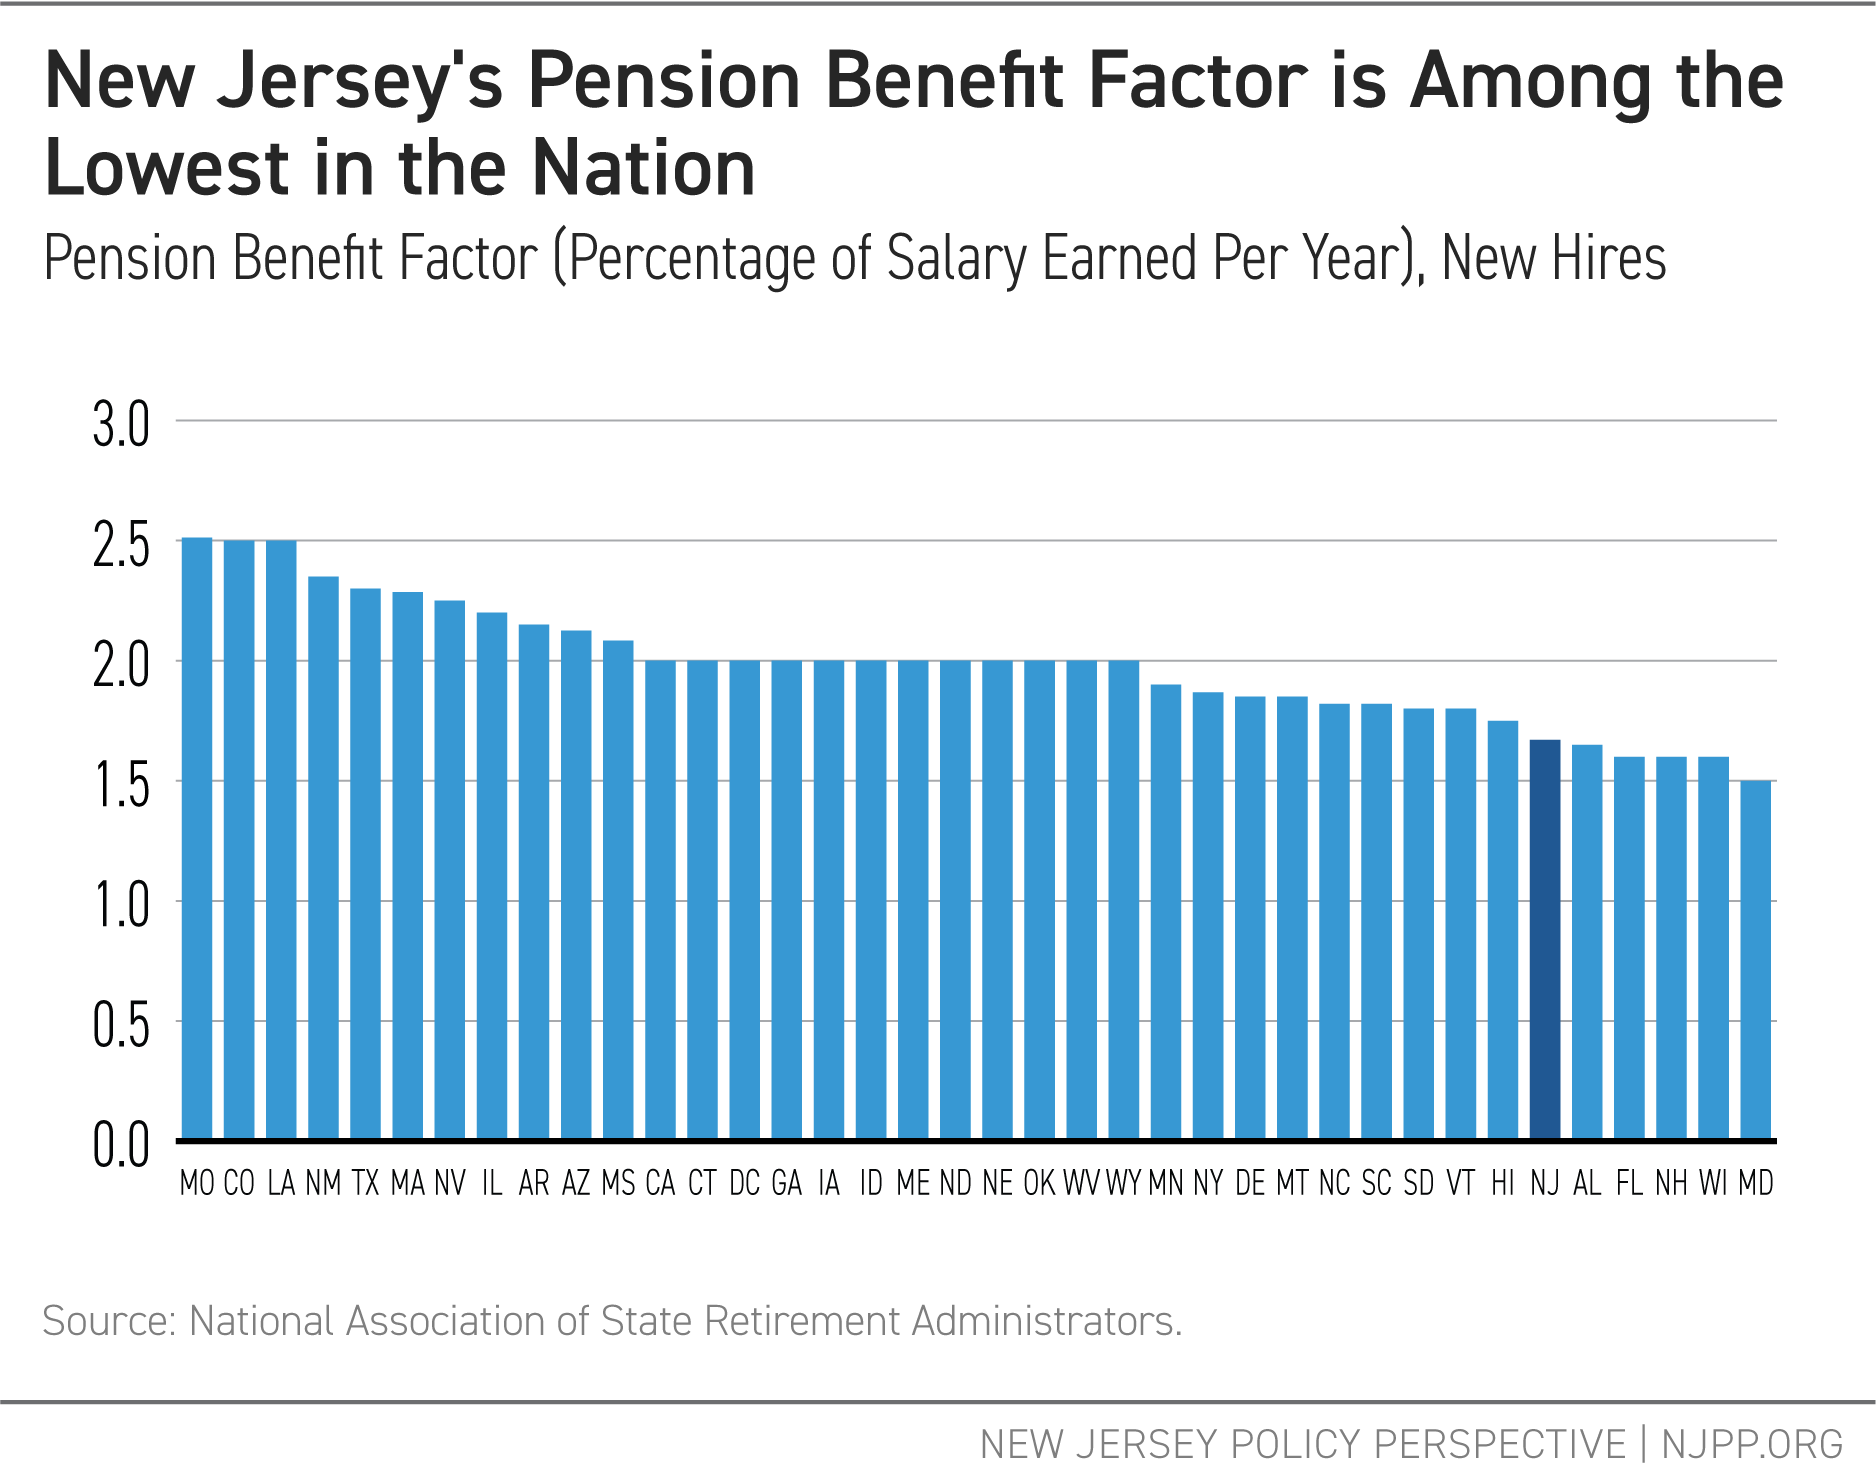
    A higher benefit factor means a larger pension benefit. Relative to other states, New Jersey’s benefit factor for new teachers is quite small — ranking sixth lowest among the 38 states with a 1.67 benefit factor.[7]

    New Jersey's Pension Benefit Factor is Among the Lowest in the Nation

    Contribution Rate

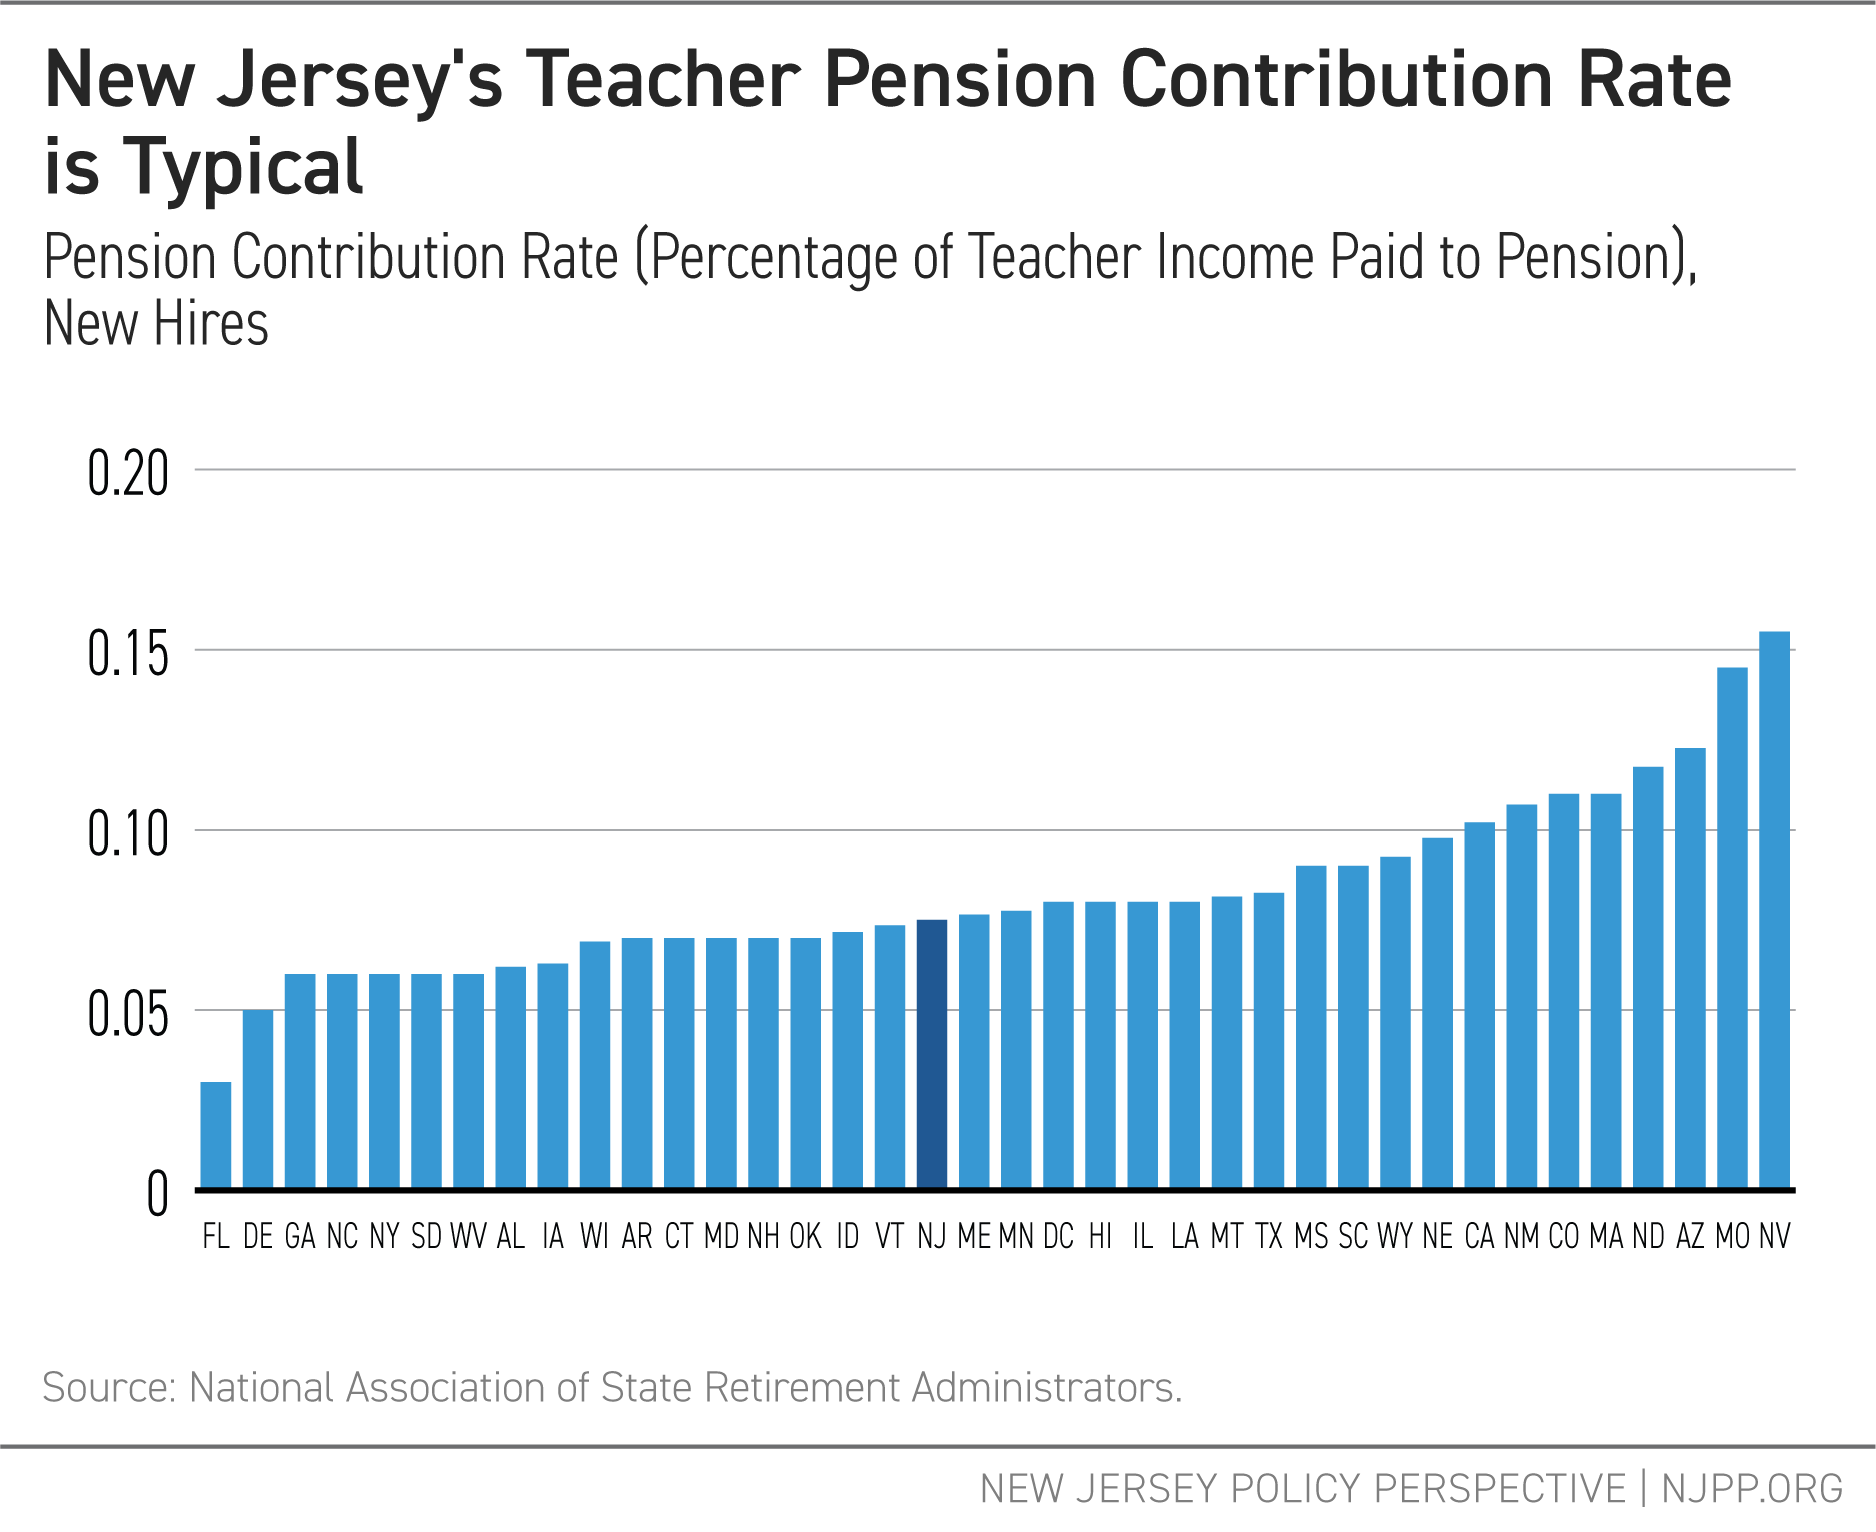
    Teachers’ pensions have two funding sources: employer contributions from state or local revenues and employee contributions from teachers’ paychecks. Higher contribution rates mean that teachers pay more for their pensions. At 7.5 percent, New Jersey’s contribution rate ranks in the middle at 18th out of 38.

    New Jersey's Teacher Pension Contribution Rate is Typical

    Average Salary Determination

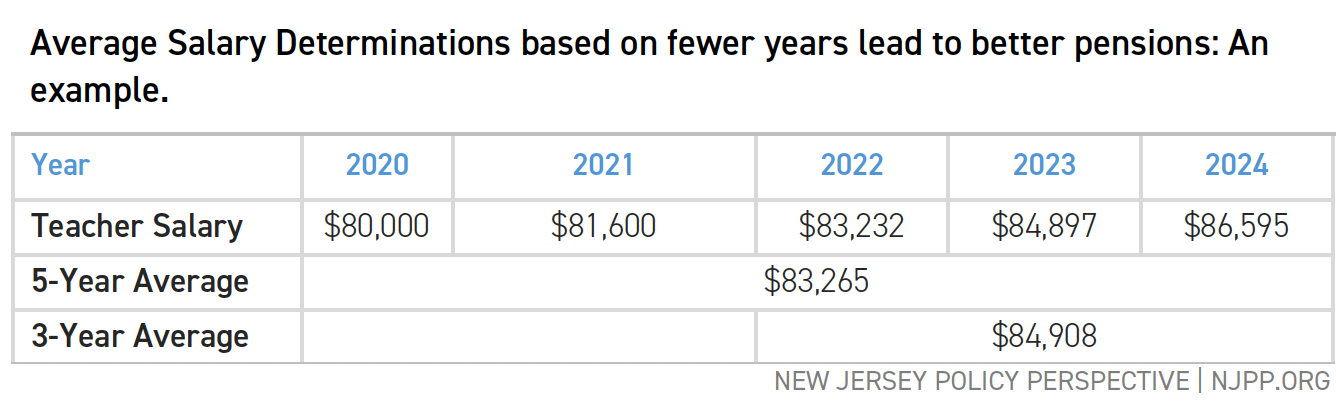
    Pension benefits are calculated as a percentage of a teacher’s average salary. The average is based on some number of years when the teacher’s salary was highest. Because most teachers earn more at the end of their careers, and because their salary goes up each year, an average salary determination based on fewer years leads to a higher benefit than a salary based on more years.

    As an example: A teacher in 2020 makes $80,000, and her salary increases by 2 percent each year. The average of her last five years is $83,265; however, the average of her last three years is $84,908. A pension based on a three-year average is, therefore, larger than a pension based on a five-year average. In other words, more generous pensions have average salary determinations based on smaller numbers of years.

    Average Salary Determinations based on fewers years lead to better pensions: An example.

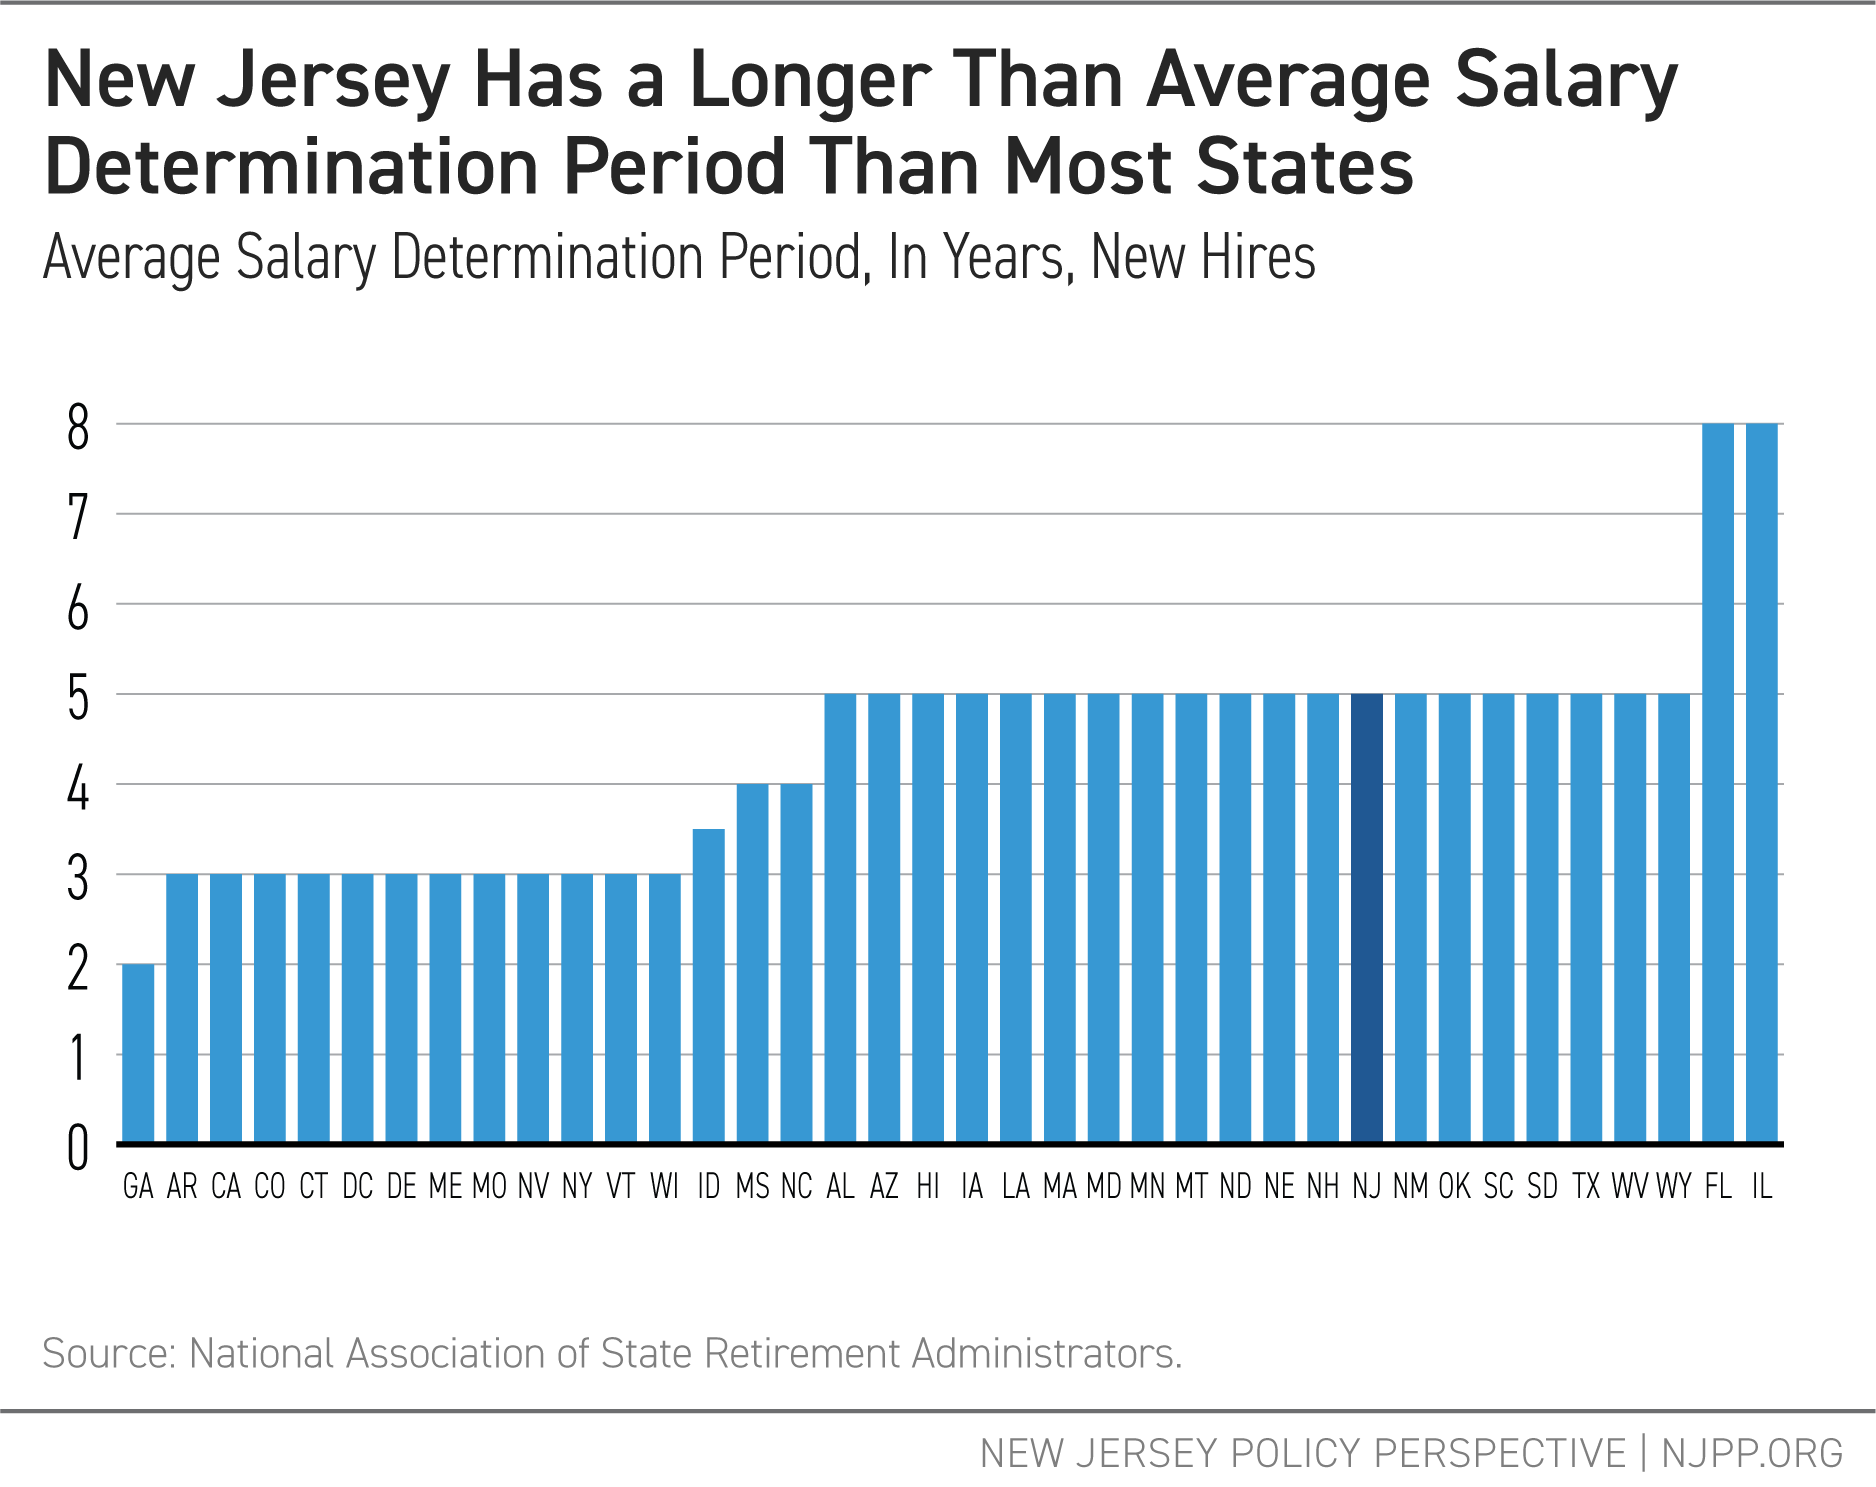
    Currently, New Jersey uses five years to determine the average salary, which puts our state tied with 20 other states in terms of average salary determination. Fifteen states use a lower number of years, and two use a higher number of years.

    New Jersey Has a Longer Than Average Salary Determination Period Than Most States

    Vesting Period

    The vesting period is the length of time a member must work before being guaranteed a pension benefit. New Jersey, like eight other states, requires ten years of service to become vested.

    New Jersey's Teachers Take the Longest to Vest in Their Pension Than Other States

    Normal Retirement Age

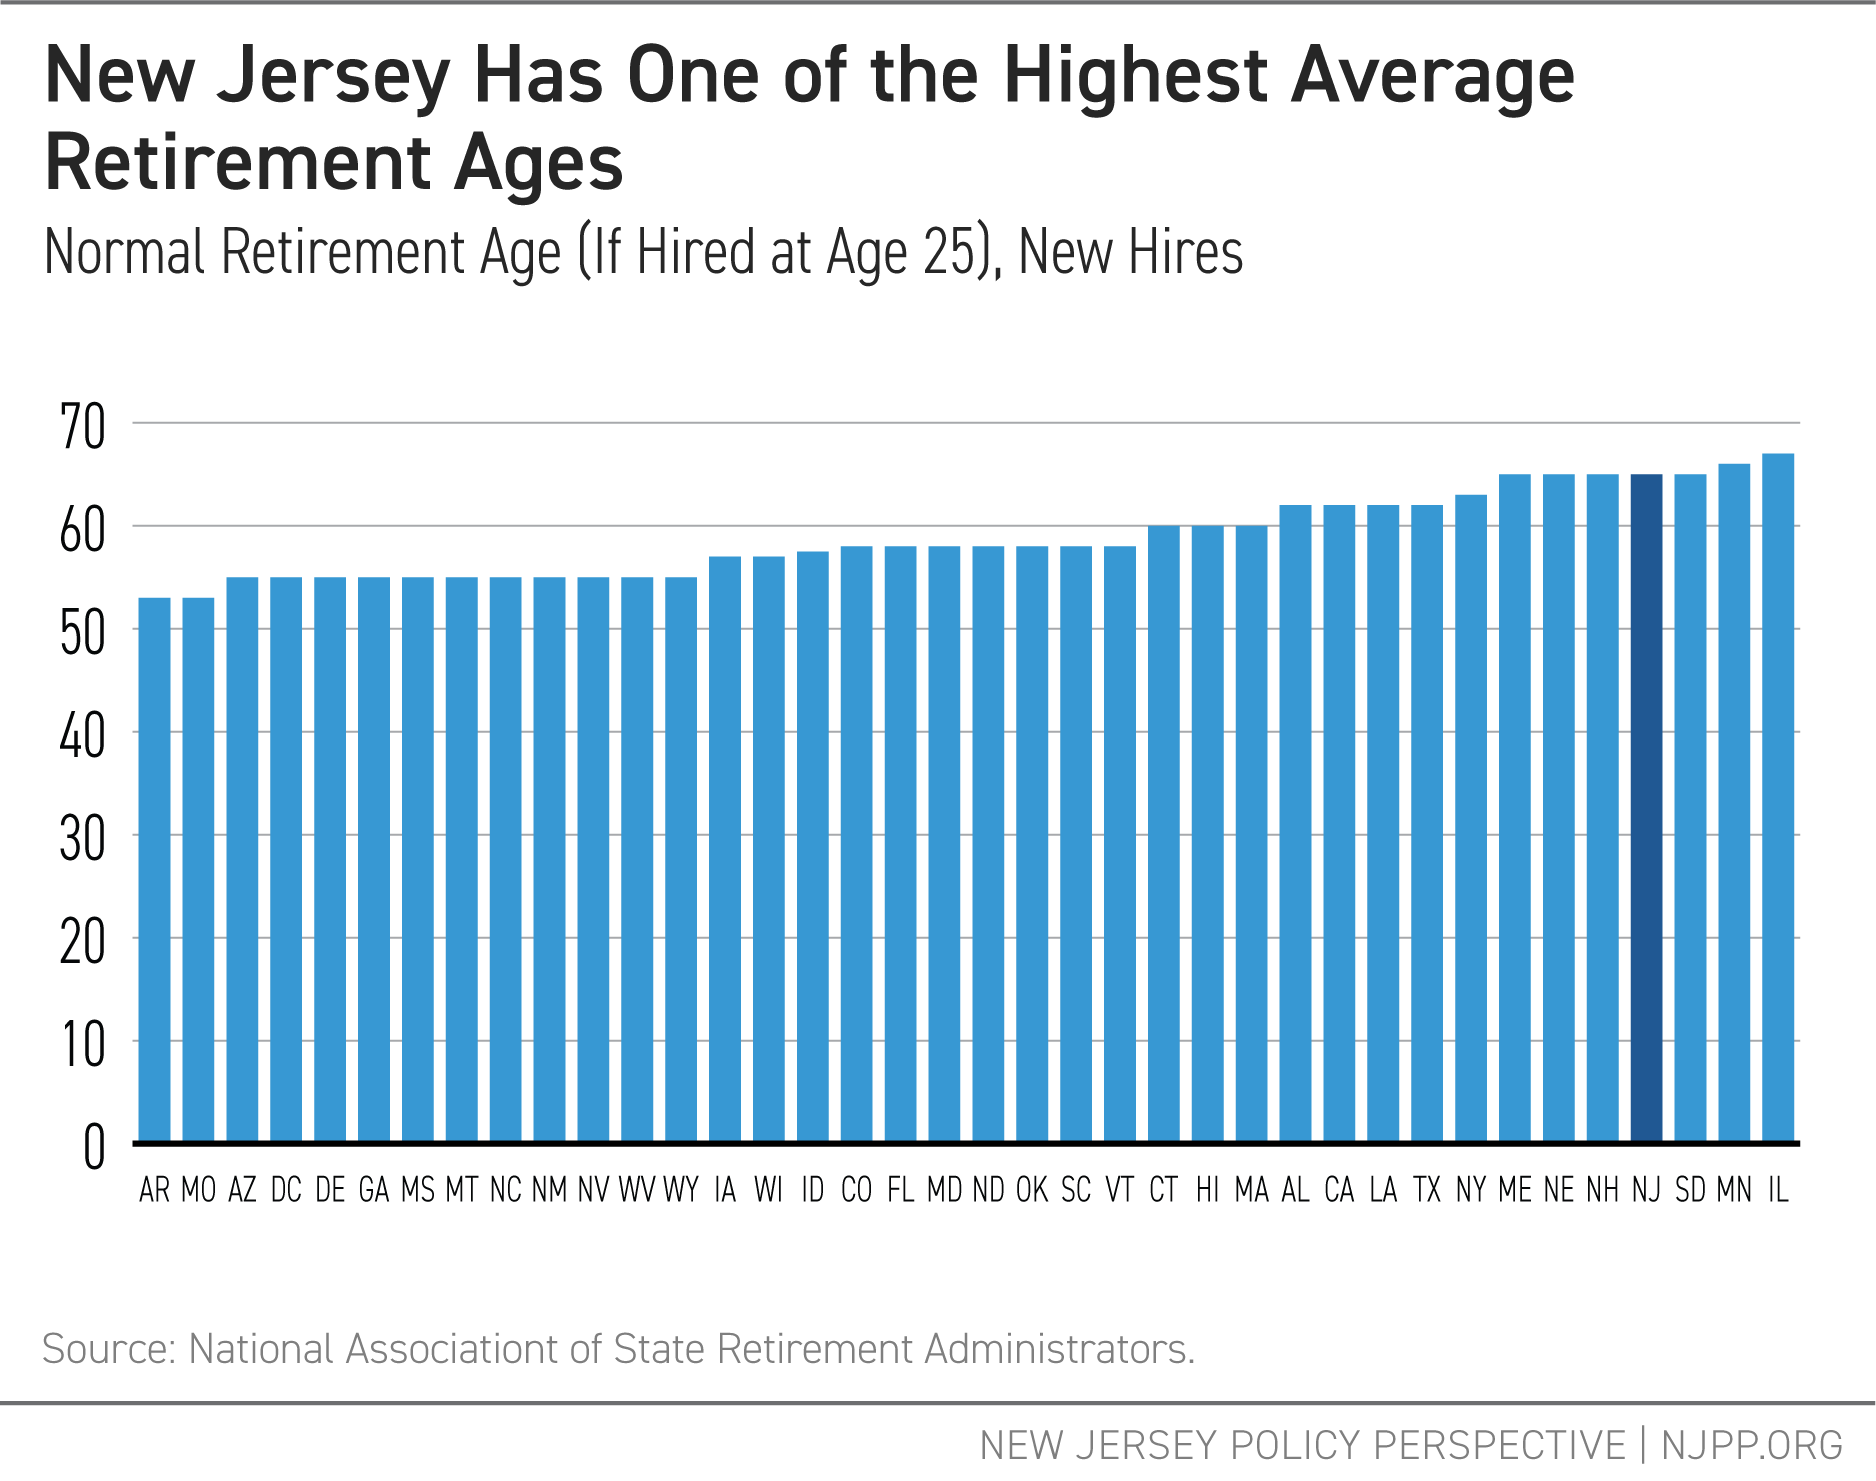
    While pension systems can offer options for early retirement, there is usually a penalty for doing so. Normal retirement age is when a member can receive their full pension benefit. While some states have simple age and work years requirements, others use more complex formulas that change the normal retirement age based on when a member started work. For simplicity’s sake, this report gives the normal retirement age for each state, assuming that a teacher entered the state’s retirement plan at age 25.

    In this report’s sample of 38 states, the normal retirement age for new teachers ranges from 53 to 67. At 65, novice teachers in New Jersey have one of the highest normal retirement ages in the country.

    New Jersey Has One of the Highest Average Retirement Ages

    Cost of Living Allowance

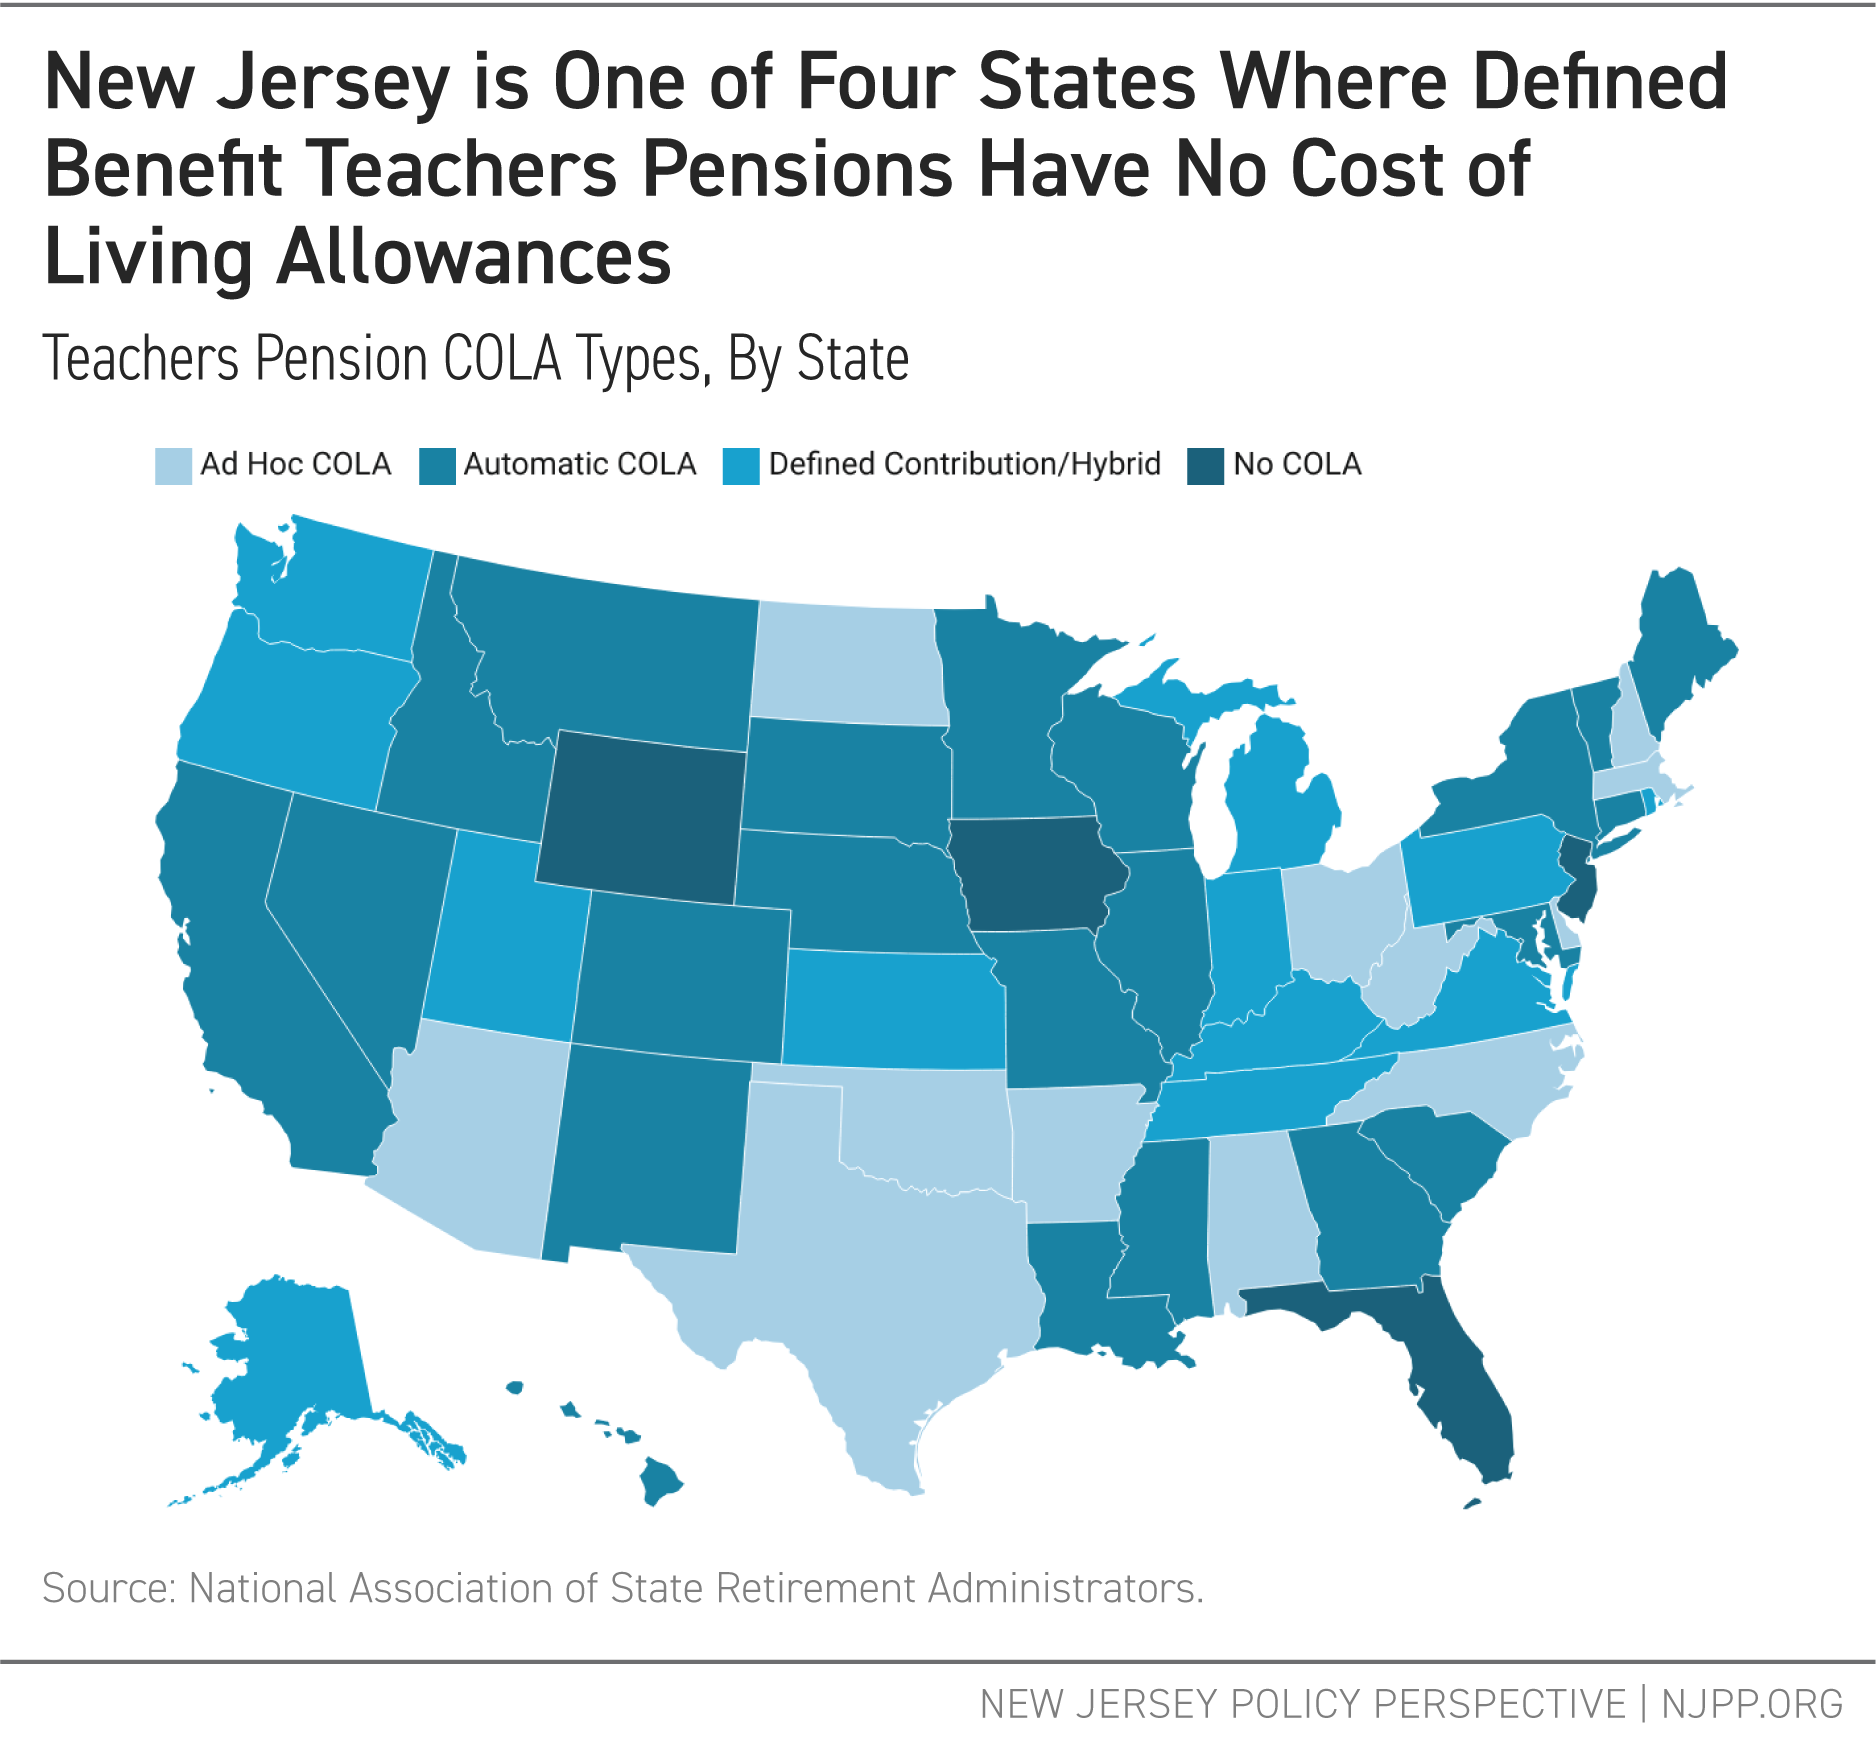
    Most states offer some increase in benefits for retirees to offset the effects of inflation. The terms of these cost-of-living allowances (COLAs) vary widely. To simplify things, this report examined two factors: 1) whether or not there is a COLA and 2) whether the COLA is automatic or “ad hoc,” meaning it is only granted when some governing body allows it. New Jersey is only one of four states that has no COLA.

    New Jersey is One of Four States Where Defined Benefit Teachers Pensions Have No Cost of Living Allowances

    Overall Grade

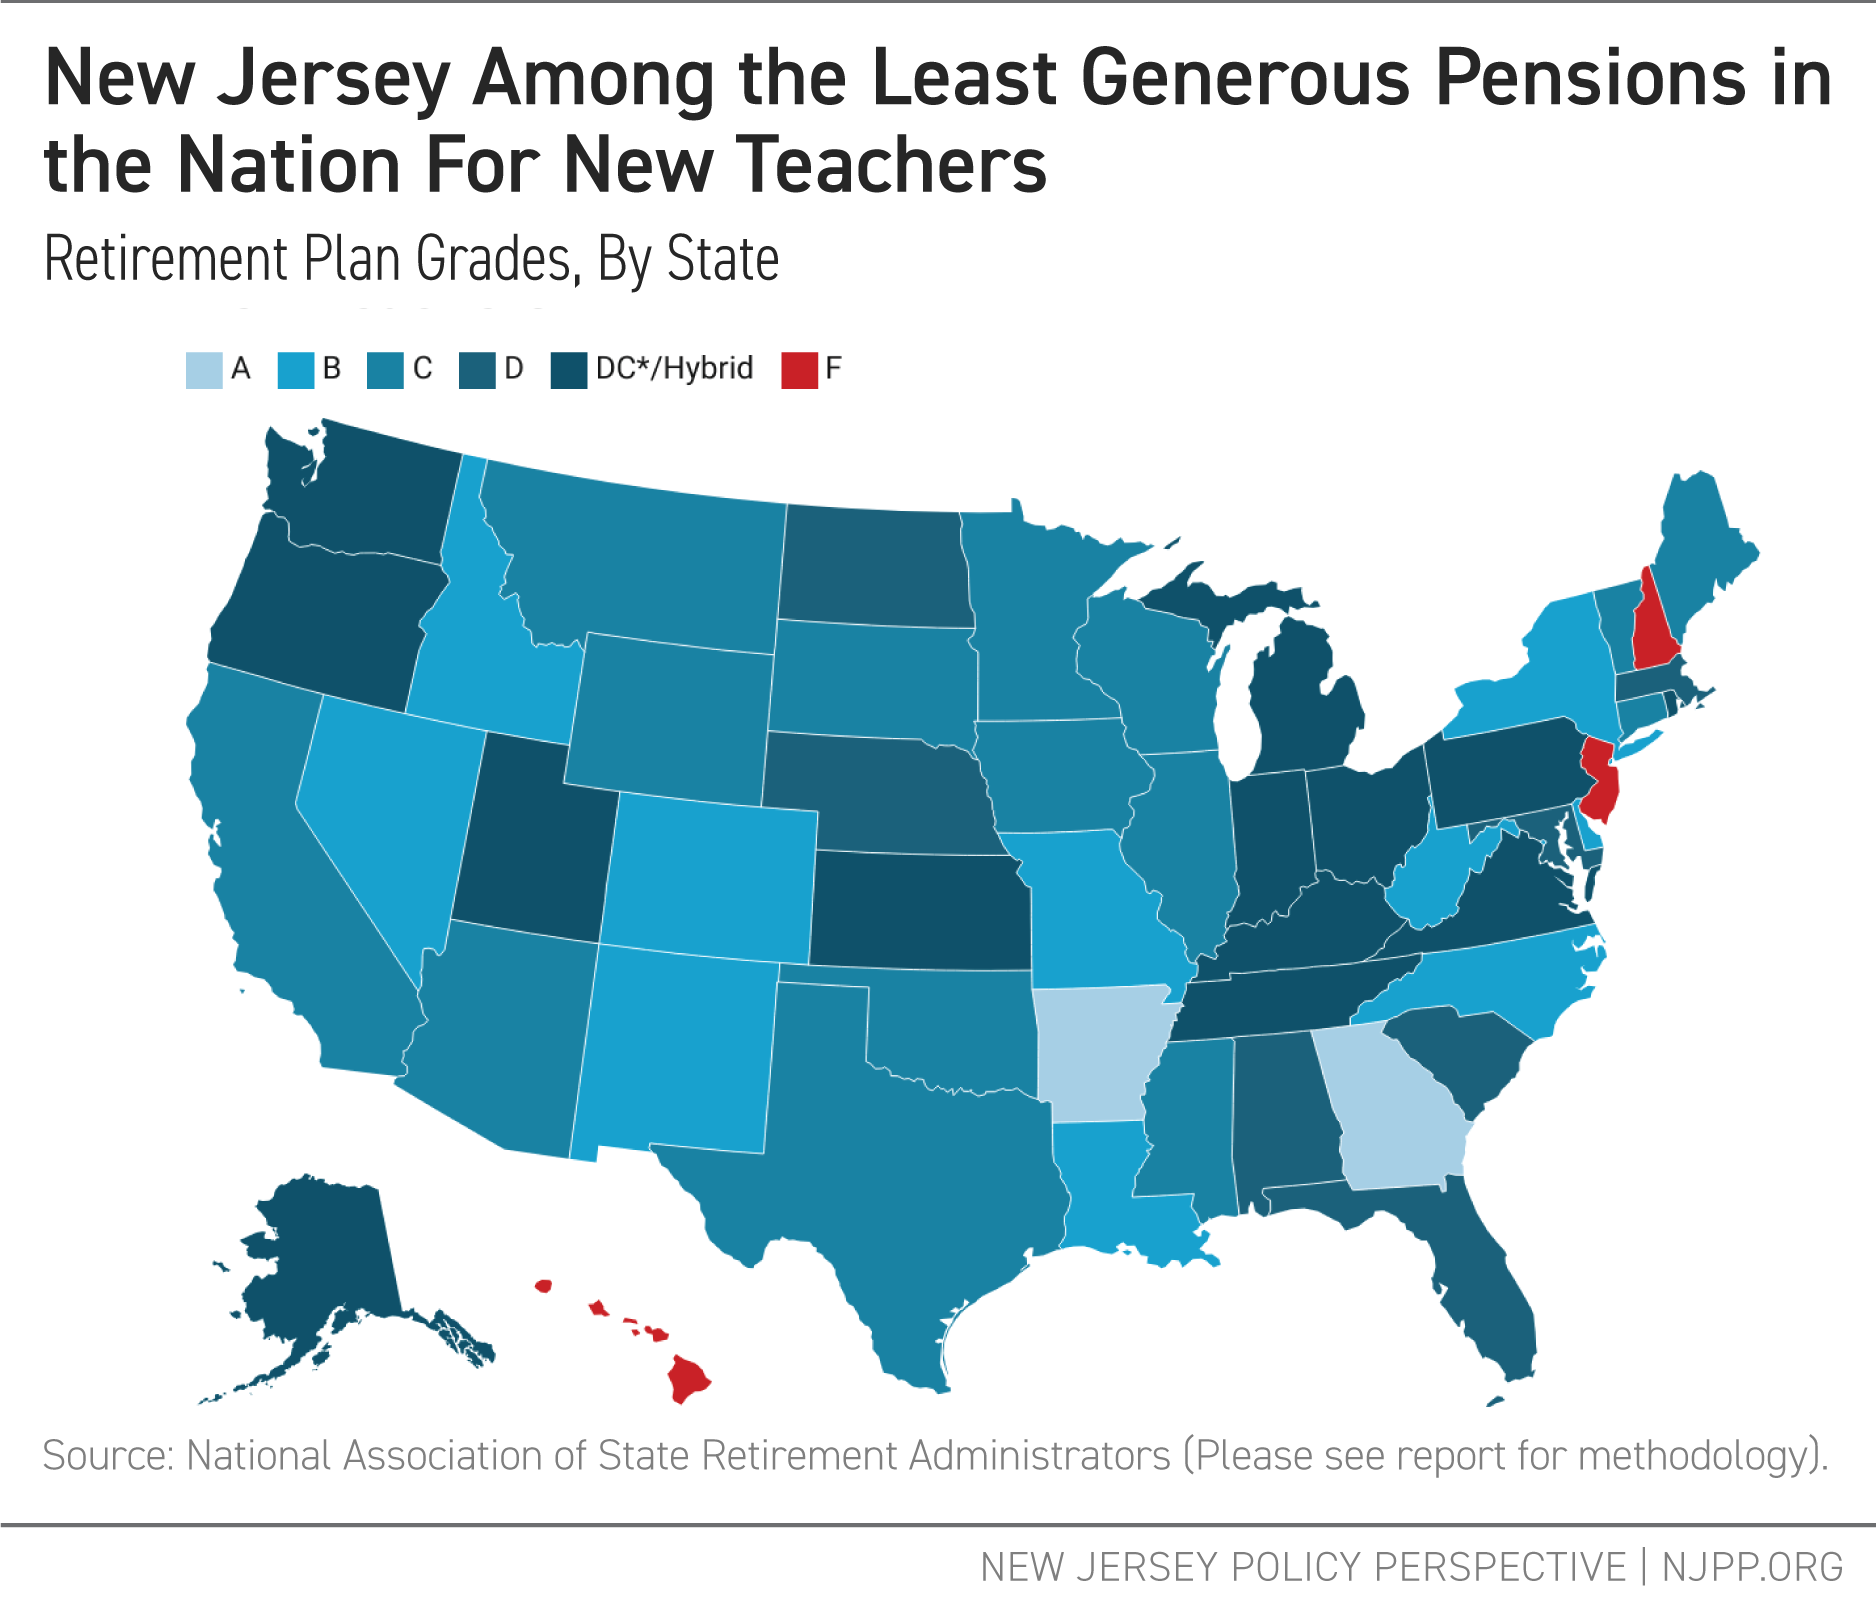
    New Jersey Among the Least Generous Pensions in the Nation For New Teachers

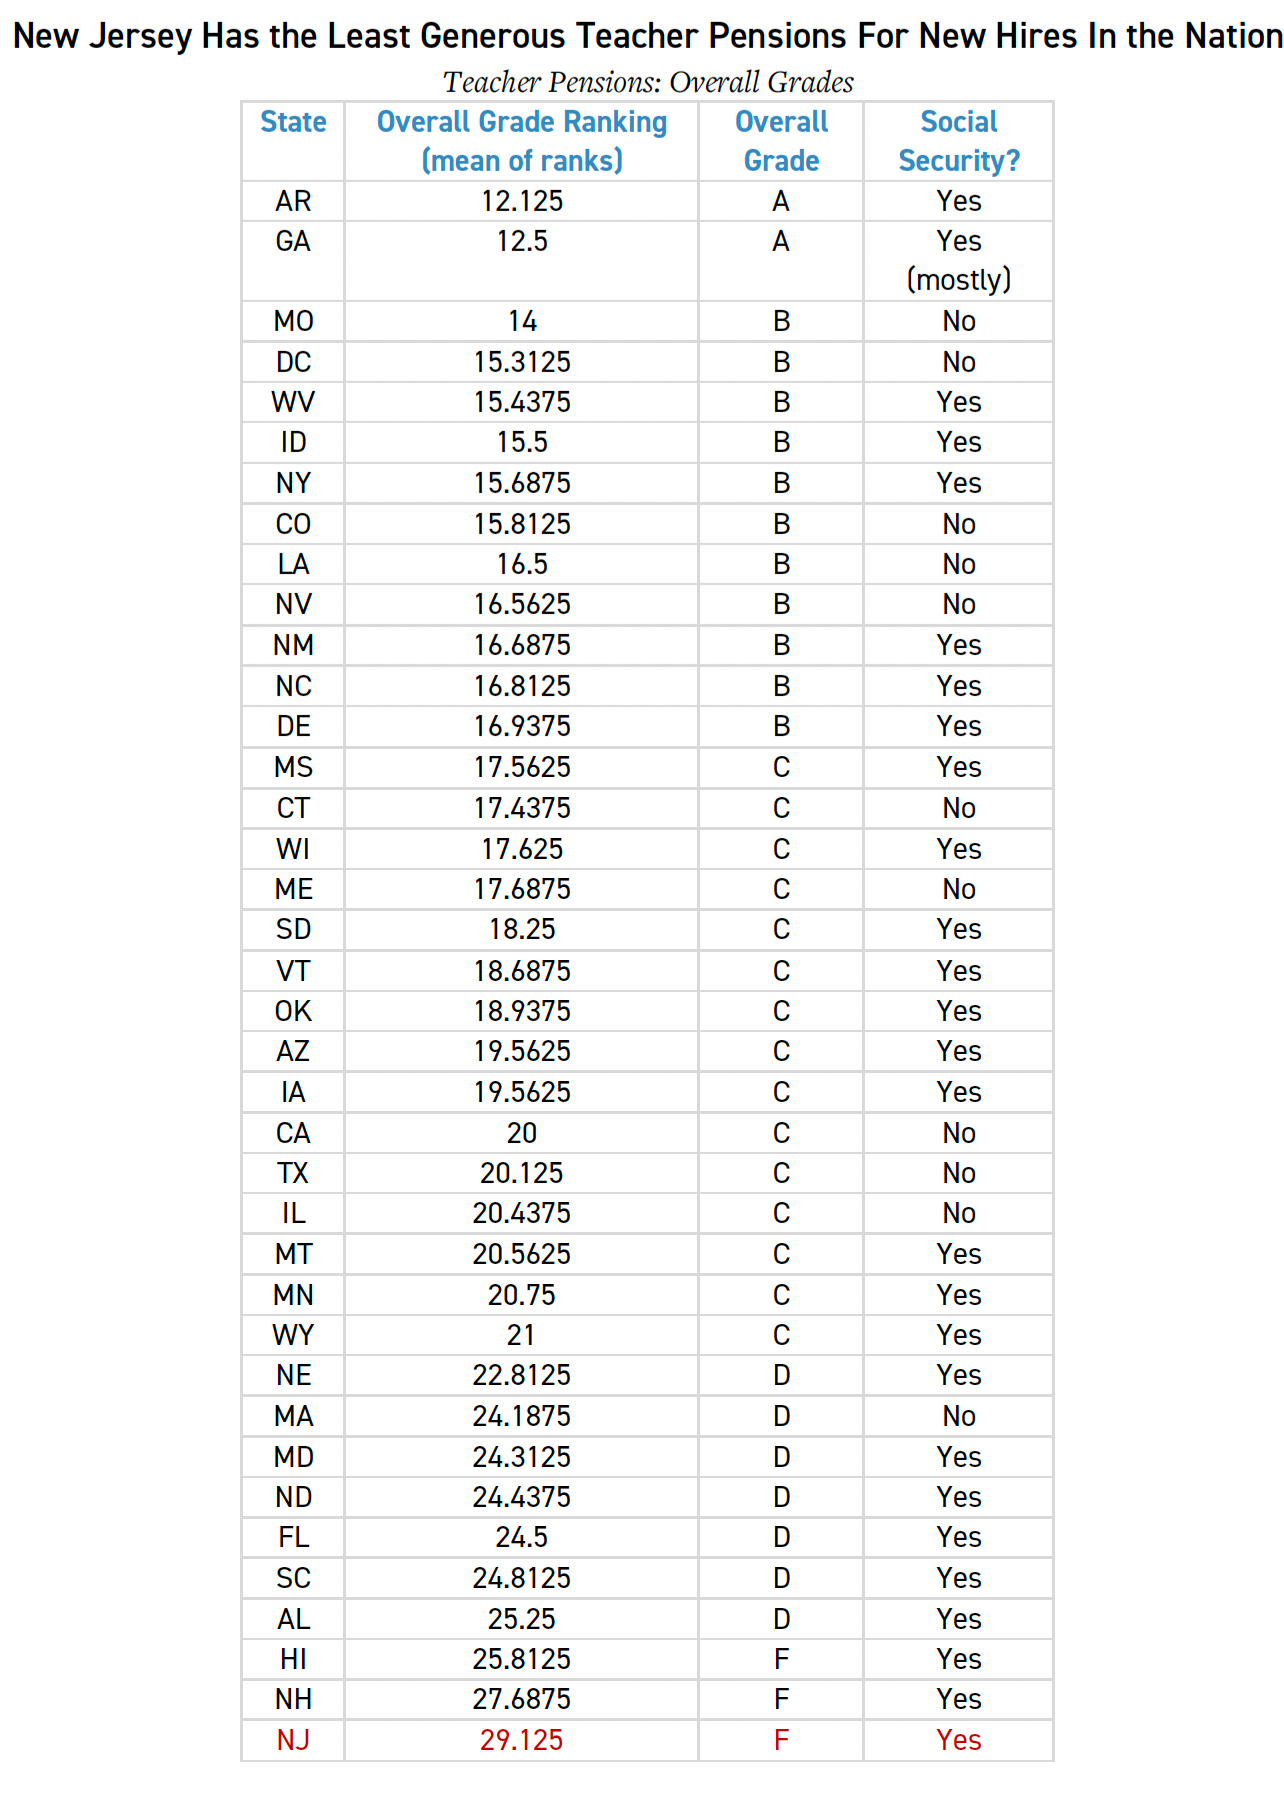
    Compared to states with similar retirement plans, New Jersey has the least generous pensions for new teachers in the nation, earning an overall grade of “F.” The state’s low benefit factor, lengthy vesting period, high normal retirement age, lack of a COLA, and high average salary determination period all combine to make New Jersey’s pension for new teachers the stingiest in the nation. See Appendix for more information on the methodology for scoring and letter grades.

    In some states, Social Security benefits are not available to teachers; in these cases, teachers do not pay FICA taxes, which is a U.S. federal payroll tax. While the overall grade in this report is not affected by a state’s Social Security status, the information is included in the Appendix. Even if all states that did not participate in Social Security for teachers were excluded from this analysis, New Jersey would still rank last in pension generosity. The role of Social Security in teacher retirement is discussed further in the Supplement.

    Recommendations and Conclusion

    In 2016, then-Governor Chris Christie claimed that New Jersey teachers had “gold-plated pensions.”[8] However, as NJPP pointed out in 2017,[9] that was simply not true when compared to other states. Teachers’ pensions in New Jersey were some of the least generous in the nation.

    Today, new teachers in New Jersey’s pension system continue to face significant disadvantages. They suffer from a low benefit factor, a mediocre contribution rate, a high salary determination and retirement age, and no COLA. By any standard, New Jersey’s newest teachers get a worse deal on their retirement benefits than their colleagues in other states. This inequity is particularly concerning considering that three-quarters of teachers in the state are women — further exacerbating the gender pay gap.[10] A fair pension system is not just about financial security in retirement; it is about recognizing and respecting educators for their service.

    To fix this, policymakers must act now to restore fairness in New Jersey’s teacher pension system. The most effective solution is to eliminate Tier 5 and extend more equitable benefits to all teachers. This change would bring New Jersey’s pension system closer to national standards, making the profession more attractive to new educators while ensuring that long-serving teachers can retire with dignity. However, simply eliminating Tier 5 and transitioning all teachers to Tier 1 would not fully align New Jersey with more generous pension systems in other states. While it would mark significant progress, many states would still provide more generous benefits than New Jersey. (See supplement for methodology.)

    Governor Murphy’s administration has helped New Jersey make great strides toward meeting its long overdue pension obligations.[11] But if the state wants to recruit and retain well-educated workers into its schools, it must stop using the excuse of previous underfunding to justify inadequate teacher pension benefits. Eliminating Tier 5 is a reasonable step toward pension fairness for the people who educate our children and shape New Jersey’s future.

    Appendix: Data and Methods

    Data

    Data for this report come from the National Association of State Retirement Administrators (NASRA), the foremost authority on public pensions. Data were extracted from these documents:


    As a data check, NASRA’s data was compared to a report recently issued by the Wisconsin Legislative Council in 2024.[12] When the two data sources conflicted, the author went to the state in question’s website and used the information provided.

    Methodology

    The sample used is restricted to states with defined benefit retirement plans for teachers. States were ranked in all six metrics (ties were ranked at the mean of the states’ ranks). The final score is the average (mean) of the ranks, with the benefit factor and contribution rate ranks weighted twice as much as the others.

    New Jersey Has the Least Generous Teacher Pensions for New hires in the Nation

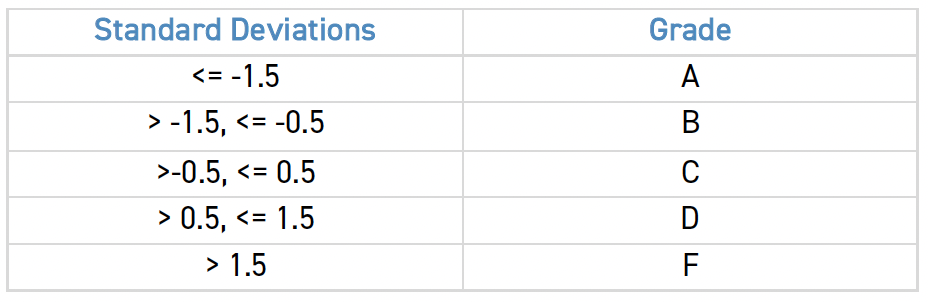
    For the letter grades, the author converted the rank means into standard deviations and assigned grades based on this distribution.

    Standard deviations table

    Supplement: Modeling Pension Generosity

    While retirement age, COLAs, vesting periods, and average salary determination are important measures of a pension’s generosity, arguably the two most important factors are the benefit factor and the contribution rate. The first directly affects the value of the pension benefit, and the second determines how much an employee pays to get that benefit.

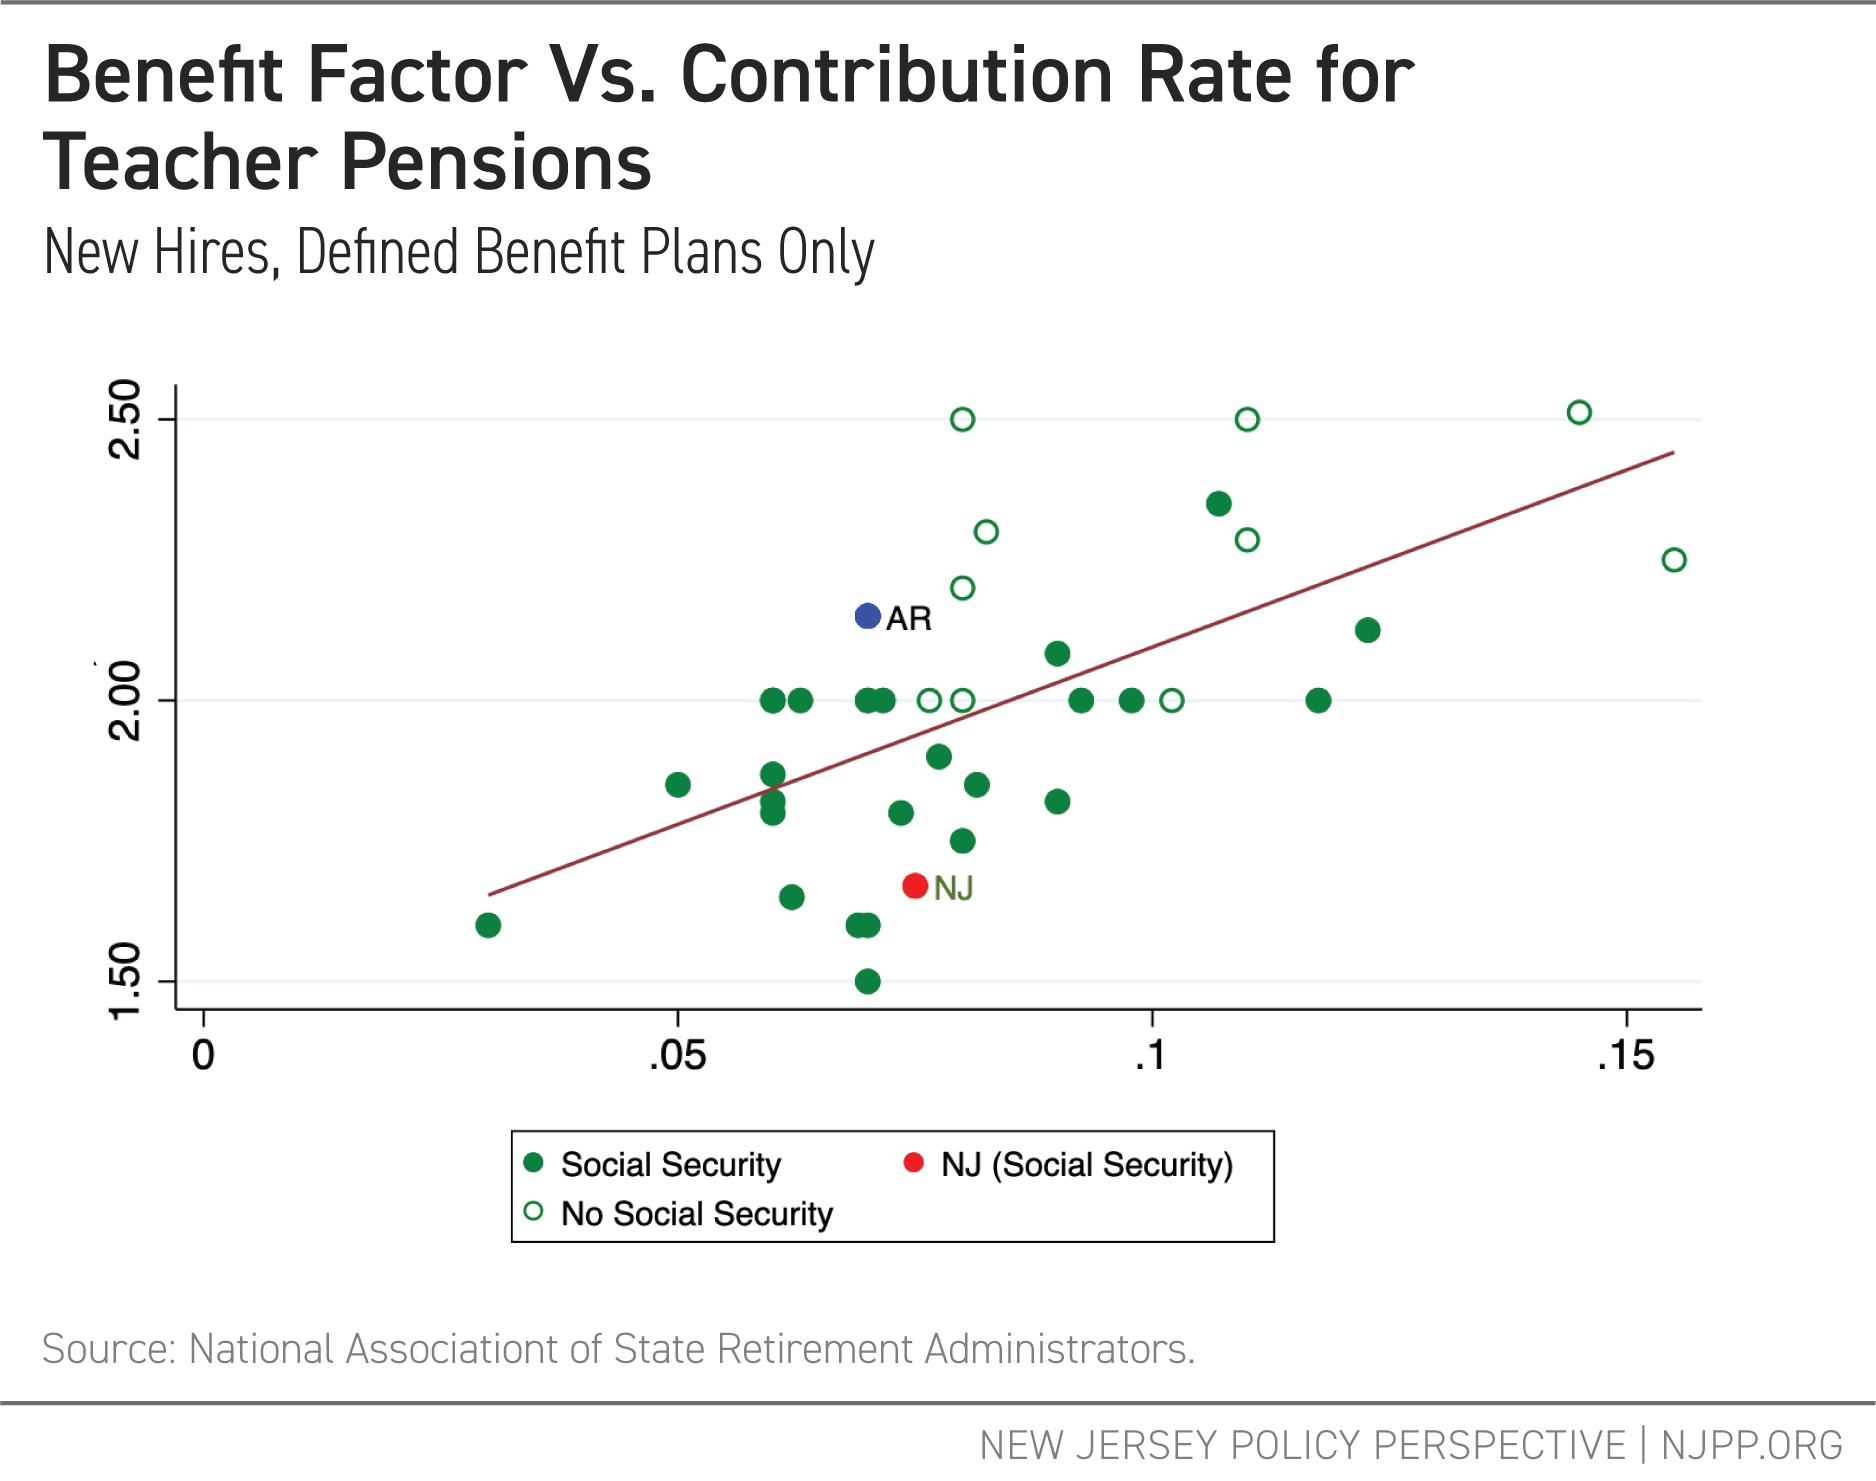
    Logically, members would expect that the more they pay into a pension, the more they would get out of it. In other words, states with higher contribution rates should have, on average, higher benefit factors. The figure below shows a significant correlation (r-sq = 0.38) between the benefit factor and contribution rate.

    But the correlation is hardly perfect. Some states have higher benefit factors than their contribution rates would predict, and some have lower. New Jersey, for example, has a slightly higher contribution rate (7.5%) than Arkansas (7.0%). However, Arkansas’s benefit factor (2.15) is much higher than New Jersey’s (1.67). Arkansas teachers enjoy a more generous pension multiplier than New Jersey teachers, even though they contribute a smaller portion of their income.

    The amount that the benefit factor is above or below what the contribution rate predicts is the “value-added” of that state’s pension: the amount more or less than predicted, based on other states’ pensions, that a member receives in benefits based on what they contributed. Teachers in states with a higher value-added amount enjoy more generous pensions as evaluated by these two critical factors; teachers in lower value-added states have less generous pensions.

    Benefit Factor Vs. Contribution Rate for Teacher Pensions

    The figure above also shows that states that do not offer Social Security benefits for their teachers (the green markers) tend to have higher value-added amounts. They sit higher above the trendline, which is the model’s prediction of the benefit factor given the contribution rate. To put it more simply, states do not have to pay the employer’s share of Social Security taxes on behalf of their teachers and may use those funds to increase the benefit factor.

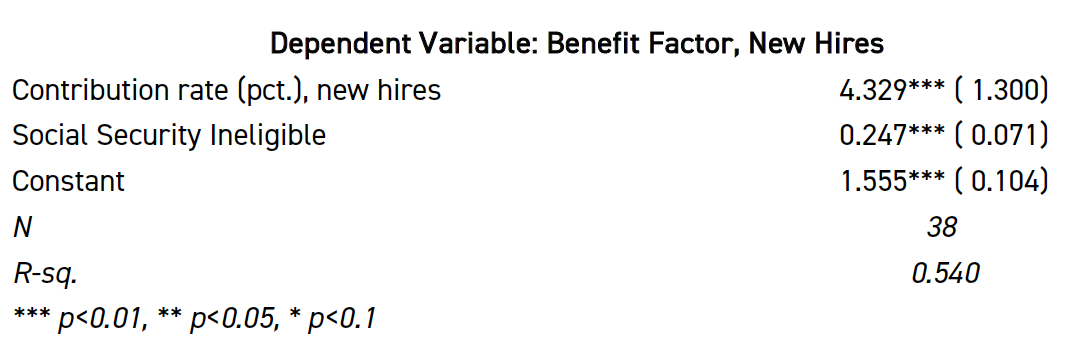
    To account for this, the author runs a regression model with Social Security as a factor variable. The estimates are below; the model allows us to calculate the predicted benefit factor for each state and compare it to the actual benefit factor (resulting in the residual).

    Dependent Variable: Benefit Factor, New Hires

    Using this model, New Jersey’s predicted benefit factor is 1.88. Its actual benefit factor for Tier 5, as discussed above, is 1.67, and its benefit factor for Tier 1 is 1.82. While the Tier 1 benefit factor is still below the prediction, it is much closer than Tier 5. Raising the Tier 5 benefit factor to Tier 1’s would go a long way toward making New Jersey’s pension benefits for new teachers more like those in other states.

    Disclosure

    Mark Weber is the Special Analyst for Education Policy at the New Jersey Policy Perspective, and a Lecturer in education policy and law at Rutgers University, New Brunswick. Weber is also a teacher in the Warren Township Schools, Somerset Country; as such, he is a member of the New Jersey Teachers’ Pension and Annuity Fund (TPAF). Weber is in Tier 1; the recommendations in this report would not affect his retirement benefits.


    End Notes

    [1] Nikita Biryukov (September 3, 2024). “New Jersey districts still face teacher shortages as new school year begins.” New Jersey Monitor. https://newjerseymonitor.com/2024/09/03/new-jersey-districts-still-face-teacher-shortages-as-new-school-year-begins/

    [2] Weber, M. (2022). New Jersey’s Teacher Pipeline: The Decline in Teacher Candidates Continues. https://www.njpp.org/publications/report/new-jerseys-teacher-pipeline-the-decline-in-teacher-candidates-continues/

    [3] Allegretto, S. (September 12, 2024). Teacher pay rises in 2023—but not enough to shrink pay gap with other college graduates. Economic Policy Institute. https://www.epi.org/publication/teacher-pay-in-2023/
    Weber, M. (September, 2019). In Brief: New Jersey’s Teacher Workforce, 2019; Diversity Lags, Wage Gap Persists. New Jersey Policy Perspective. https://www.njpp.org/wp-content/uploads/2019/09/NJPP-In-Brief-Teacher-Workforce-Report-Final.pdf

    Kemper Patrick, S. & Carver-Thomas, D. (2022). Teacher Salaries: A Key Factor in Recruitment and Retention.  Learning Policy Institute. https://learningpolicyinstitute.org/blog/teacher-salaries-key-factor-recruitment-and-retention

    Steiner, E., Woo, A., Doan, S. (November 20, 2024). Larger Pay Increases and Adequate Benefits Could Improve Teacher Retention. RAND Corporation. https://www.rand.org/pubs/research_reports/RRA1108-13.html

    [4] New Jersey Treasury. “Pension and Health Benefits Reform Under Chapter 78, P.L. 2011.” https://www.nj.gov/treasury/pensions/reform-2011.shtml

    [5] Herzenberg, S. and White, J. (December 13, 2017). New Jersey Public Pensions Rank Among Least Generous in the Nation. New Jersey Policy Perspective. http://www.njpp.org/wp-content/uploads/2017/12/NJ-Pension-Brief-12-13-17-Final.pdf

    [6] National Association of State Retirement Administrators. “Defined Benefit.” https://www.nasra.org/db

    [7] In some states, benefit factors are based on variables such as years of service and age of retirement. To standardize these figures for comparison, we use the benefit factor for a teacher who begins work at age 25 and retires at the state’s “normal” retirement age. We also elect not to use the NASRA’s reported benefit factor for Massachusetts, which does not align with figures reported by the state; instead, we assume a retirement at 60 and a start age of 25 (see: https://mtrs.state.ma.us/members/#retiring-from-mtrs). We also use the “RetirementPlus” formula, as new members are automatically enrolled (see: https://mtrs.state.ma.us/wp-content/uploads/2018/03/retirementpercentagechart-tier2.pdf)

    [8] Star-Ledger Editorial Board (January 17, 2016). “Stop demonizing teachers, governor; Editorial.” The Star-Ledger. https://www.nj.com/opinion/2016/01/christie_has_no_right_to_demonize_teachers_editori.html

    [9] Herzenberg, S. and White, J. (December 13, 2017). New Jersey Public Pensions Rank Among Least Generous in the Nation. New Jersey Policy Perspective. http://www.njpp.org/wp-content/uploads/2017/12/NJ-Pension-Brief-12-13-17-Final.pdf

    [10] Gould, E. (March 8, 2024) Gender wage gap persists in 2023; Women are paid roughly 22% less than men on average. Economic Policy Institute.https://www.epi.org/blog/gender-wage-gap-persists-in-2023-women-are-paid-roughly-22-less-than-men-on-average/

    [11] New Jersey Treasury (October 31, 2024). “New Jersey’s Pension Fund Reports 10.74% Returns for FY2024.” https://www.nj.gov/treasury/news/2024/10312024.shtml

    [12] Wisconsin Legislative Council. 2023-24 Comparative Study Of Major Public Employee Retirement Systems, October 2024. https://docs.legis.wisconsin.gov/misc/lc/comparative_retirement_study/2023_retirement.pdf

    Eliminating the U.S. Department of Education Would Devastate New Jersey’s Communities

    Today, President Donald Trump signed an executive order to direct Education Secretary Linda McMahon to begin taking steps to close the U.S. Department of Education (USED). The executive order’s directive to “ensure the effective and uninterrupted delivery of services, programs, and benefits on which Americans rely” would be impossible without full staffing and funding for the Department’s experts. The Trump Administration’s efforts to weaken or dismantle USED raise legal and policy concerns as only an act of Congress can completely dissolve the Department. In response, New Jersey Policy Perspective (NJPP) released the following statement:

    Mark Weber, Special Analyst for Education Policy, NJPP:

    “Any weakening of USED would have far-reaching and long-term disastrous effects nationwide and on New Jersey’s communities, especially for children in school districts with historically higher concentrations of poverty. Even if Congress chose to eliminate USED, much of its work would have to be offloaded to other departments or agencies, undermining efforts to improve efficiency and reduce spending.

    “This latest executive order is an illegal attempt to realize a far-right goal outlined in Project 2025 — and ultimately, it is the first step toward dismantling public education as a whole. However, New Jersey’s schools are among the best in the nation and its residents are strong believers in public schools and college access. Once again, the president demonstrates he is severely out of touch with the values that make the Garden State great.”

    Read NJPP’s latest analysis on the federal administration’s efforts to dismantle USED.

    ###

    Dismantling U.S. Dept. of Ed. is Costly and Inefficient for New Jersey

    A strong education system is fundamental to opportunity, economic mobility, and the long-term success of our communities. The Trump Administration’s efforts to weaken or dismantle the U.S. Department of Education (USED) raise both legal and policy concerns. Only an act of Congress can dissolve the Department; until then, the President has an obligation to keep it staffed and fully functioning. Furthermore, even if Congress were to choose to eliminate USED, much of its work would have to be offloaded to other departments or agencies, undermining efforts to improve efficiency and reduce spending.

    Title I grants, for example, must still be distributed according to federal law.[1] These Congressionally-mandated grants specifically support schools serving large numbers of students from low-income backgrounds; they cannot be halted by any administration, even if the Department is dissolved. Over many years, USED staff have developed expertise in data collection and grant administration, ensuring that complex Title I funding formulas are accurately implemented and that schools receive critically important resources.[2] Eliminating that institutional expertise  — only to have to rebuild it elsewhere — would be an inefficient use of both time and taxpayer money.

    In 2022, about 7 percent of the revenues for New Jersey’s school districts came from federal sources.[3] Districts with higher concentrations of poverty, however, are more reliant on federal aid; in Camden, for example, nearly 15 percent of revenues came from federal sources. Slashing this funding would have devastating effects on the school districts serving our most economically disadvantaged children.

    New Jersey’s colleges also rely heavily on USED and the federal funding it distributes. In 2024, New Jersey’s postsecondary students received nearly $1 billion in federal grants and an additional $1.6 billion in federal direct student loans.[4] Until recently, the Department has also played a significant role in protecting students’ civil rights on college campuses. Weakening or eliminating the Department would put the rights of students, faculty, and staff in jeopardy at New Jersey’s universities and colleges.

    Dismantling USED would have far-reaching and long-term disastrous effects both nationwide and for communities across New Jersey. As the state grapples with a structural budget deficit, lawmakers must prioritize defending the critical programs, policies, and federal spending that support New Jersey students and schools.


    End Notes

    [1] https://crsreports.congress.gov/product/pdf/R/R47702

    [2] https://nces.ed.gov/pubs2019/2019016.pdf

    [3] Author’s calculation from data published by the US Census: https://www.census.gov/data/tables/2022/econ/school-finances/secondary-education-finance.html

    [4]
    https://www.ed.gov/about/ed-overview/annual-performance-reports/budget/us-department-of-education-budget-history

    New Jersey Must Embrace an Educational Policy of Inclusion, Truth, Respect, and Academic Excellence

    Yesterday, President Donald Trump signed three executive orders to direct federal agencies to “end indoctrination” in K-12 education, investigate campus protests, and enact a federal school choice voucher initiative. These orders seek to block federal funding for schools that affirm transgender students’ gender identity, censor the teaching of American history, specifically on race and slavery, and direct the Department of Education to prioritize school choice in discretionary grant programs. In response, New Jersey Policy Perspective (NJPP) released the following statement.

    Mark Weber, NJPP, Special Analyst for Education Policy:

    “This is a gross overreach of federal power and antithetical to the values that New Jersey aspires to uphold. The federal government has always had a limited role in K-12 education. The U.S. Constitution does not explicitly guarantee children the right to attend publicly-funded schools — but the New Jersey Constitution does.

    “New Jersey has long been a leader in education and has made significant strides in expanding access to quality education for all students, regardless of their backgrounds. These executive orders would dismantle that progress by undermining protections for LGBTQ+ students, censoring discussions on race and history, and promoting policies that divert resources away from public schools.

    “New Jersey aspires to affirm the dignity of every child, no matter their gender; to teach the truth about our state’s and our nation’s history, including the abuses and discrimination visited by many of our ancestors; and to protect the constitutional rights of its students and educators, including the rights to free speech and to peaceably assemble.

    “Unlike private schools, New Jersey expects its public school districts to provide an adequate education for every student who comes to its doors, regardless of gender, race, ethnicity, religion, or immigration status. Public schools are the backbone of our economy and society, and policies that weaken them only deepen inequalities.

    “The state’s education system hasn’t always lived up to the state’s ideals; NJPP has documented many of the challenges that remain, starting with a school funding system in need of immediate reform. But the Trump agenda of transphobia, school privatization, and whitewashing history is not compatible with the values that make New Jersey great. We urge all state leaders, educators, parents, and students to reject this administration’s blatantly unconstitutional orders and, instead, embrace an educational policy of inclusion, truth, respect, and academic excellence.”

    ###

    Reforming School Funding in New Jersey: Equity For Taxpayers, Excellence For Students

    Executive Summary

    There is growing consensus among New Jersey’s legislators, school leaders, educators, and other stakeholders: It’s time for the legislature to implement long-needed changes to its K-12 funding law, the School Funding Reform Act (SFRA). This report provides guidance for revising SFRA, focusing specifically on the issue of school revenues.

    New Jersey’s local property taxes are less regressive than in neighboring states; this is, in no small part, due to the state school aid provided by SFRA. However, funding for schools has declined as a percentage of the state’s economy, suggesting there is room for improvement. To raise adequate funding, SFRA advises a local contribution from each school district; however, the calculation of that “Local Fair Share” (LFS) is not transparent, resulting in local tax inequities across otherwise similar school districts.

    Specifically, this report examines how factors other than district wealth affect tax equity. Although the former Abbott districts pay less than similar districts in school taxes, their overall local tax burden (which includes municipal taxes) is similar. Disturbingly, districts with larger populations of students of color, especially Latinx/Hispanic students, pay much higher total tax rates than similarly wealthy districts. This report also finds that districts with larger shares of non-residential property raise more local revenue, even though districts are expected to contribute less under SFRA.

    Given these findings, this report recommends that New Jersey reevaluate the revenue calculations in SFRA, paying particular attention to the effects on tax equity that arise from setting the property and income rates. The Department of Education should develop a set of indicators to monitor school property tax, total property tax, and overall tax equity, both at the local and state level. Given this report’s findings of inequitable tax rates for communities of color, these indicators should evaluate disparities in tax rates by race, ethnicity, and income.

    This report also recommends that, once valid and equitable LFS amounts are calculated, localities should be required by the state to provide that share to their schools if they are below their adequacy threshold — adequacy as defined as the amount of funding needed for a school district to provide a constitutionally mandated, high-quality education — with the understanding that the state will also provide the aid needed for districts to reach their adequacy targets. Districts facing tax increases should be able to phase in those increases over time. To aid in the collection of these local revenues, non-residential properties should be taxed at the regional or state level, allowing for a more equitable distribution of revenues to the districts where they are most needed.

    Finally, this report’s appendices include an update of earlier work focused on “adequacy” with a new analysis that supports previous recommendations: SFRA needs to be adjusted to provide more funding to the highest-poverty districts if they are to meet current, more rigorous standards.

    Introduction

    New Jersey’s public schools rely on a complex system of funding, drawing primarily from local and state taxes, with federal contributions playing a smaller, yet important, role. In 2008, the state’s School Funding Reform Act (SFRA) was enacted to ensure equitable distribution of state resources, particularly for districts with higher levels of poverty. However, the application of SFRA’s Local Fair Share (LFS) formula — determining how much a community should contribute based on its wealth and tax capacity — has led to significant disparities in local taxes.

    In 2024, school funding became a contentious issue in New Jersey. Even as the state moved toward fully funding SFRA, some local districts objected to cuts in state aid. While subsequent legislation provided some relief to some of these districts, there is growing consensus that SFRA needs to be overhauled. Lawmakers are expected to propose changes to the formula at the heart of SFRA.

    This report focuses on the revenue side of SFRA, examining how much the state expects school districts to raise through local property taxes. Specifically, it offers: (1) guidance on how to set valid “Local Fair Share” amounts for school districts, recognizing that different communities have varying capacities to raise local funds for schools; (2) recommends that SFRA should direct more state aid to communities that maintain relatively high tax rates but have lower property values, limiting their capacity to raise sufficient funds; and (3) suggests that the formula should set local fair share amounts that avoid regressive and inequitable tax rates, while ensuring that schools can secure the necessary revenues to provide a high-quality education.

    Before the legislature begins this work, it’s important to take a step back and remember who SFRA affects and why its design is essential not only for school districts but all of New Jersey’s residents. Like all state school funding systems, SFRA was designed with two constituencies in mind:

    1. Students, who need adequately funded schools to receive a quality education
    2. Taxpayers, who should be taxed fairly based on their ability to pay

    Regarding students: Statewide school funding systems, like New Jersey’s SFRA, are premised on the fact that different students in different contexts require different amounts of funding to reach the state’s outcome goals. For example, decades of research have shown that students in poverty, on average, require more resources in schools to achieve the same outcomes as more affluent students.[i] Students whose native language is not English or students with learning disabilities also require more resources to have more equitable educational opportunities.[ii]

    Based on this research, New Jersey should be driving more resources toward school districts serving a greater number of students in poverty. In the decade before the Great Recession of 2008, the state was, in fact, doing just that: high-poverty districts were, on average, receiving considerably more revenues than low-poverty districts. This changed in 2010 by the end of the Christie administration when New Jersey’s highest- and lowest-poverty school districts were spending roughly the same amount per pupil. Appendix A presents more details.

    SFRA was supposed to address the needs of higher-poverty school districts by setting higher funding targets for those districts. However, as previous reports have detailed, New Jersey still does not provide enough revenue for its highest-poverty school districts to meet the state’s current, rigorous educational goals.[iii] Appendix B includes an updated analysis of SFRA’s adequacy targets, revealing that the poverty weights in SFRA continue to be too low to meet state constitutional requirements.

    Regarding taxpayers: A fair school funding system considers the wide differences in “tax capacity” — the ability to raise local revenues — between school districts. Keep in mind that local school revenues are raised almost entirely through property taxes. Districts with higher property values, per pupil, have an advantage over others: they can raise the necessary revenue to fund their schools without having to raise tax rates as high as districts with lower property values. Overall, districts with lots of property wealth can maintain relatively low tax rates while still generating the revenue their schools need.

    SFRA was adopted, in part, to smooth out unevenness in school funding by providing statewide, systematic, and predictable adequacy budgets for all districts and children — not just the districts that were party to litigation. But SFRA also sets the share of those adequacy budgets that school districts will fund through local property taxes. By setting targets for spending and local revenue, SFRA attempts to allocate state revenues so that school funding is both adequate for students to receive an excellent education and fair for taxpayers.

    Paying For Public Schools in New Jersey

    Schools rely on three primary sources of revenue: local, state, and federal. As shown below (Figure 1), federal funding is a relatively small part of overall revenues. The majority of federal funding is allocated through programs such as Title I, which drives more revenues toward districts with higher poverty rates. These funds are supposed to “supplement, not supplant” other sources of funding.[iv] As a result, school funding systems focus primarily state and local revenue sources.

    Figure 1
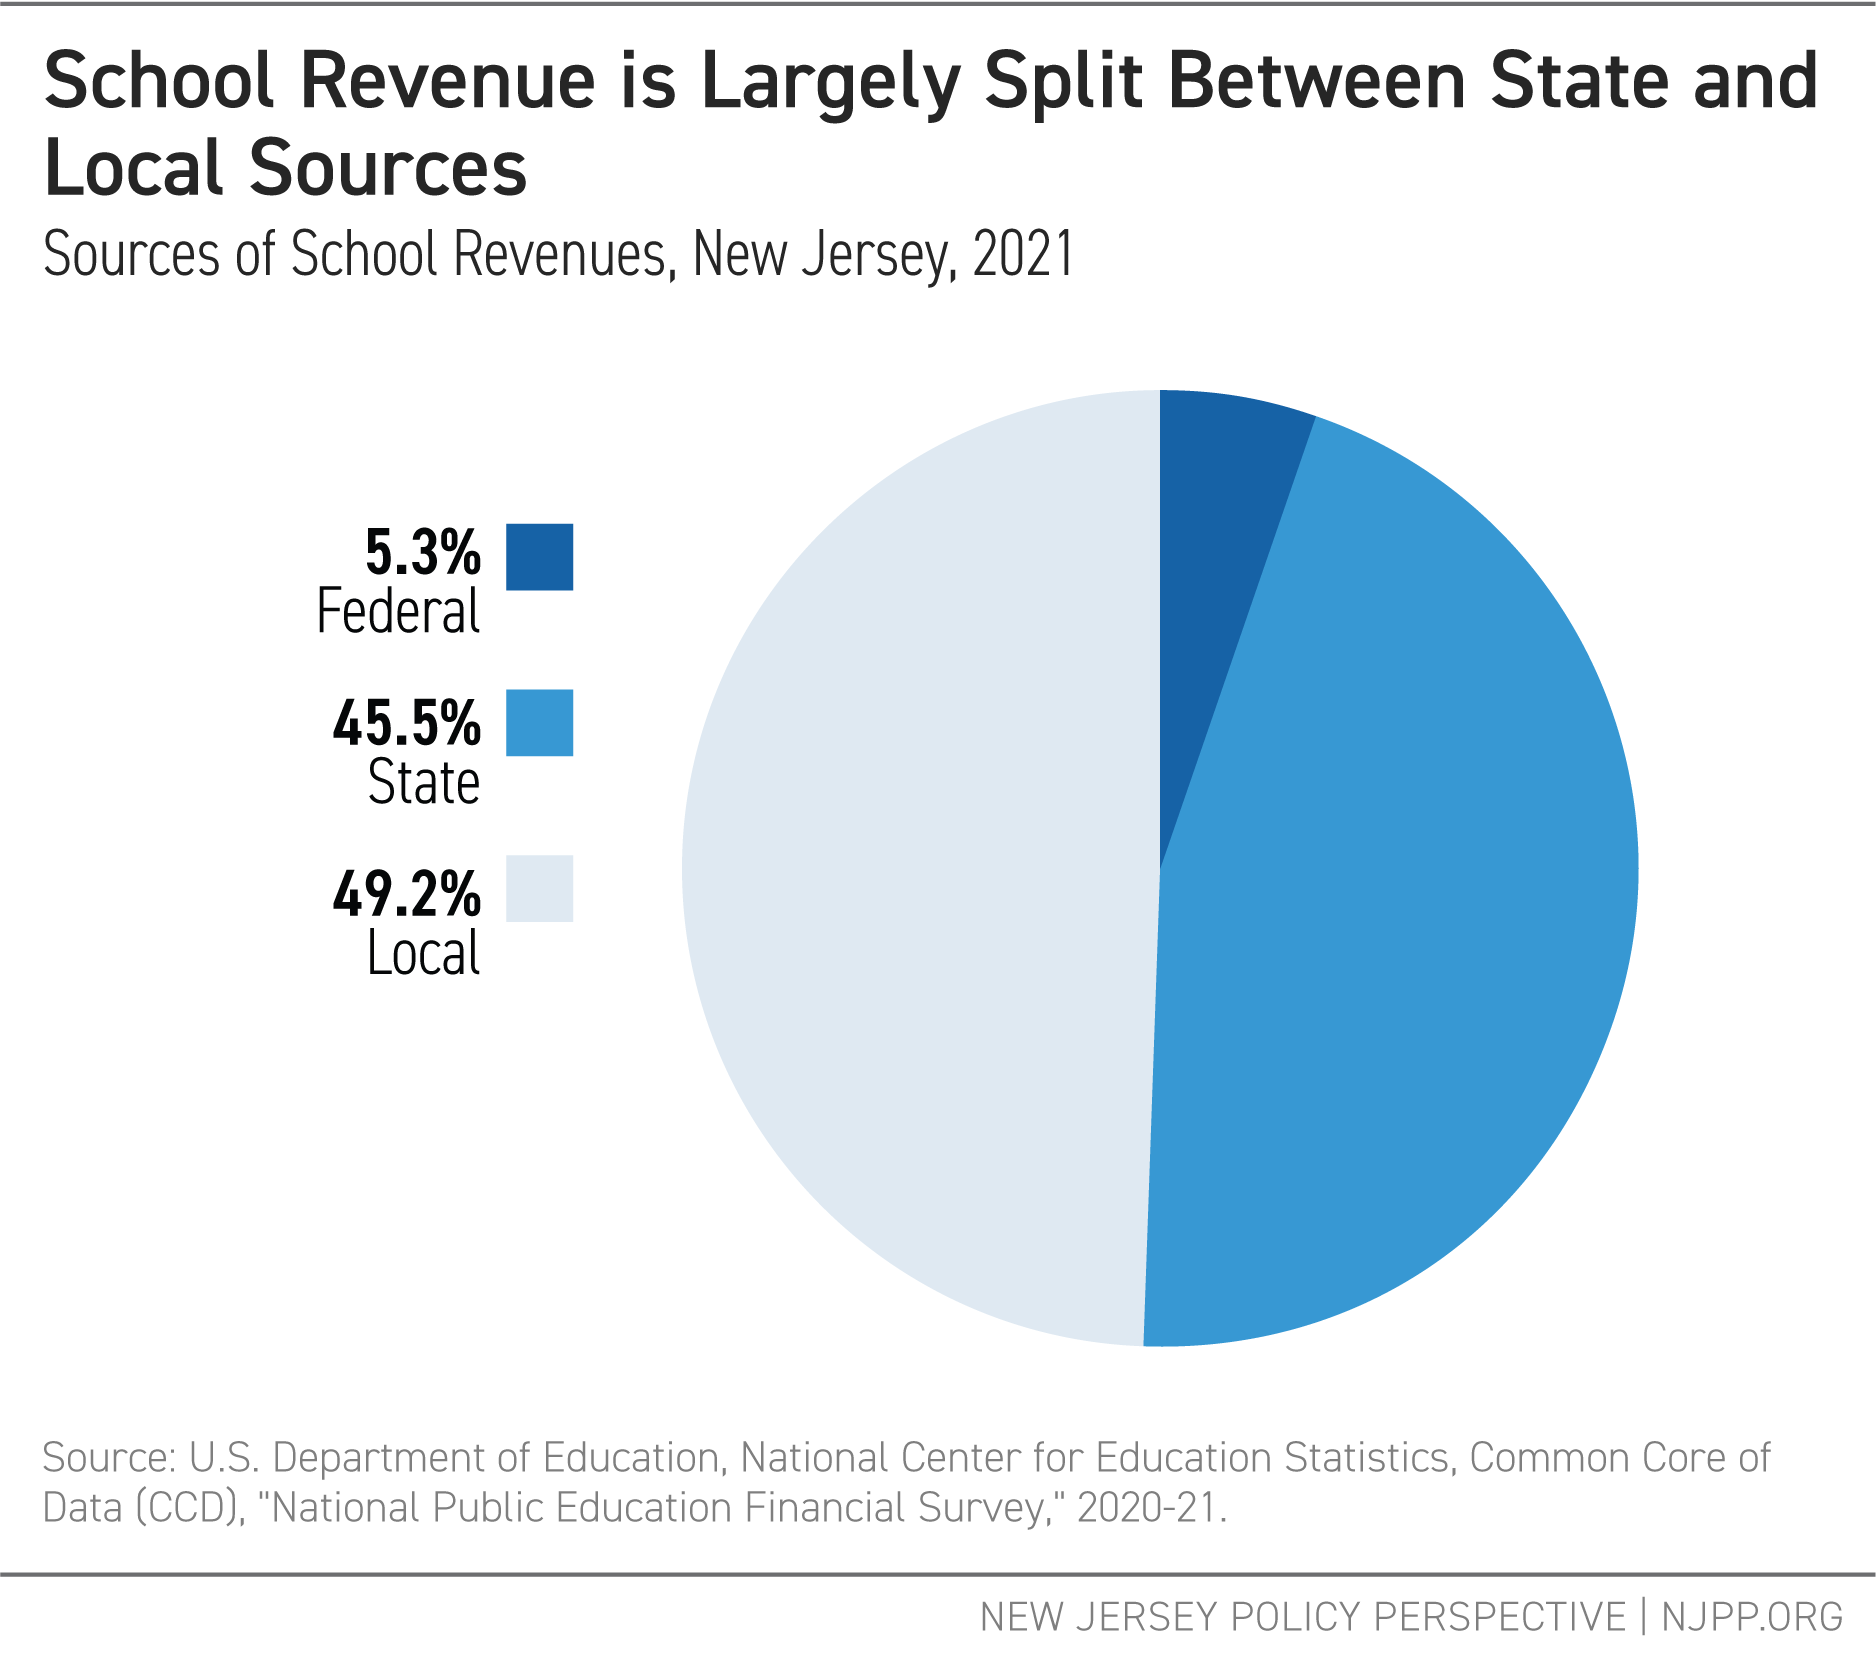
    School Revenue is Largely Split Between State and Local Sources

    Although overall school revenues in New Jersey are split nearly evenly between state and local taxes, the reliance on each revenue source varies widely across individual districts. SFRA requires more affluent districts to contribute more local funding to their schools because they have greater capacity to do so. Some districts get nearly all of their funding from local sources because they have greater property wealth and, therefore, greater tax capacity. Others get the majority of their revenues from the state because their property wealth and, therefore, tax capacity is relatively low. This approach helps to reduce the regressivity of New Jersey’s taxes; however, the current configuration of SFRA still results in substantial inequities in local property taxes. Correcting these inequities, which this report describes below, should be a primary objective of any reforms to SFRA.

    To illustrate how different towns have different tax capacities, Table 1 shows data for three towns in Essex County. Millburn, which has very low child poverty, also has very high property values per pupil. Irvington, a town with high poverty, has comparatively low property values, while Belleville falls between the two. Because Irvington has much lower property values, it would have to tax itself at a much higher rate than Millburn to generate the same amount per pupil. In this illustration, the three districts all aim to raise $10,000 per pupil; but Irvington’s tax rate would need to be six times higher than Millburn’s to raise the same amount.

    Table 1:
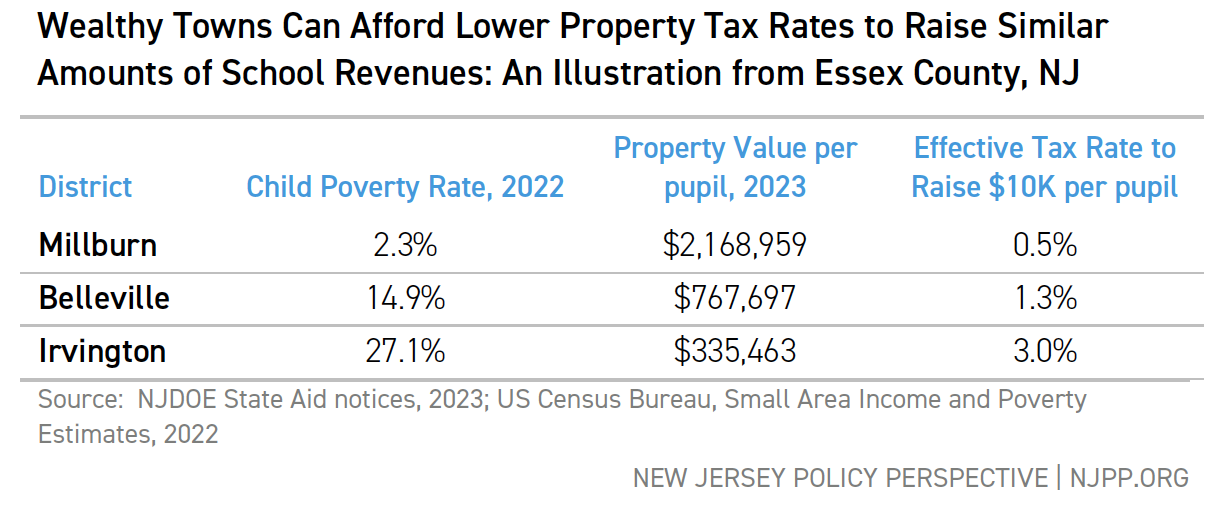
    Wealthy Towns Can Afford Lower Property Tax Rates to Raise Similar Amounts of School Revenues: An Illustration from Essex County, NJ

    As this example shows, without state aid, districts with low property values would have to pay much higher effective tax rates to fund their schools compared to districts with high property values. SFRA addresses this disparity by calculating a Local Fair Share (LFS): an amount local districts are expected to raise without imposing an undue tax burden. This report explores how SFRA calculates LFS, and how it could improve that calculation.

    Appendix C further discusses the mix of taxes states use to fund schools, and the relative advantages or disadvantages of different revenue sources. To summarize: even though property taxes can be regressive, there are good reasons to include them in the mix of revenues used to fund schools. In a related analysis, Appendix D explores New Jersey’s tax effort: the percentage of the state’s economy devoted to K-12 education. Relative to other states, New Jersey does make a strong effort to fund its schools; however, given the decrease in effort following the Great Recession of 2008, there is still room for improvement.

    Tax Progressivity in New Jersey and Its Neighbors

    A tax system can be classified as either “progressive” or “regressive.” In a progressive tax system, taxes increase as income rises, whereas a regressive tax system requires low-wage workers to pay a greater share of their income in taxes than those with higher incomes. Because different taxes have different effects on tax equity, the mix of tax types in a state will affect its tax progressivity: the average differences in total effective tax rates for taxpayers of different incomes.

    It is useful to compare New Jersey to its neighbors when assessing tax progressivity. Table 2 shows that individual property taxation in New Jersey is generally less regressive than Pennsylvania’s, and the lowest-income residents in New Jersey pay lower tax rates than their counterparts in New York. Any reforms of SFRA should not undermine this relative tax progressivity.

    Table 2:
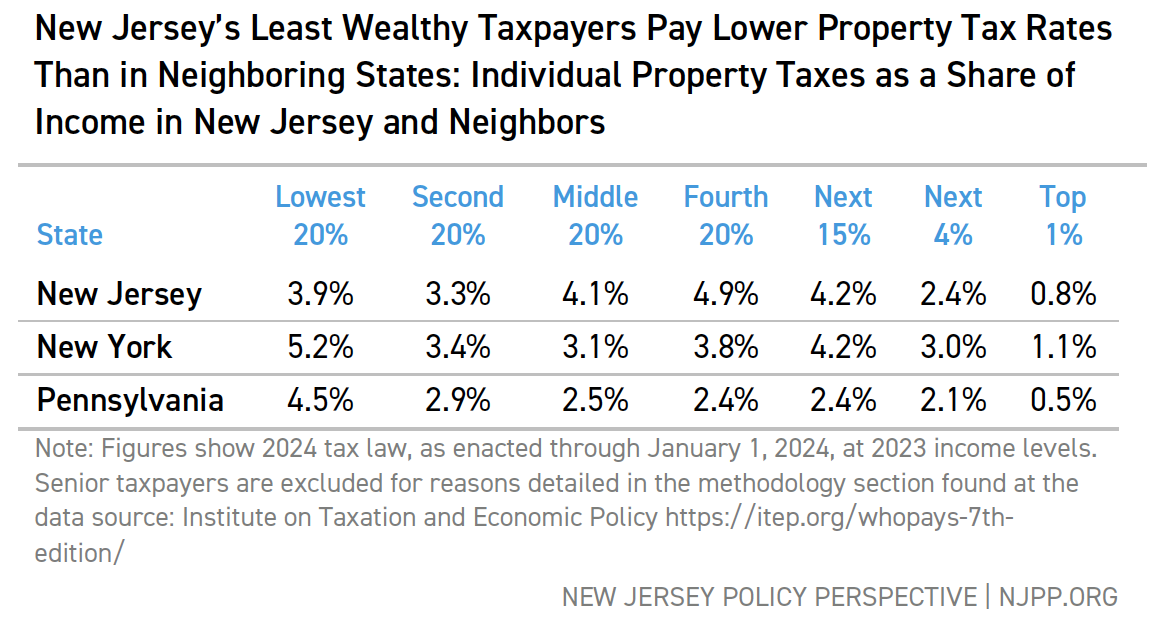
    New Jersey's Least Wealthy Taxpayers Pay Lower Property Tax Rates Than in Neighboring States: Individual Property Taxes as a Share of Income in New Jersey and NeighborsLocal Fair Share

    The core of SFRA’s revenue calculation is Local Fair Share (LFS). The theory behind SFRA’s LFS formula is that there is “fair” amount each community should pay to fund its schools, based on its capacity to raise revenues through local taxes. Once that amount is set, the state then comes in and provides additional funding to help school districts reach their adequacy targets. It’s important to note that until FY 2025, some districts have never received the full funding they were entitled to under SFRA to reach those targets.

    Although local school revenues are almost entirely collected through property taxes, the school district’s tax capacity is determined by more than just property values. The LFS formula is:

    Local Fair Share = [(District Aggregate Property Value * Property Rate) + (District Aggregate Personal Income * Income Rate)] / 2

    Again, the theory behind LFS is that communities with less wealth — and, therefore, less tax capacity — should receive more state aid to fund their schools as they generate less from local property taxes than wealthier communities. This approach aims to make tax rates less regressive, if not fully progressive. However, in practice, the outcome doesn’t always align with this theory. To illustrate, we return to our three districts in Essex County, as shown in Table 3.

    Table 3:
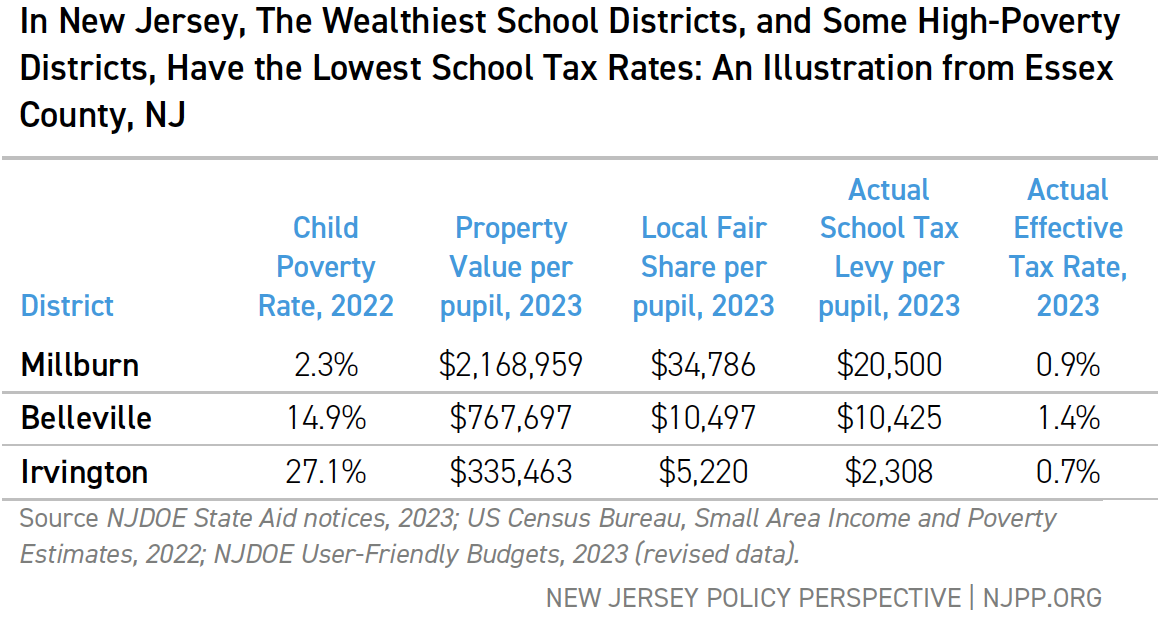
    In New Jersey, The Wealthiest School Districts, and Some High-Poverty Districts, Have the Lowest School Tax Rates: An Illustration from Essex County, NJ

    As expected, Millburn, with its significant property wealth, has a much higher LFS than Belleville, which in turn has a larger LFS than Irvington. But Millburn’s actual tax levy falls well below its LFS; this affluent town doesn’t need to raise taxes to its LFS level to adequately fund its schools and maintain its status as a high-performing district. Belleville, on the other hand, raises nearly exactly what its LFS calls for and has the highest effective school tax rate among the three communities. Unlike Irvington, Belleville was not party to the Abbott rulings; as discussed below, Abbott districts tend to have lower effective school tax rates than non-Abbott districts like Belleville. However, the total tax rates are not systemically lower in Abbott districts (see below), a crucial point when discussing how SFRA should calculate LFS.

    Local Fair Share and Taxes

    As mentioned above, the SFRA formula calculates a town’s LFS by multiplying its total property value by a property rate, and its total personal income by an income rate. The Education Commissioner determines both the property rate and the income rate. These rates vary annually and play a significant role in determining a district’s LFS and, consequently, the amount of state aid each district receives. By adjusting the rates, the Commissioner has the power to substantially alter the distribution of state aid to schools.

    To illustrate the differences between property values and income as used in SFRA, Figure 2 shows (a) local fair share and (b) actual local revenue per pupil in relation to taxable property wealth per pupil; Figure 3 presents the same data but in relation to median household income. Overall, as property values or income increases, LFS and actual revenue also rise. However, the relationship between local fair share and taxable property wealth is stronger than the relationship between local fair share and median household income.[v] Likewise, the relationship between actual revenues and property wealth is stronger than the relationship between actual revenues and income.

    Figure 2
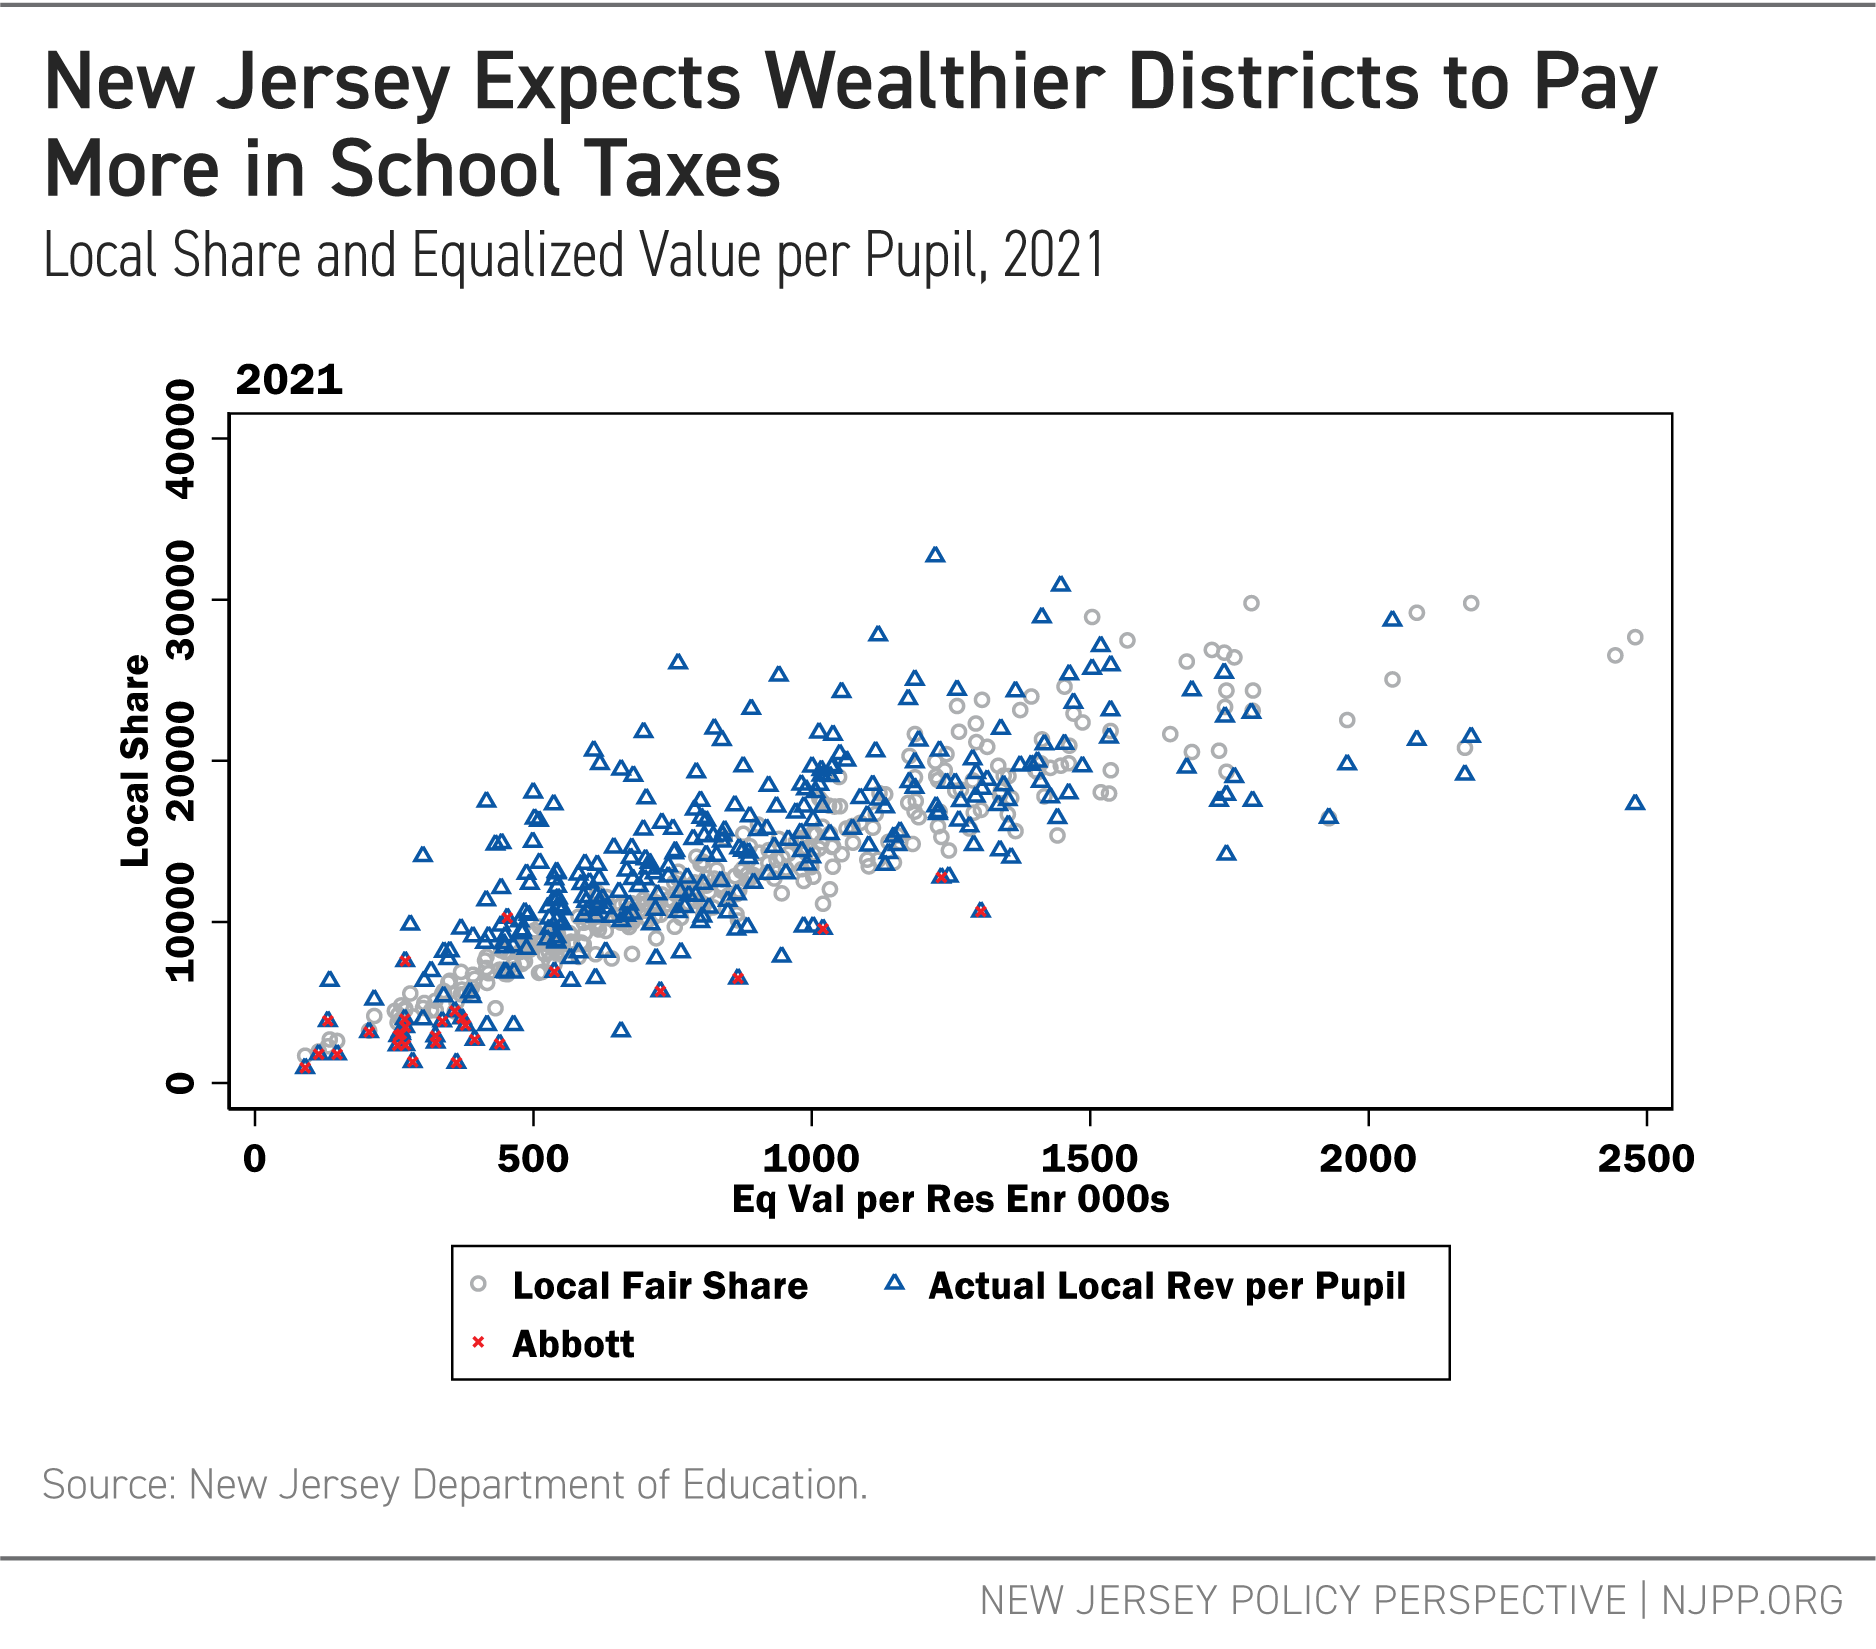
    New Jersey Expects Wealthier Districts to Pay More in School Taxes

    Figure 3

    "Local Fair Share" Correlates More Closely with Property Value Than With Income

    Both property values and income are indicators of a district’s tax capacity; however, they do not always align perfectly. Figure 2 shows that the relationship between local fair share relationship and taxable property wealth is relatively consistent. As expected, districts with higher equalized property values contribute more toward their adequacy targets. Although some districts raise more than their LFS and others raise less, the variation is relatively minimal.

    Figure 3, in contrast, shows the same trend but with a less consistent relationship between income and local share. Many districts are expected to raise relatively more revenues than their income levels would suggest, while others are expected to raise less.

    Former Abbott districts, shown with a red marker, are typically very low in both taxable property wealth and median household income. Many of these districts continue to raise local revenue below their local fair share. This is due to primarily three reasons: First, funding to Abbott districts before SFRA was allocated without considering for local capacity, which allowed these districts to maintain very low school taxes — a practice that has persisted under the era of SFRA. Second, the local fair share is not a mandatory requirement; districts are not obligated to raise revenues equal to their LFS if they choose not to. Third, legal limits on tax increases prohibited these districts from raising taxes to meet the LFS requirement. Importantly, and as the analyses that follow show, the low school tax rates in these districts do not necessarily mean they have low total tax taxes.

    The differences in the relationship between property values and local share versus income and local share highlight an important aspect of New Jersey’s school funding formula: The property and income rates set by SFRA have profound consequences for both school funding and local taxes. Changing one rate relative to the other will change a district’s LFS, even if the underlying tax capacity of that district remains the same. Again, the Education Commissioner set these rates, with no requirement to provide an explanation for how these rates are determined.

    School Taxes vs. Total Local Taxes

    School taxes represent only a portion of a locality’s total local taxes; additional revenues for other public services must also be raised through property taxes. Figure 4 shows effective school and total tax rates in relation to the Local Fair Share ratio for school districts.[vi] From left to right, districts generally range lower to higher in taxable wealth and income, which are key factors in determining local fair share requirements.

    Effective school tax rates are relatively flat across the spectrum, with a slight increase in the middle. This suggests that state school aid over time has been effective in maintaining lower local school tax rates in the districts with the lowest wealth and income, thereby keeping those rates relatively equitable compared with wealthier districts. However, the same is not true for total property tax rates. Despite achieving some level of equity in local school rates, total local tax rates remain systematically higher in lower-wealth communities.

    Figure 4
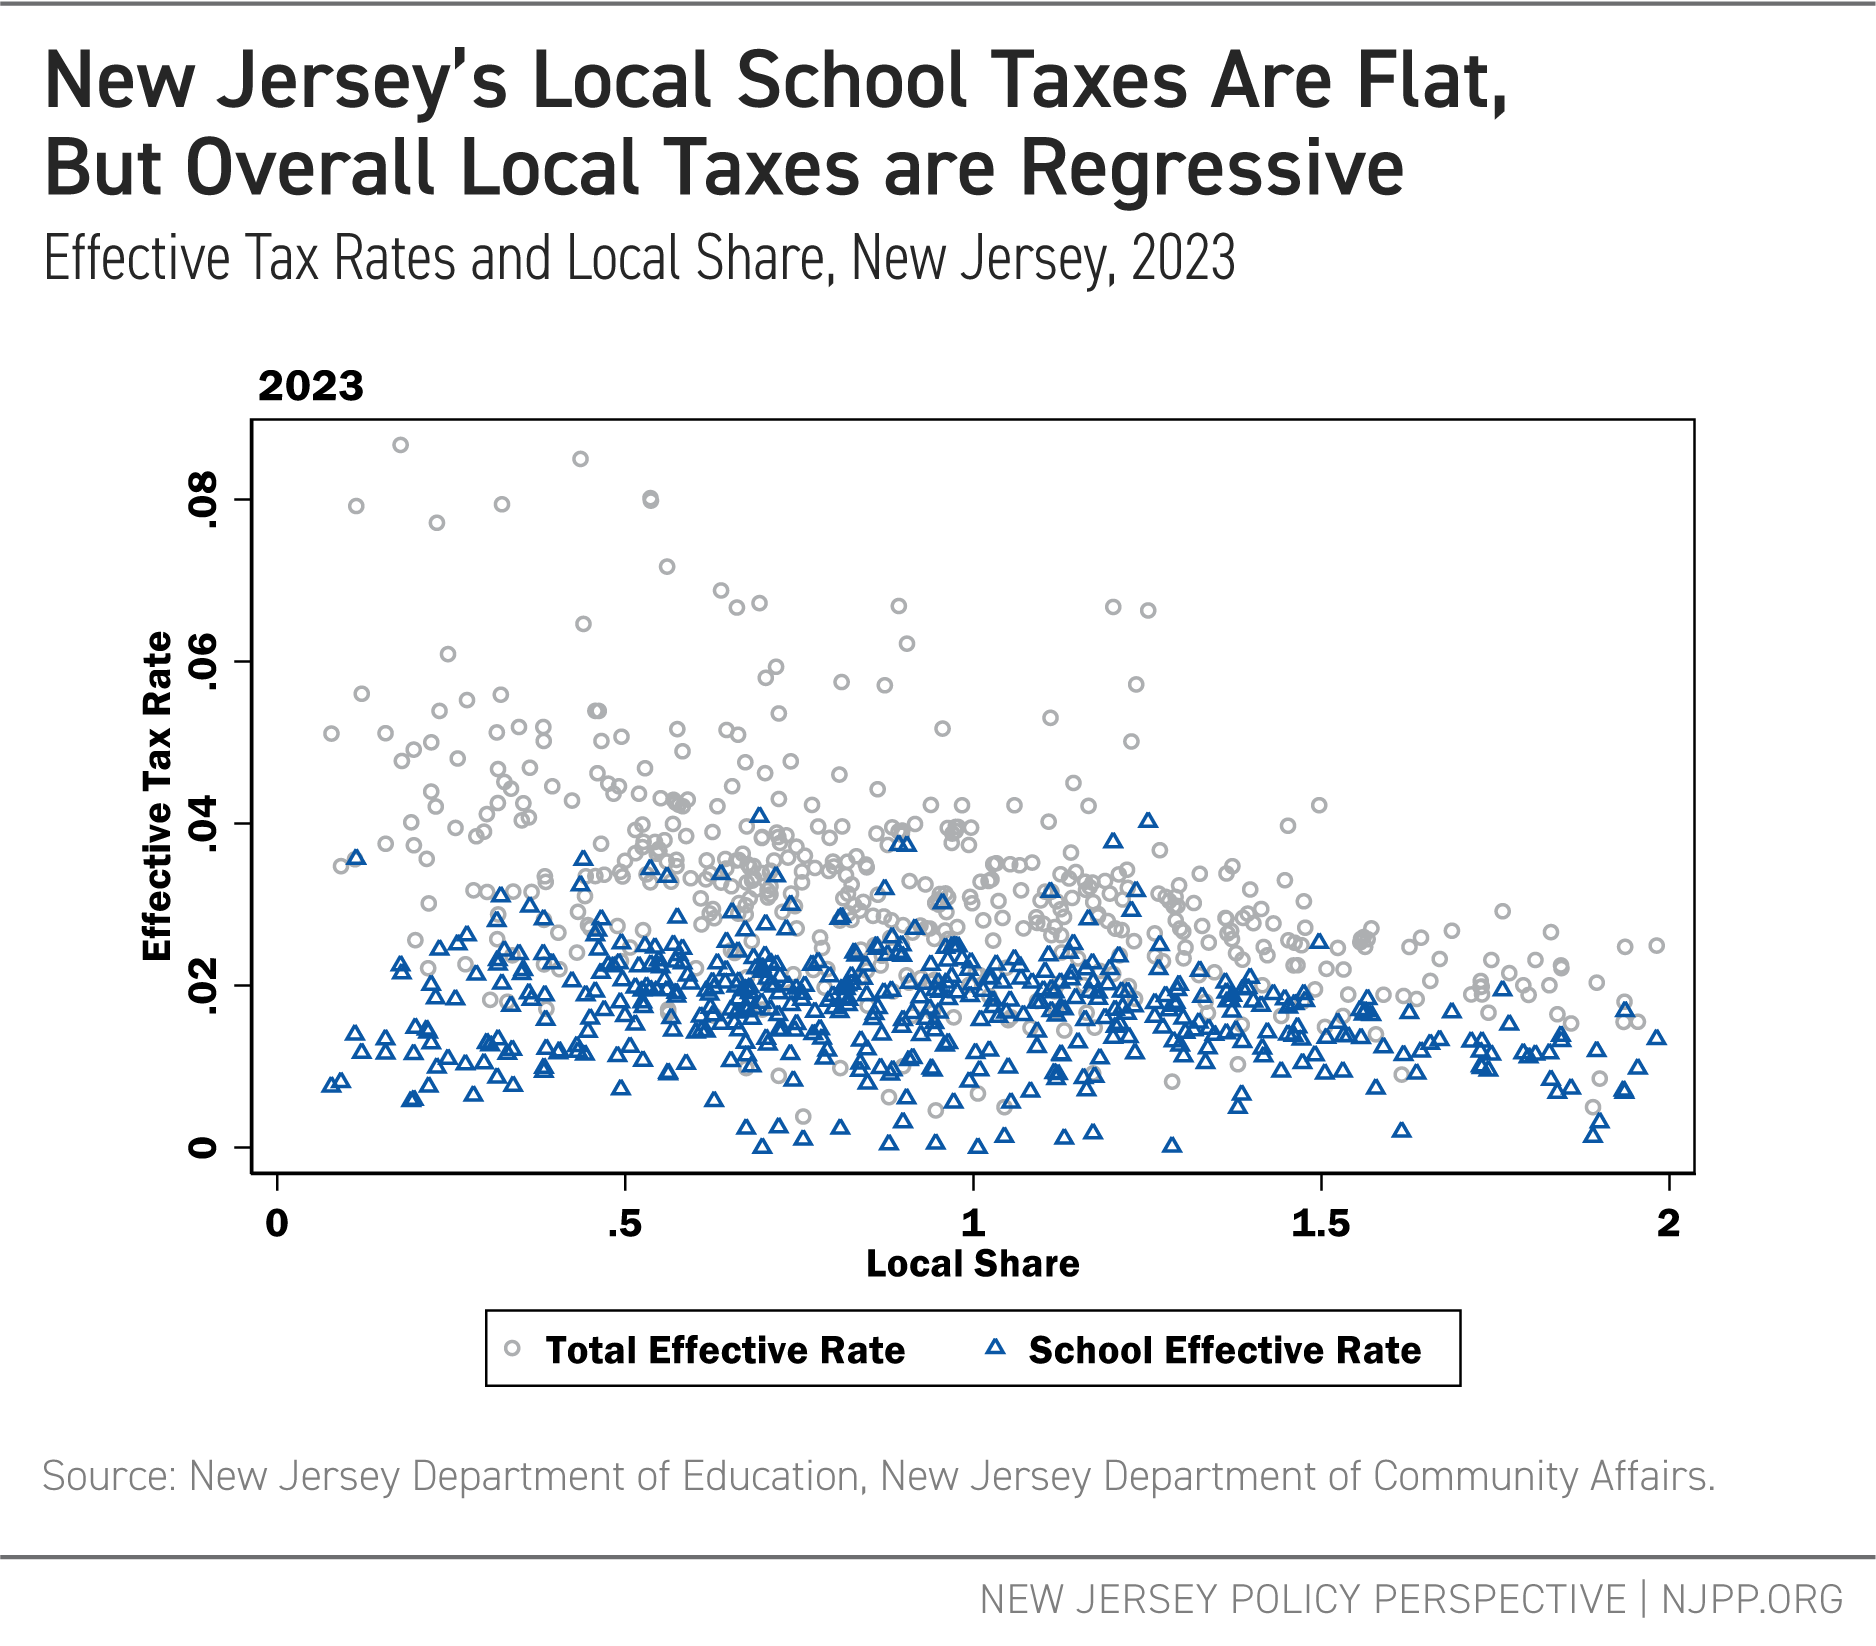
    New Jersey's Local School Taxes Are Flat, but Overall Local Taxes are Regressive

    Local Tax Equity

    To better understand the effect of SFRA’s formula on tax equity, the authors conducted a series of regression analyses to identify factors associated with differences in (a) local fair share, (b) local revenue per pupil, (c) school tax rates, and (d) total tax rates. The full models, detailed in Appendix E, enable us to isolate the impacts of different district characteristics on tax rates while controlling for other variables. We included measures of taxable wealth per pupil, housing values, and median household income, analyzing data from 2013 to 2020. As expected, local shares and local revenues are higher in higher-income and higher-taxable wealth districts.

    Derived from these regression models, Figure 5 focuses on factors associated with differences in local revenue. Former Abbott districts have local fair share expectations in line with their wealth and income (as controlled for in model); however, they generally raise significantly less local revenue per pupil than similar non-Abbott districts.

    Figure 5

    School Districts with Greater Shares of Black Students Are Expected to Pay Higher School Taxes

    Figure 6 provides insight into why Abbott districts raise less revenue: their effective school tax rates are lower than other, similar districts. However, their total local tax rates are roughly equivalent to those of comparable districts. The interplay between school taxes, total taxes, and municipal obligations warrants further study; but for now, it is sufficient to note that total tax rates should be considered in any analysis and reform of the SFRA formula.

    Figure 6

    School Districts with Greater Shares of Hispanic Students Have Much Higher Local Tax Rates

    The most important — but, given previous work, not unexpected — disparity revealed across the figures is that as Hispanic/Latinx enrollment increases, local revenues decline and local tax rates, particularly total tax rates, increase. Earlier NJPP reports have documented funding gaps in predominantly Hispanic/Latinx districts in New Jersey;[vii] the current models here provide additional evidence of this disturbing reality. These models also indicate that even the local fair share calculation disproportionately burdens these communities, holding other factors constant. This disparity is even more pronounced in Black communities, which face higher local share expectations, all else being equal. But it is Hispanic/Latinx communities that face significantly higher local taxation as a result. Reforms of SFRA must include changes that eliminate these persistent and inequitable tax effects on communities of color.

    Another key issue involves taxable property wealth that is non-residential (commercial, industrial, etc.). In communities with proportionately more non-residential property, LFS is lower, yet the actual revenues raised are higher. In other words, school districts with more non-residential property raise more in local revenues, even though they are expected to raise less.

    The easiest tax for which to gain political support is the tax on someone else. Property taxes on non-residential properties are partially borne by non-local residents: outsiders who don’t access the local schools still pay some school taxes when they conduct business within the district. However, this non-residential taxable wealth is unevenly distributed across taxing jurisdictions, often causing significant revenue-raising disparities. The value of those properties does not depend exclusively on the demand for their products or services within the same jurisdiction (think, for example, Paramus or Cherry Hill shopping areas). As such, school finance experts have long argued that such properties could or should be taxed regionally or statewide to balance these local tax distortions and provide more equitable statewide revenue distribution according to costs and needs across districts.[viii]

    Conclusions and Recommendations

    New Jersey’s School Funding Reform Act (SFRA) is due for a revision: it is not providing enough funding to the districts that need it the most, and its method for calculating local fair share should be improved.

    Regarding the setting of adequacy targets, this report recommends:

    1. Strictly adhere to the schedule of updating the formula every three years, using cost-modeling methods to guide any changes.
    2. Implement data-driven, cost-modeling approaches based on current standards to determine base costs and weights in SFRA. This will increase the weights for poverty in SFRA’s formula, which is necessary for high-poverty districts to receive the revenues needed to meet New Jersey’s current, more rigorous standards. (See Appendix B for more)

    Regarding the revenue side of SFRA, this report recommends the following:

    1. The New Jersey Department of Education (NJDOE) should develop a set of indicators to monitor the equity of school property taxes, total property taxes, and overall tax burdens annually.
    2. NJDOE should then use these indicators to evaluate tax disparities related to race, ethnicity, and income of taxpayers and students.
    3. Using these indicators, the state should reassess the property and income rates in the Local Fair Share (LFS) part of the SFRA formula, aiming to establish rates that promote goals of tax equity and progressivity.
    4. Once Local Fair Share amounts are set to reasonable and equitable levels that are not an undue burden on local taxpayers, the state should require school districts that are under SFRA adequacy to raise their full LFS through local taxes. Districts should provide their LFS with the understanding that the state will fully fund SFRA to meet current outcome goals. Again, total local taxes should be accounted for when calculating LFS. If districts need to raise local taxes rates to meet their LFS, those rates should be phased in over time to avoid any shocks to taxpayers.
    5. Regionalize industrial and commercial property taxes to distribute their revenues more equitably and correct racially and ethnically disparate local share requirements.

    Appendices

    Appendix A: An Update On New Jersey School Funding Equity

    When New Jersey adopted the School Funding Reform Act (SFRA) in 2008, the state already had one of the country’s most progressive state school funding systems, targeting substantial additional state funding to the districts, schools, and children that needed those resources most. However, the distribution of state aid was determined largely by decades of litigation (known as the Abbott rulings), resulting in state aid targeted explicitly to only those districts that brought the litigation. While this drove a significant amount of revenue to the school districts that needed it the most, state aid — and its influence on local property taxation — was still uneven: some districts needed more financial help to fund their schools and keep their local taxes equitable.

    Unfortunately, the adoption of SFRA was met with the onset of the Great Recession and Governor Chris Christie’s subsequent decision to cut state aid to schools. It is not an overstatement to say that 2008 represents the beginning of the collapse of school funding equity in New Jersey. While recent years have seen some improvement, the consequences of this collapse still affect many New Jersey school children and taxpayers.  

    Figure 7 shows how the recession and Christie’s cuts impeded New Jersey’s effort to equitably fund its school districts. In the early to mid-1990s, the ratio of current spending per pupil to state and local revenue per pupil were roughly the same (1:1, or index of 1.0) for districts that had very low child poverty rates compared to those that had very high child poverty rates. This was despite the widely known fact that children in poverty need more school funding to ensure equal educational opportunities.[ix] However, throughout the 2000’s, the Abbott rulings forced the state to increase aid to many high-poverty districts, leading to more equitable funding. This trend reversed during the Christie Administration, and by 2019, New Jersey was back to where it had been in the early 1990s, with school spending becoming essentially flat once again. In recent years, the state’s movement towards fully funding SFRA has at least prevented further erosion; however, there has only been modest progress toward restoring the level of progressive school funding seen in 2008.

    Figure 7
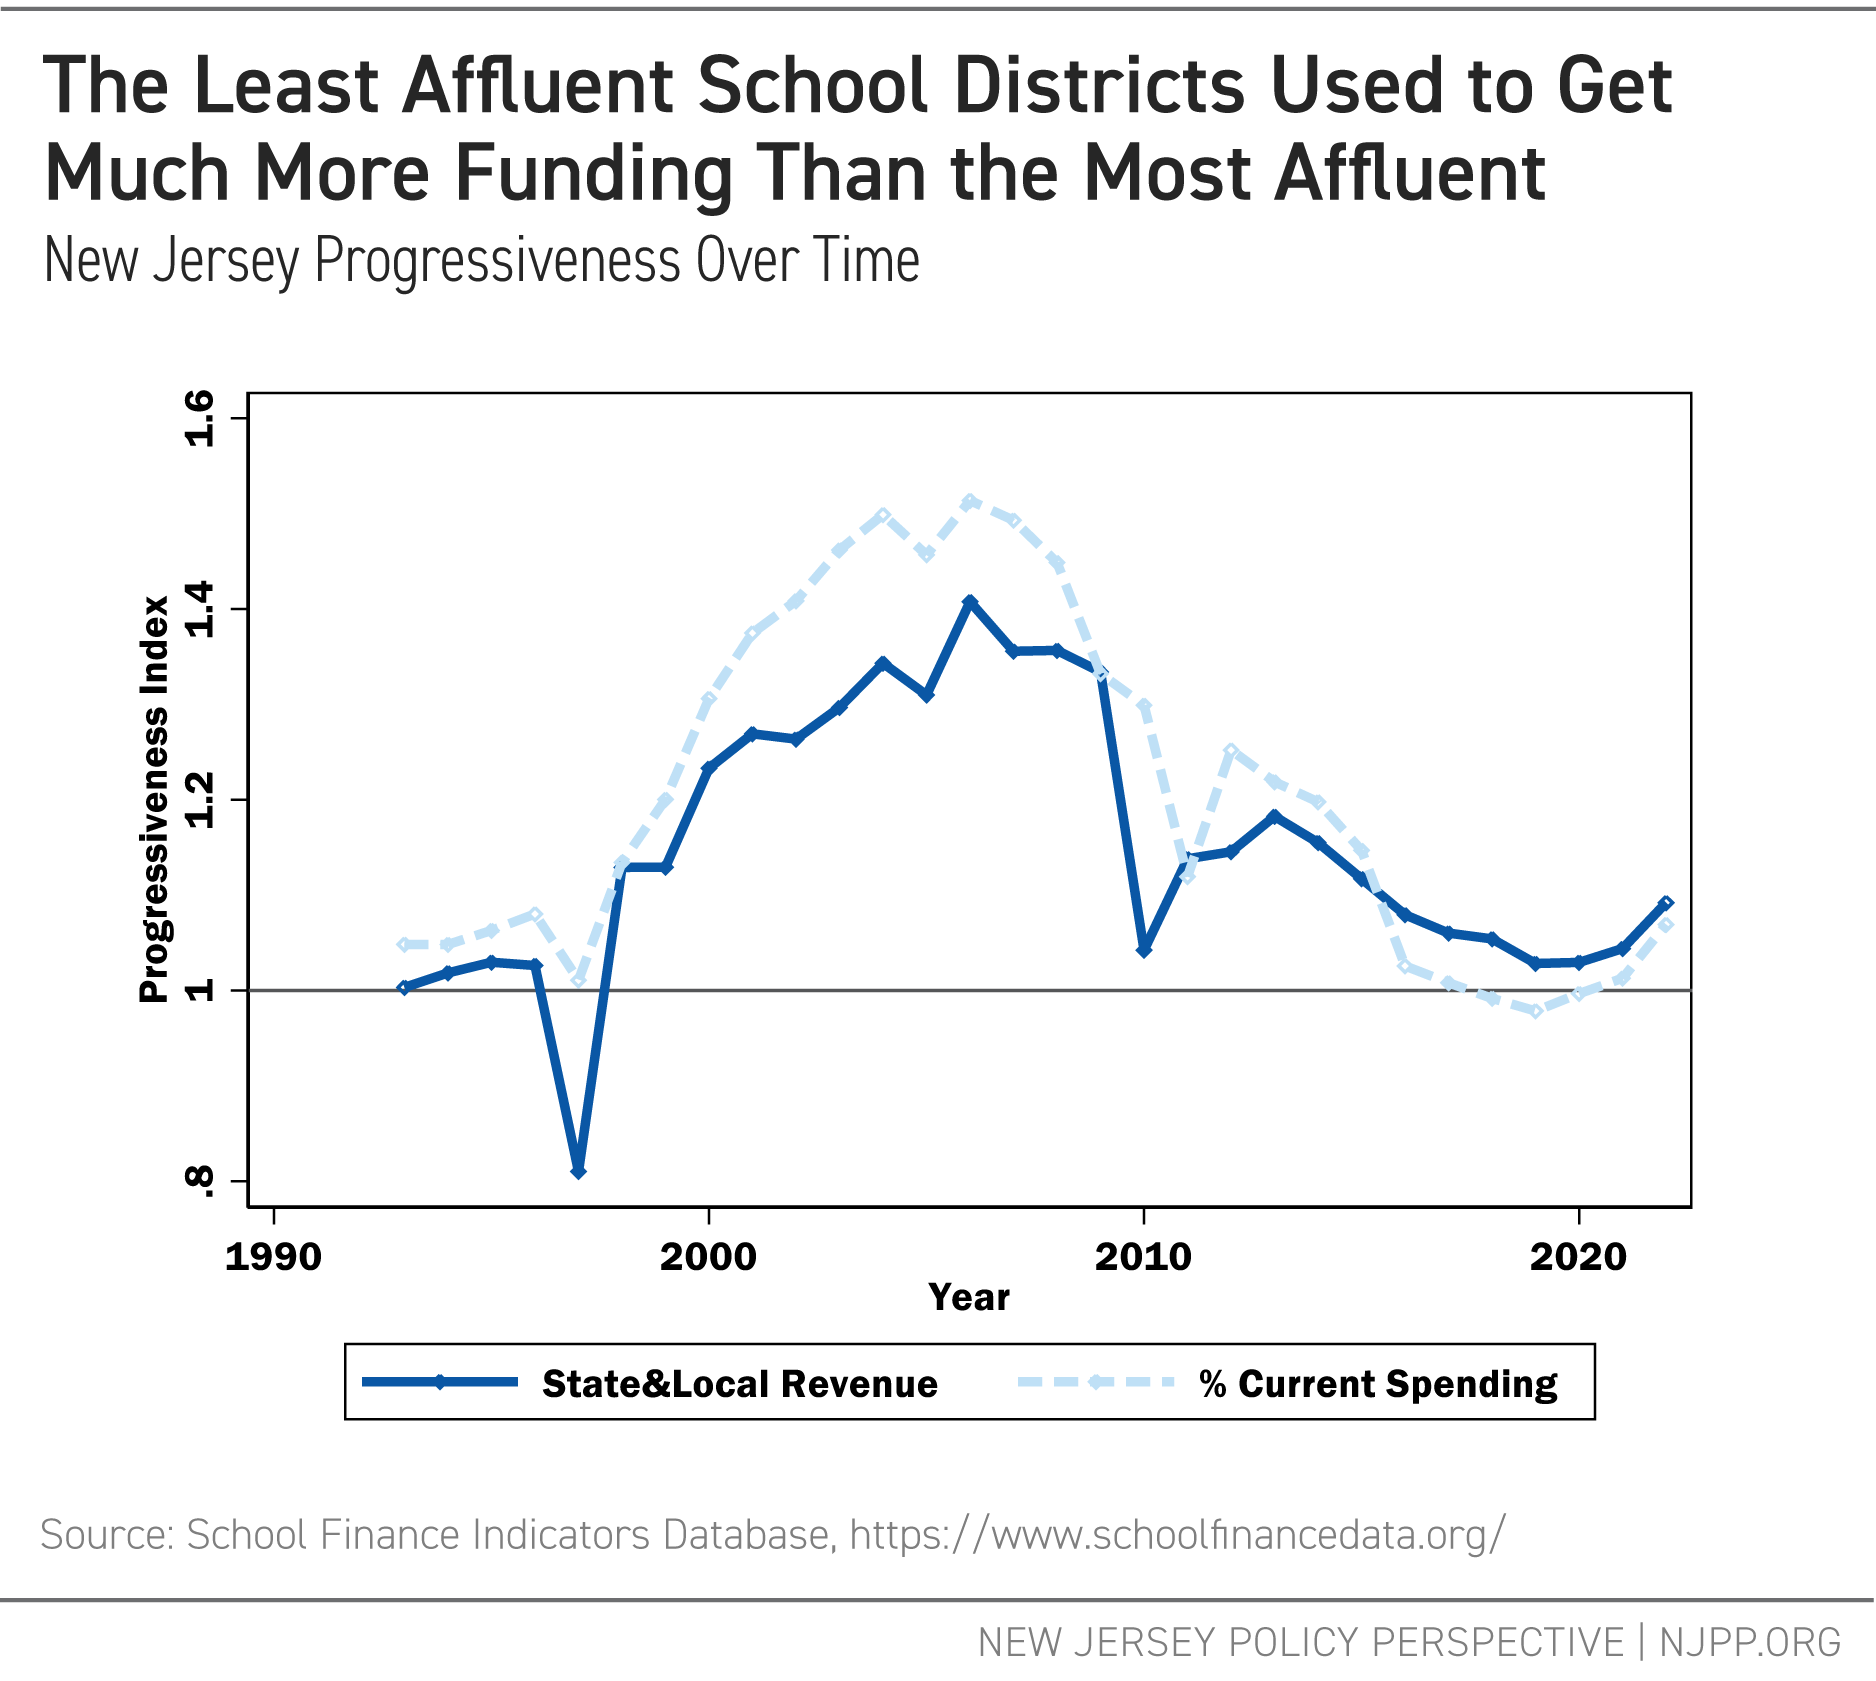
    The Least Affluent School Districts Used to Get Much More Funding Than the Most Affluent

    It’s important to recognize that the erosion of progressivity in New Jersey’s school funding is not solely the result of underfunding SFRA. Under the law, The New Jersey Department of Education is required to prepare an Educational Adequacy Report (EAR) every three years. The EAR is supposed to recalibrate the SFRA formula, adjusting its components to set both appropriate adequacy targets and fair levels of local revenues for schools. However, since the passage of SFRA, the department has either shirked this responsibility (under the Christie administration) or recalibrated the formula without considering factors such as the state’s increasing expectations for student outcomes.[x]

    Appendix B: Setting Adequacy Targets: An Update

    Previous NJPP reports about SFRA focused largely on how to target “adequacy,” which refers to the amount needed for a school district to provide a constitutionally mandated education that allows students to meet the state’s increasingly rigorous standards.[xi] Here, this report gives an update of this work, using current data to calculate the latest version of these adequacy targets. This analysis finds, once again, that school districts with the highest rates of poverty are not spending enough to meet New Jersey’s new, more rigorous standards.

    As described in earlier NJPP reports, SFRA accounts for different student needs through a system where “base amounts” and “weights” are set by the state, resulting in an adequacy target for every school district.[xii] The base amount is the amount of revenue per student a school district needs to educate an elementary school student who is not economically disadvantaged and is not an English Language Learner (ELL). When a district counts its students, each student is “weighted:” students who are economically disadvantaged, ELLs, or in upper grades add more to the weighted student count. That count is multiplied by the base to set the district’s adequacy target. While there are other factors accounted for in SFRA, the base and the weights are at the heart of the law’s adequacy formula.

    For SFRA to validly determine how much each New Jersey school district needs, its base amount and weights need to be set correctly. The base weight must reflect the true cost of educating an elementary student so they can achieve the goals the state has set. Likewise, the weights must reflect the additional cost of educating an economically disadvantaged, ELL, or upper-grade student. If the base and weights are wrong, a district will not have the revenues it needs to be able to achieve its outcome goals. The Education Adequacy Report (EAR), which is supposed to update the SFRA base and weights every three years, is, therefore, critically important: it must set the base and weights correctly for schools to receive the funding to be successful.

    As noted in previous work, New Jersey has raised its outcome goals for students over the past two decades, but has failed to change its school funding formula to align with these new goals.[xiii] To measure the extent of the problem, previous reports from NJPP have used the National Education Cost Model (NECM).[xiv] Grounded in actual data and time-tested empirical methods, the NECM gives a valid, reasonable estimate of the cost of students achieving, on average, a particular educational outcome. What follows here are the latest NECM cost estimates; see the table at the end of this appendix for model specifications and estimates.

    Figure 8 shows the average current spending, SFRA adequacy budget, and NECM-predicted costs by school district poverty quintile from lowest poverty to highest. Regarding existing per pupil spending (the grey bars), the average is just over $20,000, regardless of whether a district is very low in child poverty concentration or much higher. Like in the early 1990s (see Figure 7 above), spending per pupil is currently flat in New Jersey with respect to poverty, despite the presence of a poverty weighting factor in SFRA.

    The lighter blue bars represent what SFRA would provide as an “adequacy budget” for each group. Adequacy budgets for low-poverty districts are just over $15,000 per pupil; for high-poverty districts, just over $20,000 per pupil. SFRA is, therefore, somewhat progressive; however, that progressivity is offset by local choices in affluent districts to spend above that level. The fact that low-poverty districts choose to spend much more than their SFRA adequacy targets suggests that those targets are well below what New Jersey residents want for the education of their communities’ children.

    Figure 8
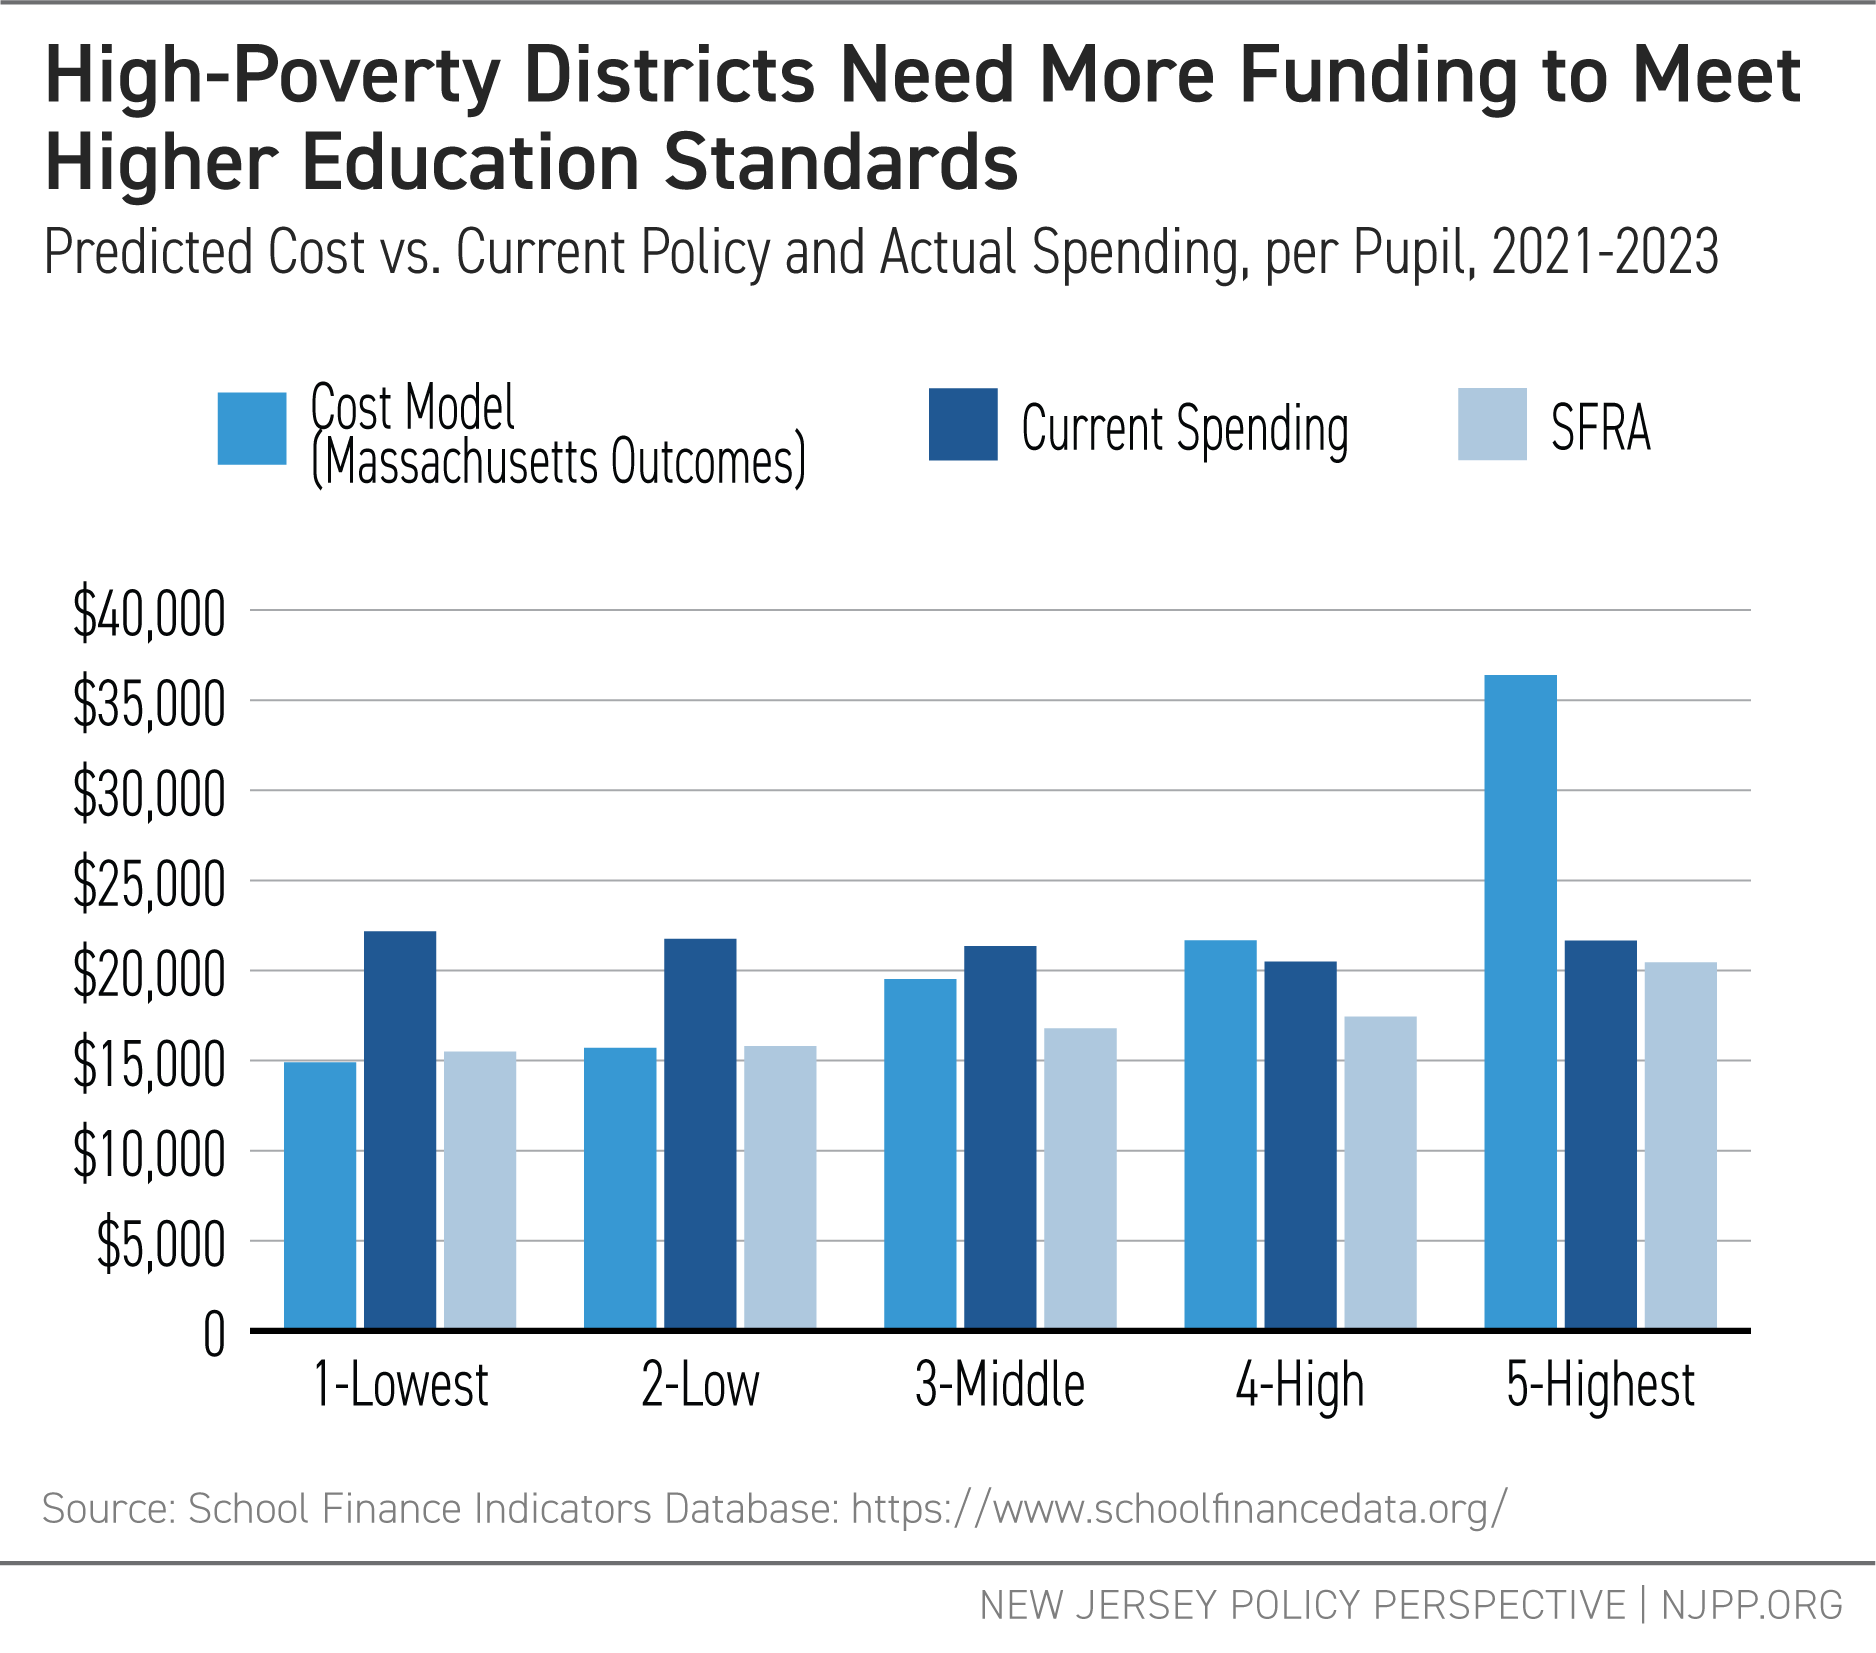
    High-Poverty Districts Need More Funding to Meet Higher Education Standards

    The medium blue bars estimate the per pupil cost — predicted from the NECM — to achieve reading and math outcomes equivalent to the Massachusetts average, which is slightly higher than the New Jersey average, and, as discussed in our previous reports, on track with college and career readiness.[xv] New Jersey school districts with low to moderate levels of poverty currently spend at or above what they’d need to achieve these outcomes (and most of these districts achieve these outcomes). SFRA, however, provides sufficient adequacy budgets only for the state’s more affluent districts.

    In contrast, the highest poverty districts continue to show a large gap between what the NECM says they should spend and what they actually do spend. Worse, the gap between what NECM says districts should spend and their SFRA targets is even larger; in other words, SFRA adequacy targets for high-poverty districts are well below where they should be to meet the goals the state has set. As reported in the past, these analyses suggest the poverty weights in SFRA are too low to meet the state’s current, more rigorous standards.[xvi] Properly recalibrating SFRA will require bringing these weights up, using current data and modern costing methods to set valid targets.

    National Education Cost Model vs. Current Spending and SFRA Targets
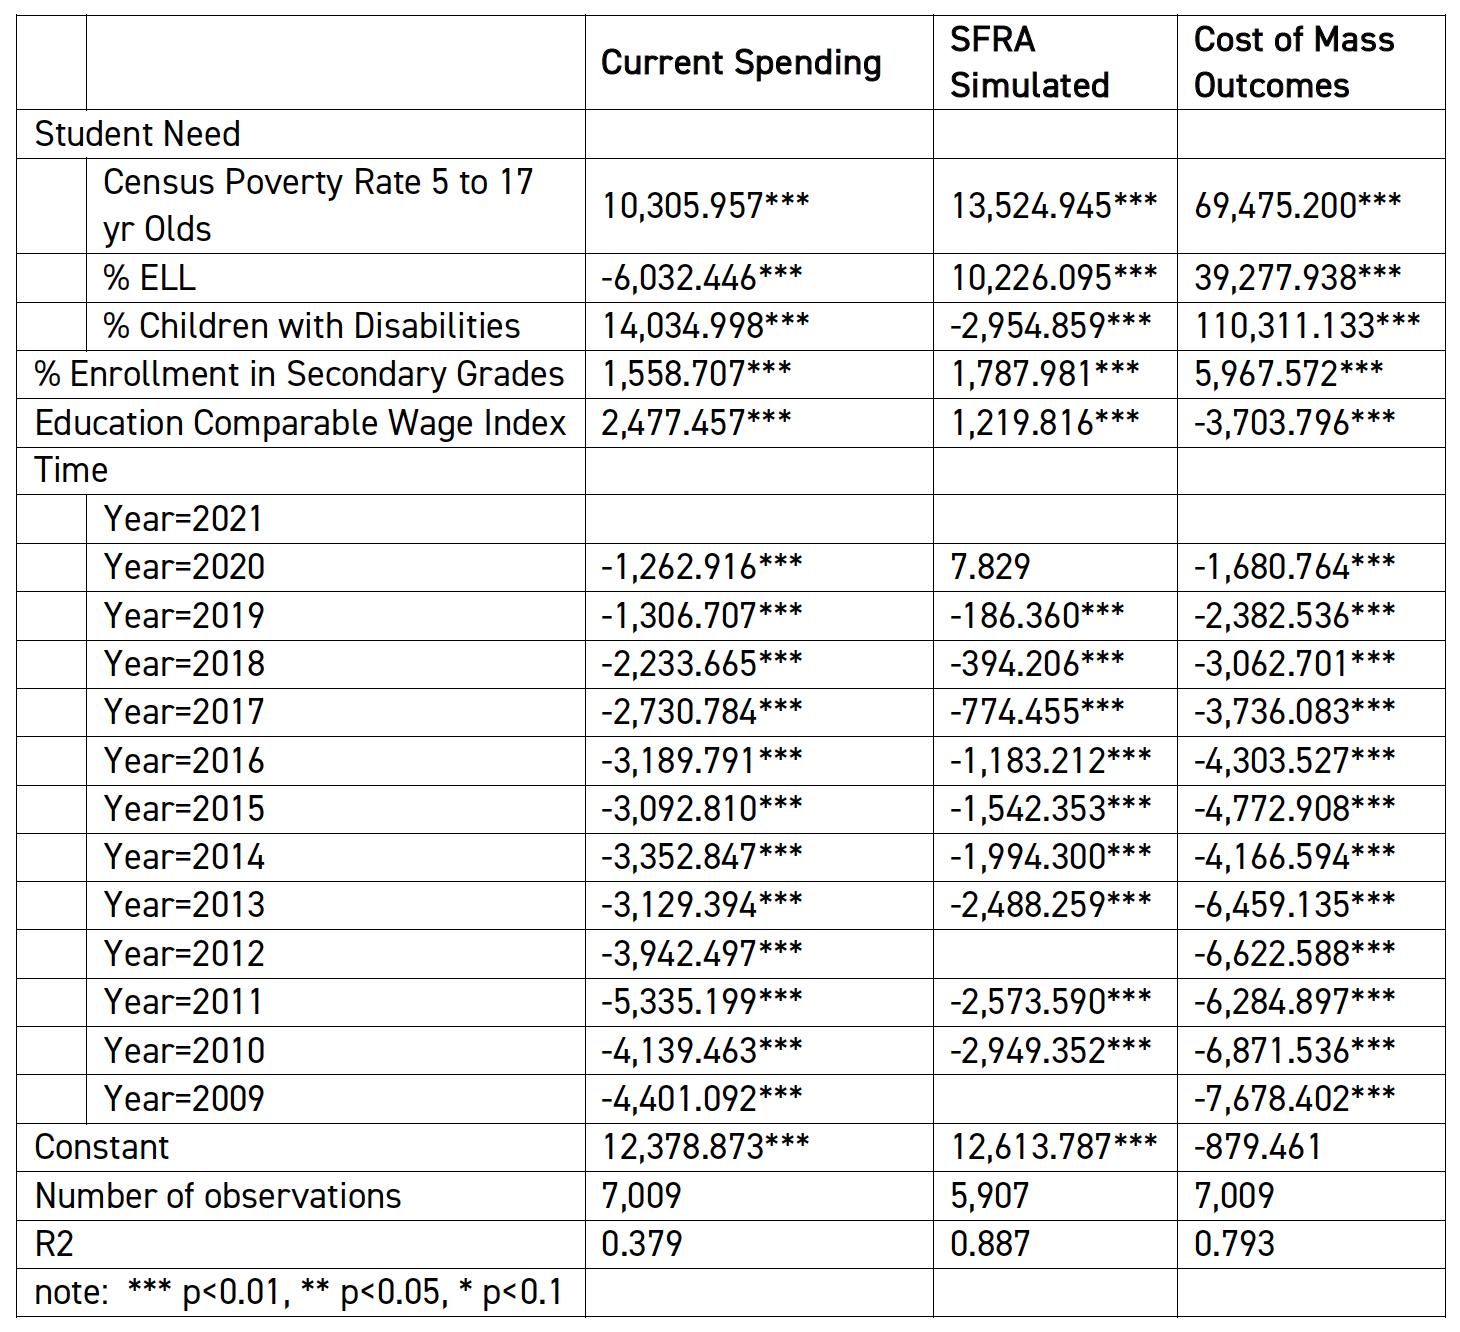
    Appendix C: Sources of Revenues

    In New Jersey, as in many other states, state and local revenues are collected through different types of taxes. The table below lays out the features of the three main revenue sources for the state: property taxes, sales taxes, and income taxes.

    Property taxes are collected primarily at the local level, although sometimes not directly by the school district but by the parent government (city or town), which in turn allocates the revenue to local schools. As illustrated above, property taxes are highly inequitable across localities, meaning that affluent communities often have lower tax rates than those with less property wealth. However, property taxes are also relatively stable in terms of the revenue they generate, making them particularly attractive to school districts because they provide consistent funding regardless of economic fluctuations.

    While property taxes can be regressive, they tend to be less so, on average, than sales taxes. Sales taxes are primarily state source taxes but increasingly include local option sales taxes, which in some states make up a substantial share of local revenues. Sales tax revenues are moderately volatile but less so than income tax revenues.

    Table 4 summarizes the advantages and disadvantages of different sources of tax revenues. Because each type of tax has its own trade-offs between property, sales, and income taxes, state tax systems tend to rely on some combination of all three.

    Table 4: The Pros and Cons of Different Tax Revenue Sources
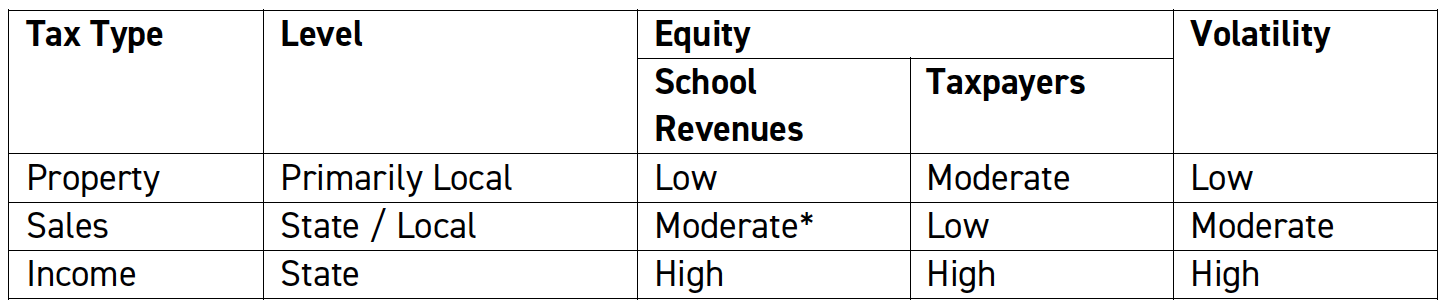
    *Increased use of Local Option Sales taxes

    Appendix D: New Jersey’s Tax Effort

    School finance researchers often describe the level of state and local funding in terms of effort: the percentage of a state’ or locality’s tax capacity that is spent on schooling. When calculating a state’s effort, tax capacity is often measured as the total personal income for the state; the percentage of that income spent on schools is its effort.

    Figure 9 shows the effort of all 50 states to fund schools from 1997 to 2021 with New Jersey highlighted. From 2000 to 2005, New Jersey dramatically increased its effort, coinciding with the targeting of substantial funding to higher-need districts following the Abbott decisions. But like nearly every other state, New Jersey decreased its effort toward funding K-12 education following the Great Recession of 2008—2009. Had New Jersey simply maintained its effort level from 2006 — in other words, made the policy choice to continue spending the same percentage of its economy on K-12 schooling each year — revenue could have been up to 14.3% higher, on average, from 2016 to 2021.[xvii] 

    Figure 9
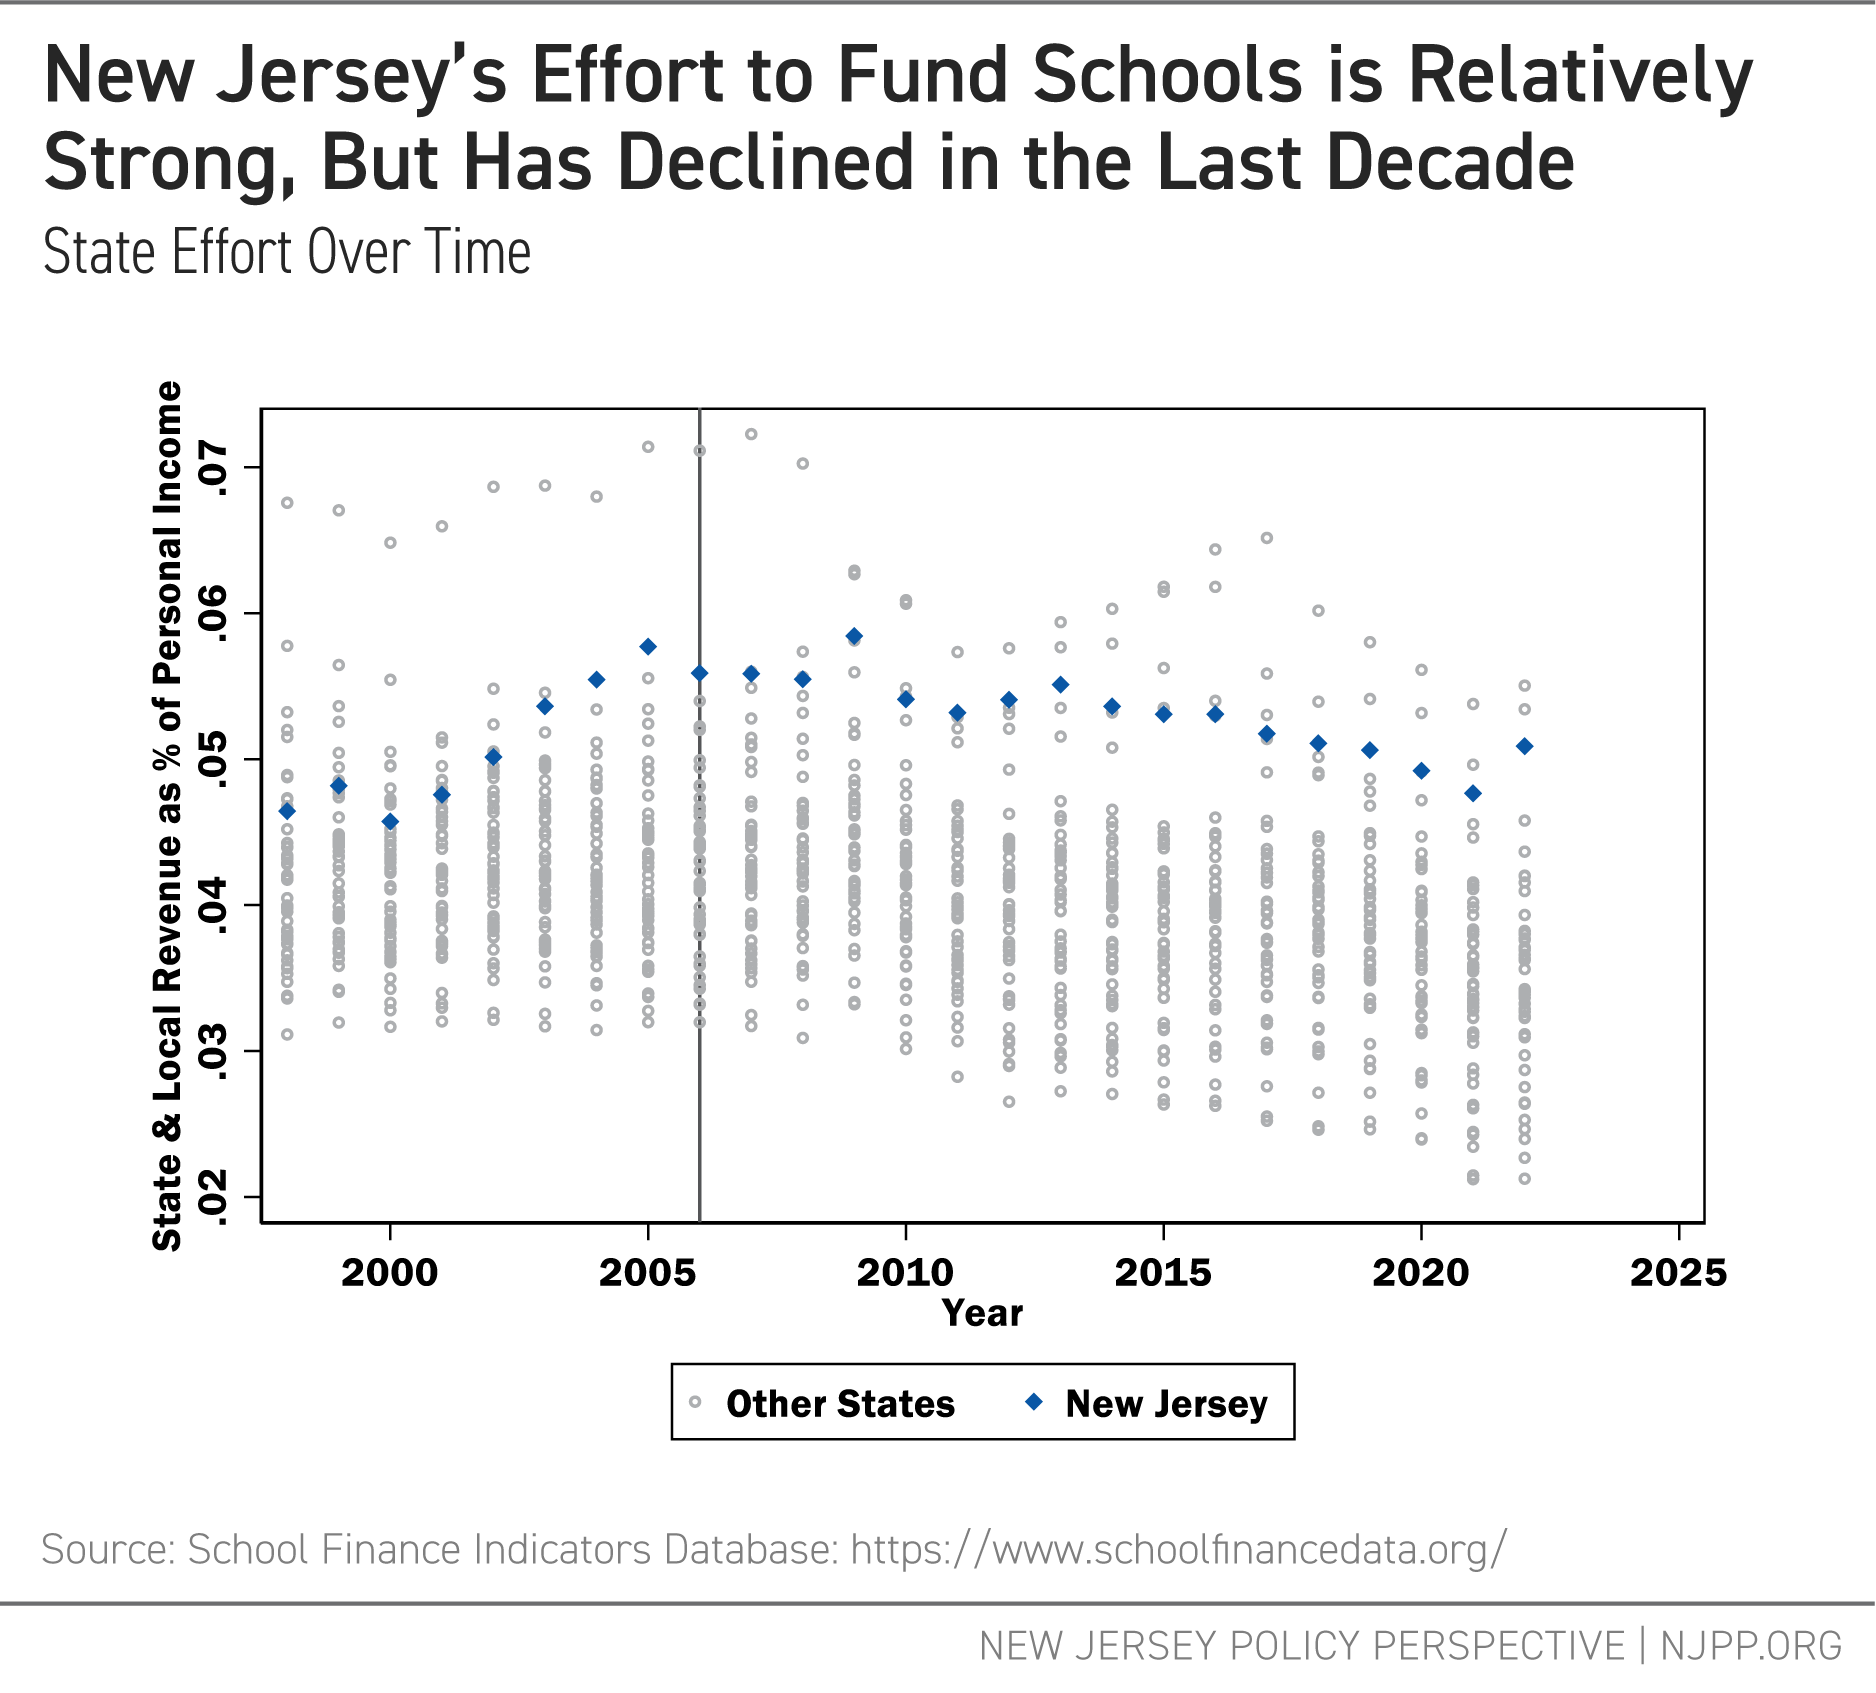
    New Jersey's Effort to Fund Schools is Relatively Strong, But Has Declined in the Last Decade

    While Figure 9 shows K-12 education revenues as a share of income, Figure 10, below, compares total state and local taxes as a share of income for New Jersey among other states. Although taxes in New Jersey are higher than in many other states, the state is not an extreme outlier, with several other states collecting higher amounts proportionally. Notably, New Jersey ranks somewhat lower on total state and local taxes as a share of income than it does on K-12 effort. In addition, and like K-12 effort, total taxes as a share of income have declined since their pre-recession peak. These analyses suggest that while New Jersey makes a relatively strong effort to fund its public schools, there remains room for improvement.

    Figure 10
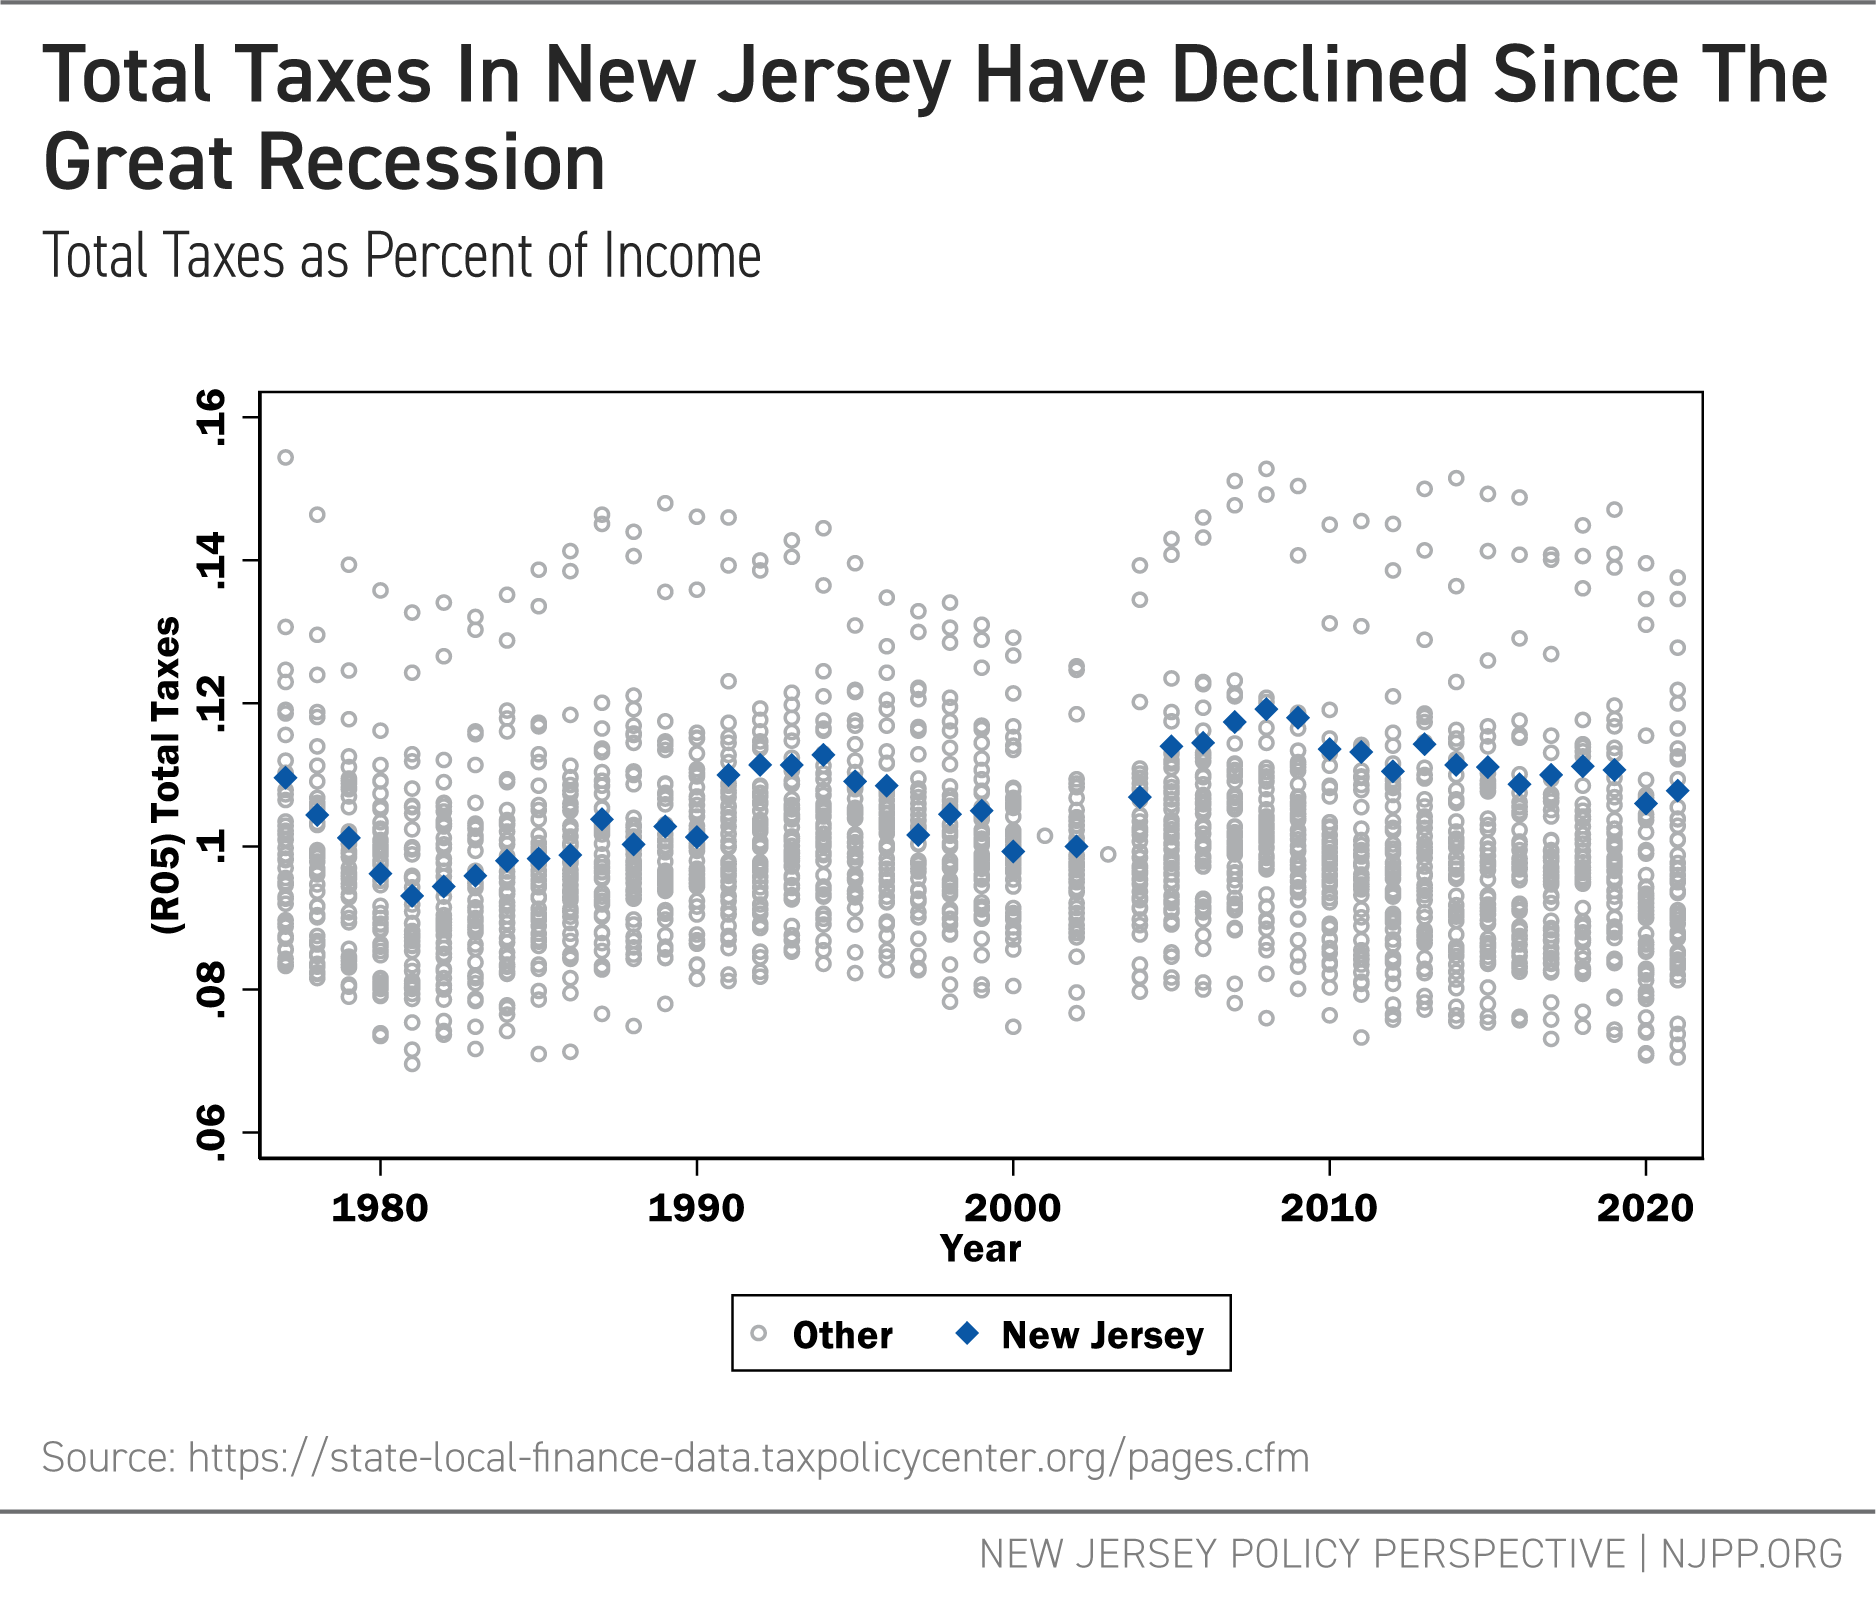
    Total Taxes in New Jersey Have Declined Since the Great Recession

    Appendix E: Local Fair Share, Effective Tax Rates (School and Total), and Local Revenue per pupil Models
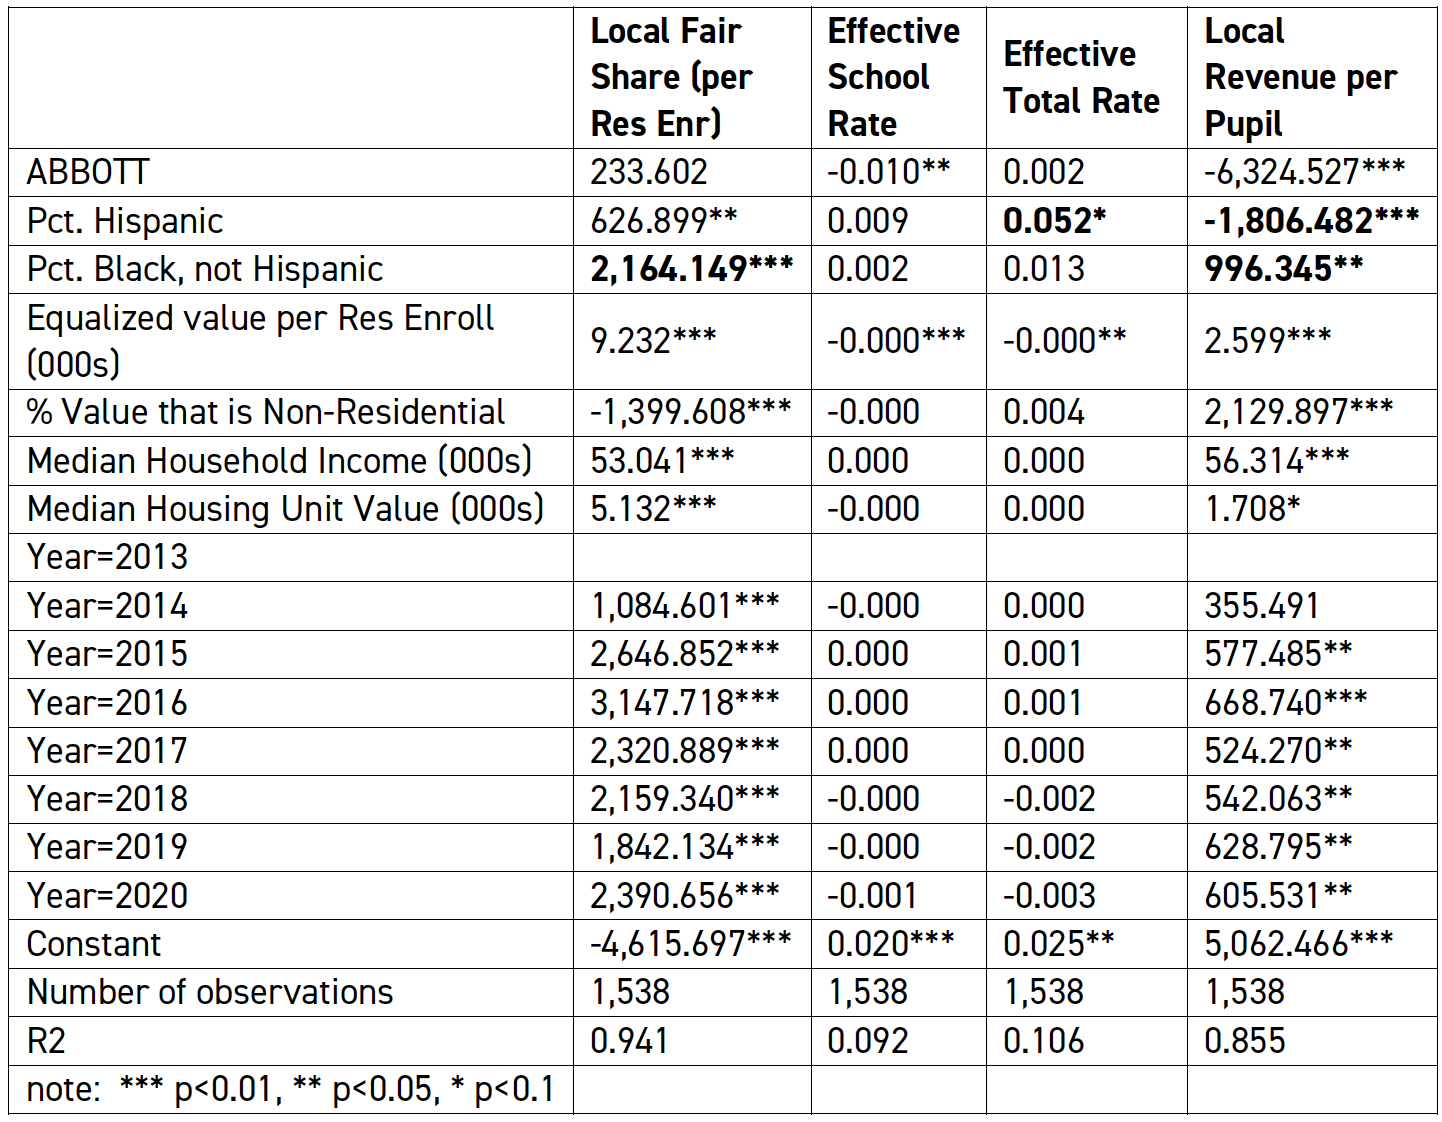


    End Notes

    [i] Duncombe, W. D., & Yinger, J. (2005). How much more does a disadvantaged student cost? Economics of Education Review, 24(5), 513–532.

    Baker, B. D., Weber, M., & Srikanth, A. (2021). Informing Federal School Finance Policy with Empirical Evidence. Journal of Education Finance, 47(1), 1–25.

    Jackson, C. K., & Mackevicius, C. L. (2024). What Impacts Can We Expect from School Spending Policy? Evidence from Evaluations in the United States. American Economic Journal: Applied Economics, 16(1), 412–446. https://doi.org/10.1257/app.20220279

    [ii] Augenblick, Palaich and Associates. (2011). Analysis of New Jersey’s Census-Based Special Education Funding System. http://nj.gov/education/sff/sereport.pdf

    [iii] Baker, B.D. and Weber, M.A. (2023) Unlocking Academic Success: Revitalizing New Jersey’s School Funding Formula for Student Achievement. New Jersey Policy Perspective. https://www.njpp.org/publications/report/unlocking-academic-success-revitalizing-new-jerseys-school-funding-formula-for-student-achievement/

    [iv] New Jersey Department of Education, Title I, Part A, Supplement Not Supplant Guidance  https://www.nj.gov/education/title1/resources/docs/TitleISupplementnotSupplantGuidanceDocument.pdf

    [v] “Median household income” is a different measure than what is used for SFRA’s formula: SFRA totals the district’s residents’ income and multiplies it by the rate. We use median income here as it better approximates the relationship between local share and the “typical” household income for a district.

    [vi] “Local Fair Share ratio” is the calculated LFS amount of revenues from local sources vs. the amount from state sources. An LFS ratio of 1 (1:1) means the calculated LFS is equal to the amount from state sources; an LFS ratio of 0.5 (1:2) means the calculated LFS is equal to one-half of the amount from state sources. As tax capacity rises, the LFS ratio will also rise; for example, districts with a LFS of 2 will have greater property wealth and income—and, consequently, tax capacity—than districts with an LFS of 0.5.

    [vii] Baker, B.D. and Weber, M.A. (2022) Separate and Unequal: Racial and Ethnic Segregation and the Case for School Funding Reparations in New Jersey. New Jersey Policy Perspective. https://www.njpp.org/publications/report/separate-and-unequal-racial-and-ethnic-segregation-and-the-case-for-school-funding-reparations-in-new-jersey/

    [viii] Brent, B. O. (1999). An analysis of the influence of regional nonresidential expanded tax base approaches to school finance on measures of student and taxpayer equity. Journal of Education Finance, 24(3), 353-378.

    Ladd, H. F., & Harris, E. W. (1995). Statewide taxation of nonresidential property for education. Journal of Education Finance, 21(1), 103-122.

    Ladd, H. F. (1976). State-wide taxation of commercial and industrial property for education. National Tax Journal, 29(2), 143-153.

    [ix] See Footnote #1.

    [x] Baker, B.D. and Weber, M.A. (2022) New Jersey School Funding: The Higher the Goals, the Higher the Costs. New Jersey Policy Perspective. https://www.njpp.org/publications/report/new-jersey-school-funding-the-higher-the-goals-the-higher-the-costs/

    [xi] Baker, B.D. and Weber, M.A. (2023) Unlocking Academic Success: Revitalizing New Jersey’s School Funding Formula for Student Achievement. New Jersey Policy Perspective. https://www.njpp.org/publications/report/unlocking-academic-success-revitalizing-new-jerseys-school-funding-formula-for-student-achievement/

    [xii] Baker, B.D. and Weber, M.A. (2020) School Funding in New Jersey: A Fair Future for All. New Jersey Policy Perspective. https://www.njpp.org/publications/report/school-funding-in-new-jersey-a-fair-future-for-all/

    [xiii] Baker, B.D. and Weber, M.A. (2023) Unlocking Academic Success: Revitalizing New Jersey’s School Funding Formula for Student Achievement. New Jersey Policy Perspective. https://www.njpp.org/publications/report/unlocking-academic-success-revitalizing-new-jerseys-school-funding-formula-for-student-achievement/

    [xiv] Baker, B. D., Weber, M., & Srikanth, A. (2021). Informing Federal School Finance Policy with Empirical Evidence. Journal of Education Finance, 47(1), 1–25.

    [xv] Baker, B.D. and Weber, M.A. (2022) New Jersey School Funding: The Higher the Goals, the Higher the Costs. New Jersey Policy Perspective. https://www.njpp.org/publications/report/new-jersey-school-funding-the-higher-the-goals-the-higher-the-costs/

    [xvi] Baker, B.D. and Weber, M.A. (2023) Unlocking Academic Success: Revitalizing New Jersey’s School Funding Formula for Student Achievement. New Jersey Policy Perspective. https://www.njpp.org/publications/report/unlocking-academic-success-revitalizing-new-jerseys-school-funding-formula-for-student-achievement/

    [xvii] School Finance Indicators Database, State School Finance Profile, New Jersey, 2020-21 School Year https://www.schoolfinancedata.org/wp-content/uploads/2024/01/profiles24_NJ.pdf

    No Matter What You Call Them, Private School Vouchers Are Bad for New Jersey

    New Jersey’s public schools are among the strongest in the nation, a direct result of robust state funding that supports districts and students in every corner of the state. This investment in public schools is now threatened by a sweeping new bill that would establish the first-ever school voucher program in New Jersey, providing tens of millions of dollars in public funds to students attending private schools.[1]

    The bill text is careful not to include the word “voucher,” a tactic recommended by anti-public school organizations like the Cato Institute.[2] Instead, the bill uses coded terms like “scholarships” and “tax credits,” but the ultimate outcomes remain the same. With an annual cost of $37.5 million, this proposal would funnel scarce public dollars to unaccountable private schools, harming students, taxpayers, and the future of public education in New Jersey.

    New Jersey Cannot Afford School Vouchers, “Tax Credits,” or “Scholarships”

    The proposed bill would grant tax credits to corporate and individual taxpayers who make contributions to “student support organizations.” After collecting their administrative fees, these groups would redistribute the funds to private school families. Proponents argue this is different than private school vouchers, which give state funds directly to parents or schools. But that’s a distinction without a difference.

    Every public dollar in tax credits for private school scholarships is a dollar that has to be made up somewhere else, either in cuts to public programs or in higher taxes.[3] Given the state’s current fiscal situation, the last thing New Jersey needs right now is a multi-million-dollar giveaway to private schools.

    In other states, wealthy individuals and businesses have used similar tax credit schemes to reduce their tax liability by more than the amount of their donation, essentially making money on private school vouchers.[4] The New Jersey bill, as proposed, would create incentives to do the same.

    It’s worth noting that in other states, voucher programs started small, but grew enormously in a short time. Arizona’s voucher program, for example, totaled $57 million in 2012 and ballooned to $218 million by 2022.[5] It’s telling that the original version of the New Jersey bill set the total cost at $250 million; if it passes, it wouldn’t at all be surprising to see the bill reach this extremely high cost in the near future.

    Most Funding Would Benefit Those Already Enrolled in Private School

    The bill sets the income threshold for a family of five at $176,000 — nearly twice the median household income[6] — meaning families that can afford private schools on their own will now take money from the rest of the state’s taxpayers to subsidize their children’s private school education.[7]

    Some argue voucher programs do not cost states school funding because the state doesn’t have to pay to educate students who would otherwise attend public school. This logic fails, however, up against the fact that large numbers of private school students wouldn’t attend public school under any circumstances. More than half of New Jersey’s private schools students, for example, attend religious schools; it is reasonable to assume many of their parents would always choose a religious education for them, no matter the availability of private school vouchers.[8]

    In fact, data from other states confirm that similar programs subsidize large numbers of private school families whose children never attended public schools. In Florida, for example, 69 percent of students who enrolled in the state’s voucher scholarship program for the first time were already attending private schools.[9] Similarly, two-thirds of Iowa’s voucher students were already enrolled in private schools.[10] Other states have similar figures.[11]

    New Jersey Already Gives Extensive Support to Private Schools

    By law, New Jersey’s school districts must provide funding to private schools for textbooks, handicap services, nursing, technology, and other programs and services.[12] According to state data, public schools transferred nearly $80 million to private schools in the 2021-22 school year.[13] There is no public audit available showing how, exactly, this money was spent.

    In addition, public schools must provide transportation to resident children attending private schools within a 20-mile radius.[14] How much this costs taxpayers is unclear; state data does not separate out transportation costs between public and private school students, further highlighting the state’s lack of oversight for its current private school subsidies.

    The current bill doesn’t rescind this private school support; instead, it piles even more subsidies on top of an unfunded mandate, pulling even more money from public schools.

    Private Schools Lack Oversight and Are Allowed to Discriminate

    Despite receiving public funds, New Jersey’s private schools have little to no accountability to the state’s taxpayers. Private school students do not take state tests, so there is no way to determine if they are receiving an adequate education. Unlike public schools, the state doesn’t have a true monitoring and accountability system in place for private schools.[15]

    Privatization advocates will often argue that parental “choice” is the only accountability taxpayers need. This is, of course, absurd. If taxpayers are going to foot the bill for private school education, they deserve a real oversight system to protect their interests. Such a system, however, requires significant resources — funding that could be used to improve public schools, which are open to all students.

    The current bill has no provision for private schools to change their admissions policies, meaning schools receiving taxpayer funds could systematically exclude students with learning disabilities or students who are English Language Learners, concentrating these students — whose costs are greater — into public schools. As is the case in other states, religious schools that discriminate against LGBTQ+ students would also be eligible for public funding.[16]

    Voucher Programs Lead to Worse Student Outcomes

    Proponents of private school vouchers used to claim that private schools get better academic outcomes than public schools. Their claims were based on decades-old, small-scale studies that inadequately controlled for differences in student characteristics.

    As researchers at the University of Indiana point out, more recent studies with better methods paint a very different picture.[17] States that have implemented large-scale private school voucher systems have seen dramatic declines in student outcomes. In some studies, the effects have been larger than estimates of the learning loss from the COVID-19 pandemic.[18]

    There Are Better Ways to Support Students

     Public school leaders across New Jersey have begged the Legislature to revise the state’s school funding formula, which has been shown to be inadequate in meeting the current needs of students.[19] Implementing a new scheme for funding private schools takes time and attention away from this important work. It also diverts funds away from public schools and toward private schools, which have no meaningful oversight and can pick and choose who they admit.

    New Jersey’s students deserve better. The Legislature should drop this bill and get back to the work of ensuring that every student can attend a well-resourced public school.


    End Notes

    [1] https://www.njleg.state.nj.us/bill-search/2024/S3035

    [2] https://www.cato.org/education-wiki/scholarship-tax-credits-vouchers

    [3] https://networkforpubliceducation.org/wp-content/uploads/2019/01/Are-tax-credits-scholarships-a-voucher-by-a-different-nameƒ.pdf

    [4] https://itep.org/tax-avoidance-fuels-school-vouchers-privatization-efforts/

    [5] https://azdor.gov/sites/default/files/2023-05/REPORTS_CREDITS_2023_fy2022-private-school-tuition-org-credit-report.pdf

    [6] https://data.census.gov/all?q=New+Jersey+Income+and+Poverty

    [7] https://www.federalregister.gov/documents/2024/02/20/2024-03355/child-nutrition-programs-income-eligibility-guidelines#p-15

    [8] https://nces.ed.gov/surveys/pss/

    [9] https://www.wmfe.org/education/2023-09-14/florida-policy-institute-school-voucher-data-step-up-for-students

    [10] https://educate.iowa.gov/press-release/2024-01-26/certified-enrollment-2023-24-holds-steady-16757-esa-participants-enrolled-iowa-accredited-nonpublic

    [11] https://www.ncpecoalition.org/voucher-recipients

    [12] https://www.nj.gov/education/nonpublic/

    [13] https://www.nj.gov/education/finance/fp/ufb/

    [14] https://www.nj.gov/education/genfo/faq/faq_transportation.shtml

    [15] https://www.nj.gov/education/qsac/

    [16] https://www.orlandosentinel.com/2020/01/23/anti-lgbt-florida-schools-getting-school-vouchers/

    [17] https://ceep.indiana.edu/education-policy/policy-briefs/2023/research-on-school-vouchers.pdf

    [18] https://www.brookings.edu/articles/research-on-school-vouchers-suggests-concerns-ahead-for-education-savings-accounts/

    [19] https://www.njpp.org/publications/report/unlocking-academic-success-revitalizing-new-jerseys-school-funding-formula-for-student-achievement/

    Unlocking Academic Success: Revitalizing New Jersey’s School Funding Formula for Student Achievement

    All students, regardless of their background, should have access to a high-quality education to help them reach their full potential. In the past few years, New Jersey has moved steadily toward fully funding its schools through the 2008 School Funding Reform Act (SFRA), the state’s school finance law. This landmark legislation requires funding alignment with student outcomes.

    Since SFRA was enacted in 2009, however, New Jersey has raised student achievement expectations: state exams are more rigorous, and students are expected to meet higher standards. While there have been small changes in SFRA funding targets since its inception, the current law does not provide all the resources students need to reach these new standards because it is still aligned with outdated learning goals.

    The state can fine-tune the formula by making small but significant tweaks. Specifically, the state can adjust the funding needed to adequately educate a student, which is called the base student amount, and align that with the additional costs for students who need extra help, like special education students, English language learners (ELL), and more, which are called weights for student characteristics. Other states have recently used updated and improved data and methods, and New Jersey can do the same.

    History has shown — and we have documented in previous work — that systemic, institutional racism has fostered the segregative trends that led to the current concentration of low property values and high student need in many of New Jersey’s towns and cities.[1] Properly adjusting SFRA is, therefore, a matter of both racial justice and educational adequacy. This report explores what it means to fund our schools adequately and meet the constitutionality of SFRA, explains the school funding formula, and offers recommendations to fine-tune SFRA to ensure its constitutionality and that it better supports today’s students and their futures.

    What is “Adequate” School Funding?

    Research conclusively shows that school funding has a significant effect on student success.[2] At the same time, research also shows that different communities require different funding levels to provide equal educational opportunities for their students. But how much funding should be given to each district based on the unique needs of their student populations? Adequacy refers to the level of funding needed for a specific population of students to achieve a specific educational outcome. A school district with adequate funding has the resources to provide an education that allows its students to meet a specific goal: an average test score, a particular graduation rate, or some other measurable outcome.

    Adequacy considers the characteristics of a school district’s students that affect their abilities to achieve learning outcomes. For instance, adequacy acknowledges that more revenue is needed when student poverty is more highly concentrated, or students have greater educational needs. Adequacy also accounts for differences in labor markets and other factors that drive up district costs to staff their schools properly. Finally, adequacy considers the rigor of the educational outcomes that students are expected to achieve. Put simply, meeting higher standards costs more than meeting lower standards.

    Exactly how school funding positively affects outcomes continues to be studied; however, researchers have found compelling evidence that reductions in class size, more support and instructional staff, early childhood education, increases in instructional time, and more competitive wages for school staff benefit students.[3] All of these reforms are made possible when school funding is adequate and equitable.

    New Jersey’s Constitutional Mandate for Adequately Funded Schools

    The New Jersey Constitution requires that the Legislature “…provide for the maintenance and support of a thorough and efficient system of free public schools….” However, in a series of lawsuits throughout the last 50 years, including the Abbott decisions, the state Supreme Court found that the Legislature was still not meeting its obligations and demanded increased school funding. [4] In this context, the School Funding Reform Act of 2008 was enacted, a public education finance formula connecting school funding to the state’s broader adoption of academic content standards and performance assessments.

    Even when the law passed — as pointed out in previous reports — the outcome standards and cost estimates used to set adequacy levels in SFRA were already several years old. [5] The general tone of the court suggested that SFRA looked like a reasonable effort to meet the standard it had laid out a decade earlier and that SFRA could be implemented — but only with certain conditions attached.

    The court held:

    To the extent that the record permitted in this review, SFRA is constitutional and may be applied in Abbott districts subject to the State continuing to provide school funding aid during this and the next two years at the levels required by SFRA’s formula each year, and subject further to the mandated review and retooling of the formula’s weights and other operative parts after three years of implementation.

    – Abbott XX, 199 N.J. 140, May 2009. Emphasis ours.

    In addition to the law requiring that the SFRA formula must be reviewed and, if necessary, recalibrated every three years, the court found SFRA is also only constitutional if it is fully funded. The court reaffirmed this point when funds were cut from Abbott districts in 2011.[6] Under the Murphy administration, the Legislature has moved closer to fully funding the current formula; this is an important step forward. However, SFRA must also be aligned with current standards and student outcome goals to remain constitutional.

    Understanding the School Funding Formula (SFRA)

    While it is well understood that schools need adequate funding, setting adequacy levels is a complex task. New Jersey’s School Funding Reform Act (SFRA) outlines a formula to set adequacy levels for all school districts. As noted in previous work, the SFRA formula needs updating to be constitutional and fix the significant underestimation of the adequacy level for many school districts.[7]

    Fortunately, lawmakers don’t need to start from scratch; they need only follow the law and reset a few key components in the formula to ensure that all schools and their students receive adequate funding. But, to understand how the SFRA formula can be adjusted, we must first understand how it works. The formula uses a “weighted student enrollment” method that can be simplified into three basic steps:

    Step 1: Set the “Base Amount”

    In theory, the base amount determines the funding needed to adequately educate students in Grades 1 through 5, assuming they are not economically disadvantaged and speak English as their native language. If a school district only had these students and received the base amount per pupil — currently $12,451, as shown in the table below — it would, according to the SFRA formula, have the resources it needs to achieve the educational goals the state has set.

    Step 2: Determine the “Weighted Student Enrollment”

    The SFRA formula does more than count the number of students in a school district; it also tracks important student characteristics that increase costs, “weighting” students with those characteristics more heavily. For example, elementary school students are considered the baseline, and each are counted as 1.00 student, absent of all other factors. For every student who does not speak English as their native language — Limited English Proficient (LEP) — an additional 0.5 for each LEP student is counted in the weighted enrollment count. Also, students in poverty (as measured by their eligibility for free or reduced-price lunch) are weighted between 1.47 and 1.57 times more heavily in the enrollment count, depending on the concentration of poverty in their district. Further, high school students are weighted more heavily than elementary students and vocational tech students receive additional weights. The latest weights are listed in the table below.

    Step 3: Multiply the Weighted Student Enrollment by the Base Amount

    The total adequacy budget is the student enrollment, weighted by student characteristics, multiplied by the base amount (and further weighted by geographic cost adjustments).

    To be clear: this is a simplified explanation of only one part of the SFRA formula. Other factors affect the final school aid calculation a district receives from the state, such as special education, categorical aid, local fair share, etc.

    Understanding the steps above yields a key insight: The SFRA formula can be adjusted by changing the base amount and the weights used to determine weighted student enrollment. When the base and the weights are set correctly, the amount a district should spend to provide an adequate education is calculated accurately; when the base and weights are wrong, the adequacy budget calculation is wrong. Getting the base and the weights right is, therefore, critically important for maintaining the constitutionality of SFRA. By law, the base and weights must be adjusted every three years.

    Current SFRA Adequacy: An Update

    A previous NJPP report explains how the outcome standards required of New Jersey’s students over time have changed, becoming more demanding and requiring more intensive instruction.[8] Therefore, the current SFRA formula likely underestimates the funding schools need to achieve adequacy. In 2018, over 100,000 students were in schools that were severely underfunded — more than $5,000 per pupil less than SFRA’s targets. That number has been cut in half in recent years; however, many New Jersey children are still enrolled in underfunded schools as assessed by SFRA’s formula.


    New Jersey’s New, More Rigorous Standards

    To maintain constitutionality, adjustments to the SFRA formula must be linked to learning outcomes, especially if those outcomes have changed — which they have. In a previous report[9], we explained how the outcome standards required of New Jersey’s students over time have become more demanding and, therefore, require more intensive instruction. To illustrate this change, this report uses the best consistent measure for determining a state’s goals for student proficiency: the National Assessment of Education Progress (NAEP)[10], a national test considered the gold standard of student assessment.

    Because the NAEP is designed to be a consistently challenging exam across time, it can compare the relative difficulty of achieving a proficient score on New Jersey’s state tests in different years — even if the tests and their definition of “proficient” change. As the graph below shows, the difficulty of New Jersey’s tests has increased considerably; a score considered “proficient” two decades ago would not be today.

    In 2005, for example, the state’s assessment score on the NJASK, [11] the state’s standardized test, determined proficiency in 4th-grade reading to be statistically equivalent to a 191 NAEP score. This was when funding targets for SFRA were originally adjusted; however, it took another four years before the law was fully enacted. By then the proficiency standard in 4th-grade reading increased to a 221 NAEP-equivalent score.For more context on the state’s increase in school education standards, when the state changed its standardized test from the NJASK to PARCC in 2015,[12] the proficiency equivalent on the NAEP leapt up to 233. In 2019, the state again switched its test to the NJSLA;[13] the standards dropped slightly to a 225 NAEP score, still well above the original 2005 level. Other subjects and grade levels saw similar increases.

    At the time of SFRA’s inception, methods for making these estimates, or “costing out” an adequate education, primarily revolved around making what are best described as educated guesses. Documented here and in previous work,[14] estimates were below what is needed to provide an adequate education, especially for schools serving large proportions of students experiencing economic disadvantage.

    Fine-Tuning the Formula With Evidence

    The SFRA formula can and should be fine-tuned with better data and methods. Recent examples from other states show New Jersey how the school funding formula can be improved to better estimate the costs of an adequate education. This is not only important to meet the needs of New Jersey students but also to comply with the state constitution, which calls for regular updating.

    In the last several years, data collection and methods to analyze those data have improved significantly: policymakers have better access to data on student characteristics, area poverty, wage competitiveness, and other factors that affect educational costs than they had before. Cost estimates based on data analysis have the advantage of being based on actual spending and measurable student outcomes. Other states have taken advantage of these improvements to adjust their formulas and better estimate educational costs. Examples include:

    • Kansas: In 2017, Legislators contracted with independent researchers to estimate an updated cost model based on new outcome standards to revise their weighted foundation aid formula as ordered by the state courts. Kansas had used similar, rigorous statistical methods ahead of other states a decade earlier.[15]
    • Vermont: Legislators contracted the American Institutes for Research (AIR) in collaboration with the University of Vermont to use similar methods to guide reforms of their pupil need weights. While COVID slowed the process, in the spring of 2022, the Vermont legislature and governor adopted reforms to the weighting system guided by those findings.[16]
    • New Hampshire: In 2020, the New Hampshire Commission on School Funding worked with the same researchers to estimate models of the costs to achieve that state’s desired outcome goals but has not yet acted on the report findings.[17] (One of the authors of this brief, Dr. Bruce D. Baker, was part of the teams that performed the Vermont and New Hampshire analyses.)


    Studies like these can be completed in under a year with lower expense and greater validity than other methods that estimate educational costs. They have the additional advantage of being able to be easily updated as new data is collected.

    Adjusting SFRA: An Example

    How might New Jersey use a data-informed approach to adjust SFRA? The state can use a data-informed approach that uses national datasets and modern cost-modeling methods. Over the past several years, for example, the authors of this brief have developed a National Education Cost Model (NECM), which is used in our national reporting on the adequacy and fairness of state school finance systems.[18] The model uses data on over 13,000 school districts per year over a decade to estimate the relationship between existing and past spending, district characteristics, student characteristics, and outcomes in reading and math. The resulting estimations allow us to set appropriate outcome goals and estimate the cost of attaining them for individual school districts.

    We have used this model in earlier NJPP reports to evaluate the adequacy of SFRA concerning the costs of achieving different outcomes on state tests in English and math.[19] Importantly, we arrived at different estimations based on different outcome goals. The cost per pupil is relatively modest if we set a relatively low goal — for example, the national average outcomes on state tests. If we set a higher goal — say, average outcomes for Massachusetts students, the highest in the nation — the cost estimates are higher.

    The table below shows estimates from the NECM with two outcomes goals, compared to a simulation of the SFRA adequacy budget’s funding targets. Standard 1 — the low standard — is the estimated cost of achieving national average outcomes of state tests. Standard 2 is higher: average Massachusetts outcomes. The estimates are broken down into five poverty levels, ranging from low to high.

    If New Jersey were to set a low target for national average test scores, the SFRA, in its current form, would provide more than enough revenue to meet that goal, especially in lower-poverty districts. However, New Jersey is relatively high performing, surpassing national averages. If the state sets the higher goal of meeting Massachusetts’s average outcomes (again, the highest outcomes in the nation), only wealthier districts would have the revenues needed under SFRA to meet that goal. The highest-poverty districts would need more than $7,000 additional dollars per student to achieve this more rigorous standard.

    It’s important to note that we are using Massachusetts outcomes as a benchmark because of their high average test scores; this does not mean, however, that New Jersey can simply spend as much as Massachusetts and achieve similar results. There are substantial differences between the two states in poverty and English Language Learner rates, labor costs, urban density, and other factors that affect school costs. Our models account for those differences, creating estimates of what funding levels are needed for New Jersey, with its unique characteristics, to attain Massachusetts’ outcomes.

    The higher standard model where wealthier districts have adequate funding (and that middle-poverty districts are close) suggests that while the base amounts per pupil set is near or at the level it needs to be, the weighting for economically disadvantaged students is too low. Therefore, adjusting the weights is important for the state to move towards adequacy and fulfilling the constitutionality of SFRA.

    Again, these estimates are based on actual fiscal and outcome data, not simply educated guesses. The models use methods other states have already employed to better calibrate their school funding formulas toward the goal of educational adequacy.  Of course, different outcome goals and different statistical models can and will yield different estimates. We explore these differences in the Technical Appendix.

    Recommendation: Adjust SFRA With Input From School Finance Experts

    New Jersey’s school funding law, SFRA, must be regularly adjusted to maintain its constitutionality. But it must be adjusted correctly, based on student outcome and fiscal data, valid methods, and rigorous yet achievable standards. Fortunately, other states have shown how the Legislature could proceed, using cost modeling approaches that yield estimates far more likely than previous ones to reflect the true cost of providing New Jersey’s students with an adequate education.

    We recommend that the Legislature consider directing the Joint Committee on the Public Schools to hold hearings on SFRA’s adjustment. The Committee should hear from experts in the field of public school finance as to why recalibration is necessary, options for performing the recalibration, and the experiences of other states in reworking their school funding formulas. The final work product of the hearings should be a report (likely produced by contracted experts in school finance, as in other states) that estimates costs and sets SFRA base amounts and weights based on various scenarios and outcome goals.

    Adjusting SFRA is necessary to retain its constitutionality and help ensure New Jersey’s students get the schooling they deserve. The Legislature should act now and begin the process of SFRA recalibration so all of New Jersey’s children have equal educational opportunities.


    Technical Appendix

    Over the past several years, we have developed a National Education Cost Model (NECM), which is used in our national reporting on the adequacy and fairness of state school finance systems.[20] Specifically, the current version of the model uses data on over 13,000 school districts per year from 2009 to 2019 to estimate the relationship between existing and past spending, district characteristics, student characteristics, and outcomes in reading and math to generate predictions of the spending needed to achieve specific outcome levels in each district.

    In this appendix, we include additional estimates of costs derived from our national data sources and national model specification. Specifically, we provide estimates here to isolate New Jersey and neighboring states, running a regional cost model. In addition, we run a cost model using our national data, but on New Jersey districts alone. Our experience with the model has shown us that sometimes cost variations within regions and specific states differ from those in other regions of the United States. These differences may occur because of the geographic and demographic differences that exist from region to region and the fact that school districts tend to be organized differently from state to state and region to region.

    Again, we set lower and higher standards for outcomes for which we predict per pupil costs for each district and compare against existing spending:

    • Standard 1 = National Average Outcomes
    • Standard 2 = Massachusetts Average Outcomes (National Model), New Jersey Average (Regional & State Models)


    The table below summarizes our national cost model results, comparing cost predictions to alternative per-pupil spending measures and the budgeted adequacy calculation produced under SFRA. The most directly relevant spending figure is the U.S. Census Bureau’s current operating expense figure because that is the measure on which the model is estimated. The model compares spending to outcome measures, considering student and context measures to establish the relationships from which we predict the spending needed to achieve desired outcomes.

    The New Jersey Department of Education budgetary per pupil cost measure is less inclusive than the Census Current Spending measure. But, for either the budgetary per pupil cost or current spending measure, we see that the lowest poverty 20% of districts spend marginally more than the highest poverty 20% of districts. That is, actual spending is “regressive” concerning poverty. This is even though predicted per pupil costs to achieve common outcomes are much higher in the highest poverty districts. Indeed, SFRA provides a higher adequacy budget for those districts, but not enough. And the “progressiveness” of SFRA adequacy budgets is insufficient to offset the regressiveness of what New Jersey school districts raise and spend. We can also see that where spending falls short of costs, outcomes fall short of targets.

    The table below compares three models estimated for this brief to SFRA adequacy budgets for 2023, starting with the model estimates from the table above. We use our cost estimates from 2020, one year beyond the available outcome data. An interesting twist is that these cost estimates are slightly lower than those for 2019. This is because student outcomes in recent years have declined nationally, and our model finds logically that lower outcomes cost less to achieve. Our outcome targets are based on existing and historical averages here, nationally, and for Massachusetts and New Jersey.

    By 2023, SFRA adequacy budgets have increased from the 2019 figures in the previous table. The highest poverty districts are, on average, at or near the per pupil costs to achieve national average outcomes. Recall that if we strive to achieve a specific outcome target, on average, about half of students will fall below that target and about 16% substantially below (as noted above, below average outcomes of low-income students in states like Alabama or Mississippi). On average, shooting for a higher target is necessary for meeting reasonable targets for those in the lower half of the distribution.

    As with the comparison in the previous table: when compared against the higher target, adequacy budgets by 2023 approximate the cost target for the two lowest-poverty quintiles. However, adequate budgets for the two highest-poverty quintiles fall short of cost targets. The high outcome standard in the National and Regional model is the Massachusetts average, and in the New Jersey model is New Jersey’s average, similar to that of Massachusetts. Suppose we believe that the current state of average math and reading outcomes in New Jersey meets the constitutional standard of adequacy. In that case, this may be a reasonable starting point for calibration.

    Recall that the differences in adequacy budgets under SFRA have been achieved through a series of pupil weightings or multipliers times a base level of funding. The latest Educational Adequacy Report (EAR) puts the formula weight at 0.5 for Limited English Proficient (LEP) students and 0.47 to 0.57 for Free and Reduced-Price Lunch students. This should mean that every LEP student in a district generates at least 1.5 times the base amount; in reality, however, the SFRA adequacy budget and the actual spending of districts are significantly less. The table below shows the “actual” weights that result from either our simulation of the SFRA adequacy budget or from spending as reported in the Taxpayers Guide to Educational Spending.

    Below these are weights derived from our cost models. The Free Lunch weight for the model using Massachusetts mean outcomes as the goal is 1.2; the models suggest that the SFRA weight should be adjusted from about .5 to 1.2 if the goal is to achieve average Massachusetts outcomes on state tests. The LEP weight should be adjusted to 0.68 from 0.5.


    End Notes


    [1] Baker, B. D. and Weber, M.A. (2022) Separate and Unequal: Racial Segregation and the Case for School Funding Reparations in New Jersey. Trenton, NJ: New jersey Policy Perspective. https://www.njpp.org/publications/report/separate-and-unequal-racial-and-ethnic-segregation-and-the-case-for-school-funding-reparations-in-new-jersey/

    [2] Baker, B. D., & Weber, M. A. (2016). Beyond the echo-chamber: State investments and student outcomes in US elementary and secondary education. Journal of Education Finance, 42(1), 1–27.

    Baker, B. D., Weber, M., & Srikanth, A. (2021). Informing Federal School Finance Policy with Empirical Evidence. Journal of Education Finance, 47(1), 1–25.

    Jackson, C. K., Johnson, R. C., & Persico, C. (2016). The effects of school spending on educational and economic outcomes: Evidence from school finance reforms. The Quarterly Journal of Economics, 131(1), 157–218. https://doi.org/10.1093/qje/qjv036

    Jackson, K. (2018). Does School Spending Matter? (Working Paper 25368). National Bureau of Economic Research. http://www.nber.org/papers/w25368

    Lafortune, J., & Schönholzer, D. (2022). The Impact of School Facility Investments on Students and Homeowners: Evidence from Los Angeles. American Economic Journal: Applied Economics, 14(3), 254–289. https://doi.org/10.1257/app.20200467

    Rothstein, J., & Schanzenbach, D. W. (2021). Does Money Still Matter? Attainment and Earnings Effects of Post-1990 School Finance Reforms. 48.

    [3] Baker, B. D. (2017). How Money Matters for Schools. Learning Policy Institute. https://learningpolicyinstitute.org/product/how-money-matters-report

    Jackson, C. K., Johnson, R. C., & Persico, C. (2016). The effects of school spending on educational and economic outcomes: Evidence from school finance reforms. The Quarterly Journal of Economics, 131(1), 157–218. https://doi.org/10.1093/qje/qjv036

    Finn, J. D., & Achilles, C. M. (1999). Tennessee’s Class Size Study: Findings, Implications, Misconceptions. Educational Evaluation and Policy Analysis, 21(2), 97–109.

    [4] Abbott decisions, a series of cases before the state Supreme Court that mandated that the Legislature increase funding to a select group of high-needs districts; https://edlawcenter.org/litigation/abbott-v-burke/abbott-history.html

    [5] Baker, B. D. and Weber, M.A. (2022) New Jersey School Funding: The Higher the Goals, the Higher the Costs. Trenton, NJ: New Jersey Policy Perspective. https://www.njpp.org/publications/report/new-jersey-school-funding-the-higher-the-goals-the-higher-the-costs/

    [6] Abbott XXI, 206 N.J. 332 (May 2011)

    [7] Baker, B.D. and Weber, M.A. (2020) New Jersey’s School Funding Reform Act at 10 Years. Trenton, NJ: New Jersey Policy Perspective. http://www.njpp.org/wp-content/uploads/2019/03/NJPP-Bruce-Baker-School-Funding-Reform-Act-at-10-Years-Full-Report.pdf

    [8] Baker, B. D. and Weber, M.A. (2022) New Jersey School Funding: The Higher the Goals, the Higher the Costs. Trenton, NJ: New Jersey Policy Perspective. https://www.njpp.org/publications/report/new-jersey-school-funding-the-higher-the-goals-the-higher-the-costs/

    [9] Baker, B. D. and Weber, M.A. (2022) New Jersey School Funding: The Higher the Goals, the Higher the Costs. Trenton, NJ: New Jersey Policy Perspective. https://www.njpp.org/publications/report/new-jersey-school-funding-the-higher-the-goals-the-higher-the-costs/

    [10] https://nces.ed.gov/nationsreportcard/

    [11] New Jersey Assessment of Skills and Knowledge.

    [12] The Partnership for Assessment of Readiness for College and Careers.

    [13] New Jersey Student Learning Assessments.

    [14] Baker, B.D. and Weber, M.A. (2020) New Jersey’s School Funding Reform Act at 10 Years. Trenton, NJ: New Jersey Policy Perspective. http://www.njpp.org/wp-content/uploads/2019/03/NJPP-Bruce-Baker-School-Funding-Reform-Act-at-10-Years-Full-Report.pdf

    [15] Taylor, L., Willis, J., Berg-Jacobson, A., Jaquet, K., & Caparas, R. (2018). Estimating the costs associated with reaching student achievement expectations for Kansas public education students: A cost function approach. San Francisco, CA: WestEd. Retrieved from https://probstforprogress.com/wp-content/uploads/2018/03/kansas_adequacy_study_cost_function_approach_20180315_final.pdf

    Duncombe, W., Yinger, J. (2006) Estimating the Costs of Meeting Student Performance Outcomes Adopted by the Kansas State Board of Education. Prepared for the Kansas Legislative Division of Post Audit  https://www.maxwell.syr.edu/uploadedFiles/cpr/research/cpr_research_education_finance_policy/Kansas_Report.pdf

    [16] Kolbe, T., Baker, B.D., Atchison, D., Levin, J. (2019) Pupil Weighting Factors Report. State of Vermont, House and Senate Committees on Education. https://legislature.vermont.gov/assets/Legislative-Reports/edu-legislative-report-pupil-weighting-factors-2019.pdf

    See also: https://www.wcax.com/2022/05/24/vermont-per-pupil-spending-reform-bill-signed-into-law/

    [17] Baker, B.D., Atchison, D., Levin, J., Kearns, C. (2020) New Hampshire Commission to Study School Funding, Final Report: https://carsey.unh.edu/sites/default/files/media/2020/09/20-12685_nh_final_report_version_v5_draft_1.pdf

    [18] Baker, B.D., Di Carlo, M., Weber, M. (2022) Ensuring Adequate Education Funding for All: A New Federal Foundation Aid Formula. Albert Shanker Institute: https://www.shankerinstitute.org/fedformula

    Baker, B.D., Di Carlo, M., Weber, M. (2021) The Adequacy of School District Spending in the U.S. Albert Shanker Institute. https://www.schoolfinancedata.org/wp-content/uploads/2021/03/SFID_DCDbrief_Mar2021.pdf

    [19] Baker, B.D. and Weber, M.A. (2022). School Funding in New Jersey: A Fair Future for All. Trenton, NJ: New Jersey Policy Perspective. https://www.njpp.org/publications/report/school-funding-in-new-jersey-a-fair-future-for-all/

    [20] Baker, B.D., Di Carlo, M., Weber, M. (2022) Ensuring Adequate Education Funding for All: A New Federal Foundation Aid Formula. Albert Shanker Institute: https://www.shankerinstitute.org/fedformula

    Baker, B.D., Di Carlo, M., Weber, M. (2021) The Adequacy of School District Spending in the U.S. Albert Shanker Institute. https://www.schoolfinancedata.org/wp-content/uploads/2021/03/SFID_DCDbrief_Mar2021.pdf