All students, regardless of their background, should have access to a high-quality education to help them reach their full potential. In the past few years, New Jersey has moved steadily toward fully funding its schools through the 2008 School Funding Reform Act (SFRA), the state’s school finance law. This landmark legislation requires funding alignment with student outcomes.
Since SFRA was enacted in 2009, however, New Jersey has raised student achievement expectations: state exams are more rigorous, and students are expected to meet higher standards. While there have been small changes in SFRA funding targets since its inception, the current law does not provide all the resources students need to reach these new standards because it is still aligned with outdated learning goals.
The state can fine-tune the formula by making small but significant tweaks. Specifically, the state can adjust the funding needed to adequately educate a student, which is called the base student amount, and align that with the additional costs for students who need extra help, like special education students, English language learners (ELL), and more, which are called weights for student characteristics. Other states have recently used updated and improved data and methods, and New Jersey can do the same.
History has shown — and we have documented in previous work — that systemic, institutional racism has fostered the segregative trends that led to the current concentration of low property values and high student need in many of New Jersey’s towns and cities.[1] Properly adjusting SFRA is, therefore, a matter of both racial justice and educational adequacy. This report explores what it means to fund our schools adequately and meet the constitutionality of SFRA, explains the school funding formula, and offers recommendations to fine-tune SFRA to ensure its constitutionality and that it better supports today’s students and their futures.
What is “Adequate” School Funding?
Research conclusively shows that school funding has a significant effect on student success.[2] At the same time, research also shows that different communities require different funding levels to provide equal educational opportunities for their students. But how much funding should be given to each district based on the unique needs of their student populations? Adequacy refers to the level of funding needed for a specific population of students to achieve a specific educational outcome. A school district with adequate funding has the resources to provide an education that allows its students to meet a specific goal: an average test score, a particular graduation rate, or some other measurable outcome.
Adequacy considers the characteristics of a school district’s students that affect their abilities to achieve learning outcomes. For instance, adequacy acknowledges that more revenue is needed when student poverty is more highly concentrated, or students have greater educational needs. Adequacy also accounts for differences in labor markets and other factors that drive up district costs to staff their schools properly. Finally, adequacy considers the rigor of the educational outcomes that students are expected to achieve. Put simply, meeting higher standards costs more than meeting lower standards.
Exactly how school funding positively affects outcomes continues to be studied; however, researchers have found compelling evidence that reductions in class size, more support and instructional staff, early childhood education, increases in instructional time, and more competitive wages for school staff benefit students.[3] All of these reforms are made possible when school funding is adequate and equitable.
New Jersey’s Constitutional Mandate for Adequately Funded Schools
The New Jersey Constitution requires that the Legislature “…provide for the maintenance and support of a thorough and efficient system of free public schools….” However, in a series of lawsuits throughout the last 50 years, including the Abbott decisions, the state Supreme Court found that the Legislature was still not meeting its obligations and demanded increased school funding. [4] In this context, the School Funding Reform Act of 2008 was enacted, a public education finance formula connecting school funding to the state’s broader adoption of academic content standards and performance assessments.
Even when the law passed — as pointed out in previous reports — the outcome standards and cost estimates used to set adequacy levels in SFRA were already several years old. [5] The general tone of the court suggested that SFRA looked like a reasonable effort to meet the standard it had laid out a decade earlier and that SFRA could be implemented — but only with certain conditions attached.
The court held:
To the extent that the record permitted in this review, SFRA is constitutional and may be applied in Abbott districts subject to the State continuing to provide school funding aid during this and the next two years at the levels required by SFRA’s formula each year, and subject further to the mandated review and retooling of the formula’s weights and other operative parts after three years of implementation.
– Abbott XX, 199 N.J. 140, May 2009. Emphasis ours.
In addition to the law requiring that the SFRA formula must be reviewed and, if necessary, recalibrated every three years, the court found SFRA is also only constitutional if it is fully funded. The court reaffirmed this point when funds were cut from Abbott districts in 2011.[6] Under the Murphy administration, the Legislature has moved closer to fully funding the current formula; this is an important step forward. However, SFRA must also be aligned with current standards and student outcome goals to remain constitutional.
Understanding the School Funding Formula (SFRA)
While it is well understood that schools need adequate funding, setting adequacy levels is a complex task. New Jersey’s School Funding Reform Act (SFRA) outlines a formula to set adequacy levels for all school districts. As noted in previous work, the SFRA formula needs updating to be constitutional and fix the significant underestimation of the adequacy level for many school districts.[7]
Fortunately, lawmakers don’t need to start from scratch; they need only follow the law and reset a few key components in the formula to ensure that all schools and their students receive adequate funding. But, to understand how the SFRA formula can be adjusted, we must first understand how it works. The formula uses a “weighted student enrollment” method that can be simplified into three basic steps:
Step 1: Set the “Base Amount”
In theory, the base amount determines the funding needed to adequately educate students in Grades 1 through 5, assuming they are not economically disadvantaged and speak English as their native language. If a school district only had these students and received the base amount per pupil — currently $12,451, as shown in the table below — it would, according to the SFRA formula, have the resources it needs to achieve the educational goals the state has set.
Step 2: Determine the “Weighted Student Enrollment”
The SFRA formula does more than count the number of students in a school district; it also tracks important student characteristics that increase costs, “weighting” students with those characteristics more heavily. For example, elementary school students are considered the baseline, and each are counted as 1.00 student, absent of all other factors. For every student who does not speak English as their native language — Limited English Proficient (LEP) — an additional 0.5 for each LEP student is counted in the weighted enrollment count. Also, students in poverty (as measured by their eligibility for free or reduced-price lunch) are weighted between 1.47 and 1.57 times more heavily in the enrollment count, depending on the concentration of poverty in their district. Further, high school students are weighted more heavily than elementary students and vocational tech students receive additional weights. The latest weights are listed in the table below.
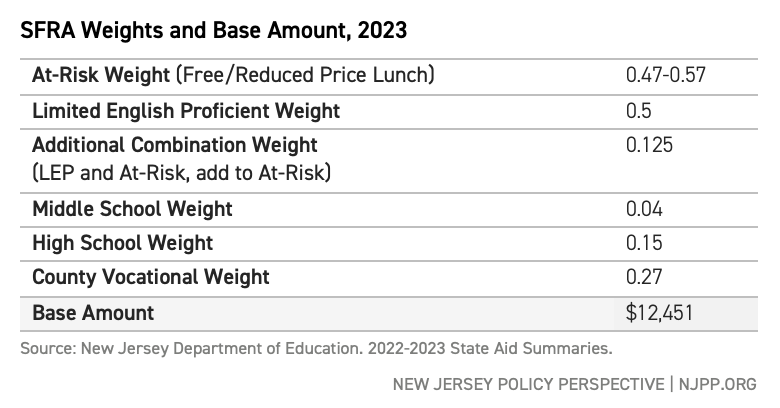
Step 3: Multiply the Weighted Student Enrollment by the Base Amount
The total adequacy budget is the student enrollment, weighted by student characteristics, multiplied by the base amount (and further weighted by geographic cost adjustments).
To be clear: this is a simplified explanation of only one part of the SFRA formula. Other factors affect the final school aid calculation a district receives from the state, such as special education, categorical aid, local fair share, etc.
Understanding the steps above yields a key insight: The SFRA formula can be adjusted by changing the base amount and the weights used to determine weighted student enrollment. When the base and the weights are set correctly, the amount a district should spend to provide an adequate education is calculated accurately; when the base and weights are wrong, the adequacy budget calculation is wrong. Getting the base and the weights right is, therefore, critically important for maintaining the constitutionality of SFRA. By law, the base and weights must be adjusted every three years.
Current SFRA Adequacy: An Update
A previous NJPP report explains how the outcome standards required of New Jersey’s students over time have changed, becoming more demanding and requiring more intensive instruction.[8] Therefore, the current SFRA formula likely underestimates the funding schools need to achieve adequacy. In 2018, over 100,000 students were in schools that were severely underfunded — more than $5,000 per pupil less than SFRA’s targets. That number has been cut in half in recent years; however, many New Jersey children are still enrolled in underfunded schools as assessed by SFRA’s formula.
New Jersey’s New, More Rigorous Standards
To maintain constitutionality, adjustments to the SFRA formula must be linked to learning outcomes, especially if those outcomes have changed — which they have. In a previous report[9], we explained how the outcome standards required of New Jersey’s students over time have become more demanding and, therefore, require more intensive instruction. To illustrate this change, this report uses the best consistent measure for determining a state’s goals for student proficiency: the National Assessment of Education Progress (NAEP)[10], a national test considered the gold standard of student assessment.
Because the NAEP is designed to be a consistently challenging exam across time, it can compare the relative difficulty of achieving a proficient score on New Jersey’s state tests in different years — even if the tests and their definition of “proficient” change. As the graph below shows, the difficulty of New Jersey’s tests has increased considerably; a score considered “proficient” two decades ago would not be today.
At the time of SFRA’s inception, methods for making these estimates, or “costing out” an adequate education, primarily revolved around making what are best described as educated guesses. Documented here and in previous work,[14] estimates were below what is needed to provide an adequate education, especially for schools serving large proportions of students experiencing economic disadvantage.
Fine-Tuning the Formula With Evidence
The SFRA formula can and should be fine-tuned with better data and methods. Recent examples from other states show New Jersey how the school funding formula can be improved to better estimate the costs of an adequate education. This is not only important to meet the needs of New Jersey students but also to comply with the state constitution, which calls for regular updating.
In the last several years, data collection and methods to analyze those data have improved significantly: policymakers have better access to data on student characteristics, area poverty, wage competitiveness, and other factors that affect educational costs than they had before. Cost estimates based on data analysis have the advantage of being based on actual spending and measurable student outcomes. Other states have taken advantage of these improvements to adjust their formulas and better estimate educational costs. Examples include:
- Kansas: In 2017, Legislators contracted with independent researchers to estimate an updated cost model based on new outcome standards to revise their weighted foundation aid formula as ordered by the state courts. Kansas had used similar, rigorous statistical methods ahead of other states a decade earlier.[15]
- Vermont: Legislators contracted the American Institutes for Research (AIR) in collaboration with the University of Vermont to use similar methods to guide reforms of their pupil need weights. While COVID slowed the process, in the spring of 2022, the Vermont legislature and governor adopted reforms to the weighting system guided by those findings.[16]
- New Hampshire: In 2020, the New Hampshire Commission on School Funding worked with the same researchers to estimate models of the costs to achieve that state’s desired outcome goals but has not yet acted on the report findings.[17] (One of the authors of this brief, Dr. Bruce D. Baker, was part of the teams that performed the Vermont and New Hampshire analyses.)
Studies like these can be completed in under a year with lower expense and greater validity than other methods that estimate educational costs. They have the additional advantage of being able to be easily updated as new data is collected.
Adjusting SFRA: An Example
How might New Jersey use a data-informed approach to adjust SFRA? The state can use a data-informed approach that uses national datasets and modern cost-modeling methods. Over the past several years, for example, the authors of this brief have developed a National Education Cost Model (NECM), which is used in our national reporting on the adequacy and fairness of state school finance systems.[18] The model uses data on over 13,000 school districts per year over a decade to estimate the relationship between existing and past spending, district characteristics, student characteristics, and outcomes in reading and math. The resulting estimations allow us to set appropriate outcome goals and estimate the cost of attaining them for individual school districts.
We have used this model in earlier NJPP reports to evaluate the adequacy of SFRA concerning the costs of achieving different outcomes on state tests in English and math.[19] Importantly, we arrived at different estimations based on different outcome goals. The cost per pupil is relatively modest if we set a relatively low goal — for example, the national average outcomes on state tests. If we set a higher goal — say, average outcomes for Massachusetts students, the highest in the nation — the cost estimates are higher.
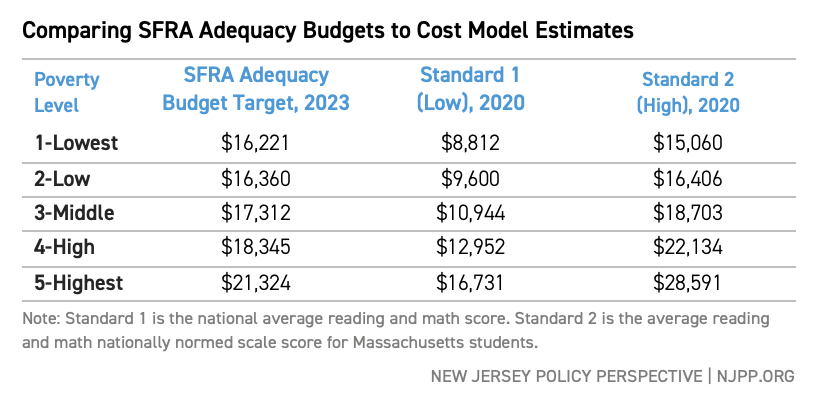
The table below shows estimates from the NECM with two outcomes goals, compared to a simulation of the SFRA adequacy budget’s funding targets. Standard 1 — the low standard — is the estimated cost of achieving national average outcomes of state tests. Standard 2 is higher: average Massachusetts outcomes. The estimates are broken down into five poverty levels, ranging from low to high.
If New Jersey were to set a low target for national average test scores, the SFRA, in its current form, would provide more than enough revenue to meet that goal, especially in lower-poverty districts. However, New Jersey is relatively high performing, surpassing national averages. If the state sets the higher goal of meeting Massachusetts’s average outcomes (again, the highest outcomes in the nation), only wealthier districts would have the revenues needed under SFRA to meet that goal. The highest-poverty districts would need more than $7,000 additional dollars per student to achieve this more rigorous standard.
The higher standard model where wealthier districts have adequate funding (and that middle-poverty districts are close) suggests that while the base amounts per pupil set is near or at the level it needs to be, the weighting for economically disadvantaged students is too low. Therefore, adjusting the weights is important for the state to move towards adequacy and fulfilling the constitutionality of SFRA.
Again, these estimates are based on actual fiscal and outcome data, not simply educated guesses. The models use methods other states have already employed to better calibrate their school funding formulas toward the goal of educational adequacy. Of course, different outcome goals and different statistical models can and will yield different estimates. We explore these differences in the Technical Appendix.
Recommendation: Adjust SFRA With Input From School Finance Experts
New Jersey’s school funding law, SFRA, must be regularly adjusted to maintain its constitutionality. But it must be adjusted correctly, based on student outcome and fiscal data, valid methods, and rigorous yet achievable standards. Fortunately, other states have shown how the Legislature could proceed, using cost modeling approaches that yield estimates far more likely than previous ones to reflect the true cost of providing New Jersey’s students with an adequate education.
We recommend that the Legislature consider directing the Joint Committee on the Public Schools to hold hearings on SFRA’s adjustment. The Committee should hear from experts in the field of public school finance as to why recalibration is necessary, options for performing the recalibration, and the experiences of other states in reworking their school funding formulas. The final work product of the hearings should be a report (likely produced by contracted experts in school finance, as in other states) that estimates costs and sets SFRA base amounts and weights based on various scenarios and outcome goals.
Adjusting SFRA is necessary to retain its constitutionality and help ensure New Jersey’s students get the schooling they deserve. The Legislature should act now and begin the process of SFRA recalibration so all of New Jersey’s children have equal educational opportunities.
Technical Appendix
Over the past several years, we have developed a National Education Cost Model (NECM), which is used in our national reporting on the adequacy and fairness of state school finance systems.[20] Specifically, the current version of the model uses data on over 13,000 school districts per year from 2009 to 2019 to estimate the relationship between existing and past spending, district characteristics, student characteristics, and outcomes in reading and math to generate predictions of the spending needed to achieve specific outcome levels in each district.
In this appendix, we include additional estimates of costs derived from our national data sources and national model specification. Specifically, we provide estimates here to isolate New Jersey and neighboring states, running a regional cost model. In addition, we run a cost model using our national data, but on New Jersey districts alone. Our experience with the model has shown us that sometimes cost variations within regions and specific states differ from those in other regions of the United States. These differences may occur because of the geographic and demographic differences that exist from region to region and the fact that school districts tend to be organized differently from state to state and region to region.
Again, we set lower and higher standards for outcomes for which we predict per pupil costs for each district and compare against existing spending:
- Standard 1 = National Average Outcomes
- Standard 2 = Massachusetts Average Outcomes (National Model), New Jersey Average (Regional & State Models)
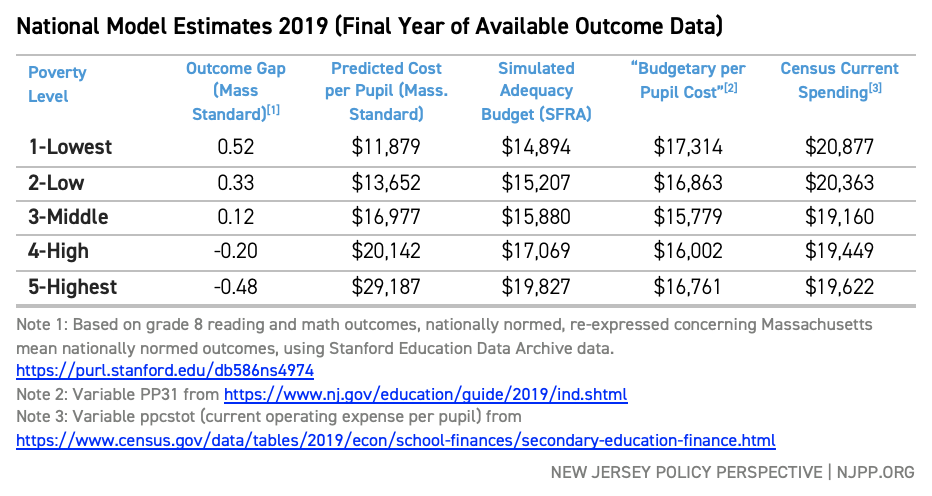
The table below summarizes our national cost model results, comparing cost predictions to alternative per-pupil spending measures and the budgeted adequacy calculation produced under SFRA. The most directly relevant spending figure is the U.S. Census Bureau’s current operating expense figure because that is the measure on which the model is estimated. The model compares spending to outcome measures, considering student and context measures to establish the relationships from which we predict the spending needed to achieve desired outcomes.
The New Jersey Department of Education budgetary per pupil cost measure is less inclusive than the Census Current Spending measure. But, for either the budgetary per pupil cost or current spending measure, we see that the lowest poverty 20% of districts spend marginally more than the highest poverty 20% of districts. That is, actual spending is “regressive” concerning poverty. This is even though predicted per pupil costs to achieve common outcomes are much higher in the highest poverty districts. Indeed, SFRA provides a higher adequacy budget for those districts, but not enough. And the “progressiveness” of SFRA adequacy budgets is insufficient to offset the regressiveness of what New Jersey school districts raise and spend. We can also see that where spending falls short of costs, outcomes fall short of targets.
The table below compares three models estimated for this brief to SFRA adequacy budgets for 2023, starting with the model estimates from the table above. We use our cost estimates from 2020, one year beyond the available outcome data. An interesting twist is that these cost estimates are slightly lower than those for 2019. This is because student outcomes in recent years have declined nationally, and our model finds logically that lower outcomes cost less to achieve. Our outcome targets are based on existing and historical averages here, nationally, and for Massachusetts and New Jersey.
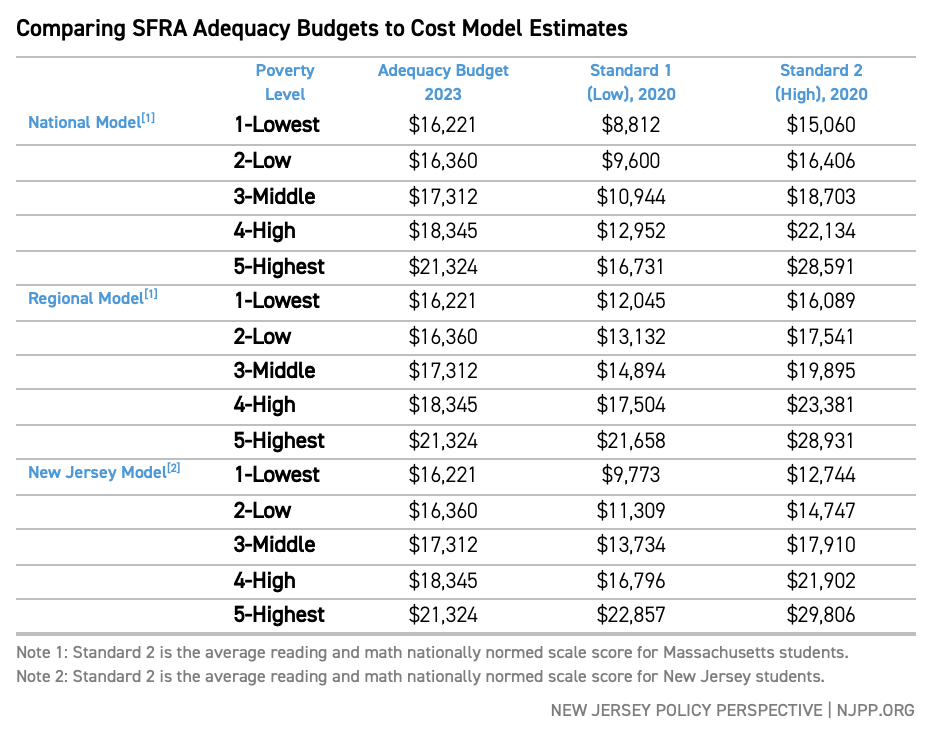
By 2023, SFRA adequacy budgets have increased from the 2019 figures in the previous table. The highest poverty districts are, on average, at or near the per pupil costs to achieve national average outcomes. Recall that if we strive to achieve a specific outcome target, on average, about half of students will fall below that target and about 16% substantially below (as noted above, below average outcomes of low-income students in states like Alabama or Mississippi). On average, shooting for a higher target is necessary for meeting reasonable targets for those in the lower half of the distribution.
As with the comparison in the previous table: when compared against the higher target, adequacy budgets by 2023 approximate the cost target for the two lowest-poverty quintiles. However, adequate budgets for the two highest-poverty quintiles fall short of cost targets. The high outcome standard in the National and Regional model is the Massachusetts average, and in the New Jersey model is New Jersey’s average, similar to that of Massachusetts. Suppose we believe that the current state of average math and reading outcomes in New Jersey meets the constitutional standard of adequacy. In that case, this may be a reasonable starting point for calibration.
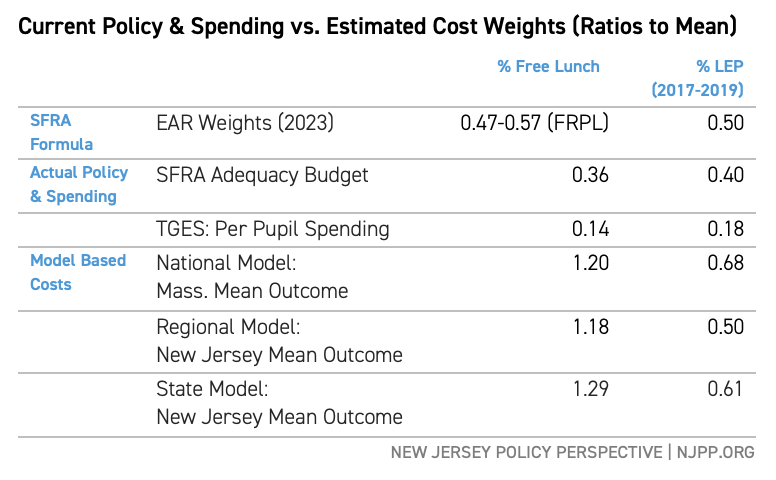
Recall that the differences in adequacy budgets under SFRA have been achieved through a series of pupil weightings or multipliers times a base level of funding. The latest Educational Adequacy Report (EAR) puts the formula weight at 0.5 for Limited English Proficient (LEP) students and 0.47 to 0.57 for Free and Reduced-Price Lunch students. This should mean that every LEP student in a district generates at least 1.5 times the base amount; in reality, however, the SFRA adequacy budget and the actual spending of districts are significantly less. The table below shows the “actual” weights that result from either our simulation of the SFRA adequacy budget or from spending as reported in the Taxpayers Guide to Educational Spending.
Below these are weights derived from our cost models. The Free Lunch weight for the model using Massachusetts mean outcomes as the goal is 1.2; the models suggest that the SFRA weight should be adjusted from about .5 to 1.2 if the goal is to achieve average Massachusetts outcomes on state tests. The LEP weight should be adjusted to 0.68 from 0.5.
End Notes
[1] Baker, B. D. and Weber, M.A. (2022) Separate and Unequal: Racial Segregation and the Case for School Funding Reparations in New Jersey. Trenton, NJ: New jersey Policy Perspective. https://www.njpp.org/publications/report/separate-and-unequal-racial-and-ethnic-segregation-and-the-case-for-school-funding-reparations-in-new-jersey/
[2] Baker, B. D., & Weber, M. A. (2016). Beyond the echo-chamber: State investments and student outcomes in US elementary and secondary education. Journal of Education Finance, 42(1), 1–27.
Baker, B. D., Weber, M., & Srikanth, A. (2021). Informing Federal School Finance Policy with Empirical Evidence. Journal of Education Finance, 47(1), 1–25.
Jackson, C. K., Johnson, R. C., & Persico, C. (2016). The effects of school spending on educational and economic outcomes: Evidence from school finance reforms. The Quarterly Journal of Economics, 131(1), 157–218. https://doi.org/10.1093/qje/qjv036
Jackson, K. (2018). Does School Spending Matter? (Working Paper 25368). National Bureau of Economic Research. http://www.nber.org/papers/w25368
Lafortune, J., & Schönholzer, D. (2022). The Impact of School Facility Investments on Students and Homeowners: Evidence from Los Angeles. American Economic Journal: Applied Economics, 14(3), 254–289. https://doi.org/10.1257/app.20200467
Rothstein, J., & Schanzenbach, D. W. (2021). Does Money Still Matter? Attainment and Earnings Effects of Post-1990 School Finance Reforms. 48.
[3] Baker, B. D. (2017). How Money Matters for Schools. Learning Policy Institute. https://learningpolicyinstitute.org/product/how-money-matters-report
Jackson, C. K., Johnson, R. C., & Persico, C. (2016). The effects of school spending on educational and economic outcomes: Evidence from school finance reforms. The Quarterly Journal of Economics, 131(1), 157–218. https://doi.org/10.1093/qje/qjv036
Finn, J. D., & Achilles, C. M. (1999). Tennessee’s Class Size Study: Findings, Implications, Misconceptions. Educational Evaluation and Policy Analysis, 21(2), 97–109.
[4] Abbott decisions, a series of cases before the state Supreme Court that mandated that the Legislature increase funding to a select group of high-needs districts; https://edlawcenter.org/litigation/abbott-v-burke/abbott-history.html
[5] Baker, B. D. and Weber, M.A. (2022) New Jersey School Funding: The Higher the Goals, the Higher the Costs. Trenton, NJ: New Jersey Policy Perspective. https://www.njpp.org/publications/report/new-jersey-school-funding-the-higher-the-goals-the-higher-the-costs/
[6] Abbott XXI, 206 N.J. 332 (May 2011)
[7] Baker, B.D. and Weber, M.A. (2020) New Jersey’s School Funding Reform Act at 10 Years. Trenton, NJ: New Jersey Policy Perspective. http://www.njpp.org/wp-content/uploads/2019/03/NJPP-Bruce-Baker-School-Funding-Reform-Act-at-10-Years-Full-Report.pdf
[8] Baker, B. D. and Weber, M.A. (2022) New Jersey School Funding: The Higher the Goals, the Higher the Costs. Trenton, NJ: New Jersey Policy Perspective. https://www.njpp.org/publications/report/new-jersey-school-funding-the-higher-the-goals-the-higher-the-costs/
[9] Baker, B. D. and Weber, M.A. (2022) New Jersey School Funding: The Higher the Goals, the Higher the Costs. Trenton, NJ: New Jersey Policy Perspective. https://www.njpp.org/publications/report/new-jersey-school-funding-the-higher-the-goals-the-higher-the-costs/
[10] https://nces.ed.gov/nationsreportcard/
[11] New Jersey Assessment of Skills and Knowledge.
[12] The Partnership for Assessment of Readiness for College and Careers.
[13] New Jersey Student Learning Assessments.
[14] Baker, B.D. and Weber, M.A. (2020) New Jersey’s School Funding Reform Act at 10 Years. Trenton, NJ: New Jersey Policy Perspective. http://www.njpp.org/wp-content/uploads/2019/03/NJPP-Bruce-Baker-School-Funding-Reform-Act-at-10-Years-Full-Report.pdf
[15] Taylor, L., Willis, J., Berg-Jacobson, A., Jaquet, K., & Caparas, R. (2018). Estimating the costs associated with reaching student achievement expectations for Kansas public education students: A cost function approach. San Francisco, CA: WestEd. Retrieved from https://probstforprogress.com/wp-content/uploads/2018/03/kansas_adequacy_study_cost_function_approach_20180315_final.pdf
Duncombe, W., Yinger, J. (2006) Estimating the Costs of Meeting Student Performance Outcomes Adopted by the Kansas State Board of Education. Prepared for the Kansas Legislative Division of Post Audit https://www.maxwell.syr.edu/uploadedFiles/cpr/research/cpr_research_education_finance_policy/Kansas_Report.pdf
[16] Kolbe, T., Baker, B.D., Atchison, D., Levin, J. (2019) Pupil Weighting Factors Report. State of Vermont, House and Senate Committees on Education. https://legislature.vermont.gov/assets/Legislative-Reports/edu-legislative-report-pupil-weighting-factors-2019.pdf
See also: https://www.wcax.com/2022/05/24/vermont-per-pupil-spending-reform-bill-signed-into-law/
[17] Baker, B.D., Atchison, D., Levin, J., Kearns, C. (2020) New Hampshire Commission to Study School Funding, Final Report: https://carsey.unh.edu/sites/default/files/media/2020/09/20-12685_nh_final_report_version_v5_draft_1.pdf
[18] Baker, B.D., Di Carlo, M., Weber, M. (2022) Ensuring Adequate Education Funding for All: A New Federal Foundation Aid Formula. Albert Shanker Institute: https://www.shankerinstitute.org/fedformula
Baker, B.D., Di Carlo, M., Weber, M. (2021) The Adequacy of School District Spending in the U.S. Albert Shanker Institute. https://www.schoolfinancedata.org/wp-content/uploads/2021/03/SFID_DCDbrief_Mar2021.pdf
[19] Baker, B.D. and Weber, M.A. (2022). School Funding in New Jersey: A Fair Future for All. Trenton, NJ: New Jersey Policy Perspective. https://www.njpp.org/publications/report/school-funding-in-new-jersey-a-fair-future-for-all/
[20] Baker, B.D., Di Carlo, M., Weber, M. (2022) Ensuring Adequate Education Funding for All: A New Federal Foundation Aid Formula. Albert Shanker Institute: https://www.shankerinstitute.org/fedformula
Baker, B.D., Di Carlo, M., Weber, M. (2021) The Adequacy of School District Spending in the U.S. Albert Shanker Institute. https://www.schoolfinancedata.org/wp-content/uploads/2021/03/SFID_DCDbrief_Mar2021.pdf