Executive Summary
New Jersey benefits when all children receive a quality education, allowing them to lead fulfilling and productive lives. Since the passage of the 2008 School Funding Reform Act (SFRA), which determines the allocation of school aid, school standards have become more rigorous. Yet, many schools are not receiving the level of funding needed to teach to these more demanding standards.
This report outlines changes in New Jersey’s learning standards since 2008. It also estimates the costs of providing students with a more rigorous education by using a challenging but attainable goal (average Massachusetts educational outcomes).
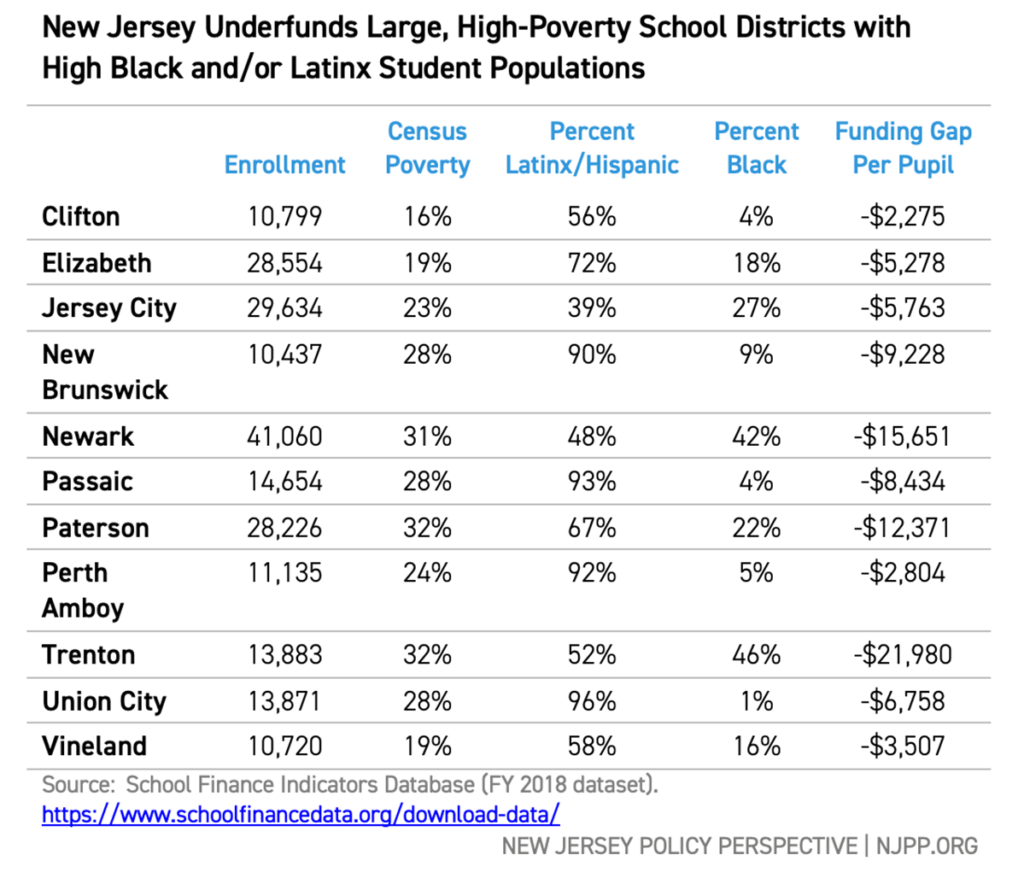
Using the National Educational Cost Model (NECM), the analysis finds that greater financial investment is associated with better student performance: the higher the goals, the higher the costs. New Jersey’s most affluent school districts have the resources they need — and more — to provide a rigorous education. The state’s large, high-poverty districts, however, have far less funding than needed to meet the same exacting standards. The estimated per-pupil spending gap ranges from $2,275 in Clifton to nearly $22,000 in Trenton. The scope of the underfunding, based on estimates from a statistical model, suggests New Jersey must revise its school funding formula.
New Jersey’s large districts enroll many students whose families live in poverty and many students of color — students who have historically attended inadequately-funded schools. The spending gap these children’s schools face is the result of two flaws in New Jersey’s school funding system:
- Failing to fully fund the current SFRA formula.
- Failing to recalibrate the SFRA formula to meet today’s standards.
To make sure all students get the education they need to thrive, New Jersey must first address these flaws by fully funding SFRA — then should adjust the base spending and student weights in the funding formula to reflect current school and student needs. Only then can New Jersey claim to truly offer equal educational opportunity for all students.
Introduction
New Jersey, as part of the state budgeting process, tells school districts every year how much aid they will receive. This aid, combined with local revenues, accounts for most of the school districts’ funding. State aid is supposed to be determined by New Jersey’s school funding law, the School Funding Reform Act (SFRA) of 2008. The state, however, repeatedly puts less money into the school aid fund than the law requires, so schools get less than what the SFRA formula dictates. This results in many districts — including many majority Black and Hispanic/Latinx districts — not having the funding the law says is needed to provide an adequate education.[i]
But even if the law were fully funded, the money New Jersey provides to its school districts likely wouldn’t be enough because the SFRA formula is based on older, less rigorous learning standards and less challenging student exams than now are in use. New Jersey, in effect, demands that school districts educate students to higher standards but has not changed its school funding law to reflect these new, more rigorous goals. This is important because a large and growing body of research shows that adequate school funding is necessary for students to achieve any specific educational outcome.[ii]
How much more do New Jersey’s schools need to reach the state standards?
This report uses fiscal and student achievement data to estimate the cost for New Jersey’s students to achieve challenging but attainable learning outcomes. The report begins with a brief overview of SFRA, explaining how the law determines student costs and local revenues. It then outlines the changes in New Jersey’s learning standards since SFRA passed in 2008, showing that students are now challenged to meet more rigorous goals and pass more difficult tests.
Next, the report compares New Jersey students’ performance to two similarly high-performing states, Massachusetts and Connecticut, to set rigorous yet achievable benchmarks for student achievement. Using the National Education Cost Model, the report estimates the costs of achieving these benchmarks, given the wide variation in student characteristics found in New Jersey school districts. [iii] The report focuses specifically on New Jersey’s large, high-poverty districts, as these have the largest number of students of color and students living in poverty.
The estimates in this report show that SFRA needs review after more than a decade. For example, the estimated per-pupil spending gap ranges from $2,275 in Clifton to nearly $22,000 in Trenton. For all New Jersey students to reach challenging educational goals, the state must supply the funding necessary for schools to provide a rigorous education. This report aims to help lawmakers equitably calibrate the SFRA formula so students in all schools can meet the higher expectations the state has set for them.
The Purpose of SFRA: Determining Student Costs and Providing Needed Revenues
New Jersey’s school funding law, the SFRA, addresses two major factors: the cost of education and sources of revenue to pay that cost.
Two factors determine why some school districts receive more or less state aid than others: districts have different types of learners and needs, and varying capacities to raise local revenue. The primary goal of SFRA is to provide school aid in a way that makes up for these differences.
The revenue component of the funding formula takes into account a district’s ability to collect local funds for schools. For instance, a more affluent district with higher property values is better able to fund education through local property taxes (New Jersey’s main source of local revenue for schools and services) than a less affluent district. The SFRA takes these differences into consideration to determine state aid to schools. NJPP has previously reported on the racial inequities inherent in local tax systems and the resulting educational inequities.[iv] This report focuses on how the SFRA calculates educational costs for the purpose of determining school aid.
Cost is the amount of money needed to educate students to a particular level, accounting for differences in student needs and school contexts. The SFRA considers a variety of factors when determining per-pupil costs, such as: how many students are English Language Learners (ELLs), the concentration of poverty in a school district, cost-of-living differences, and the grade levels the district enrolls. For example, it costs more to teach a student who has a learning disability, such as dyslexia, to read at average grade level than a student without that disability because of the need for extra support. Similarly, a school in a high-cost-of-living region will have greater staffing costs than one in a lower-cost region, as it will cost more to recruit and retain qualified teachers and staff. Further, lower-income districts enrolling many students in poverty will have higher costs than more affluent districts to achieve similar results.[v]
Like school funding formulas in many other states, the SFRA uses a weighting system to determine what a school district’s per-pupil costs will be. The original 2008 law set the “base” cost per pupil, which is then adjusted by “weighting” a student more heavily if that student qualifies for free or reduced-price lunch (a proxy measure of economic disadvantage), is an English language learner (ELL), is enrolled in a higher grade level, etc. For example, a district’s per-pupil cost for each bilingual elementary student is 1.5 times the base weight, or $17,963. In other words, the formula states that the costs for adequately educating a bilingual student is 1.5 times more than an average student who doesn’t have learning needs and isn’t in poverty. The table below shows the current weighting and base costs, as reported in the Fiscal Year 2020-2021 state aid notices.
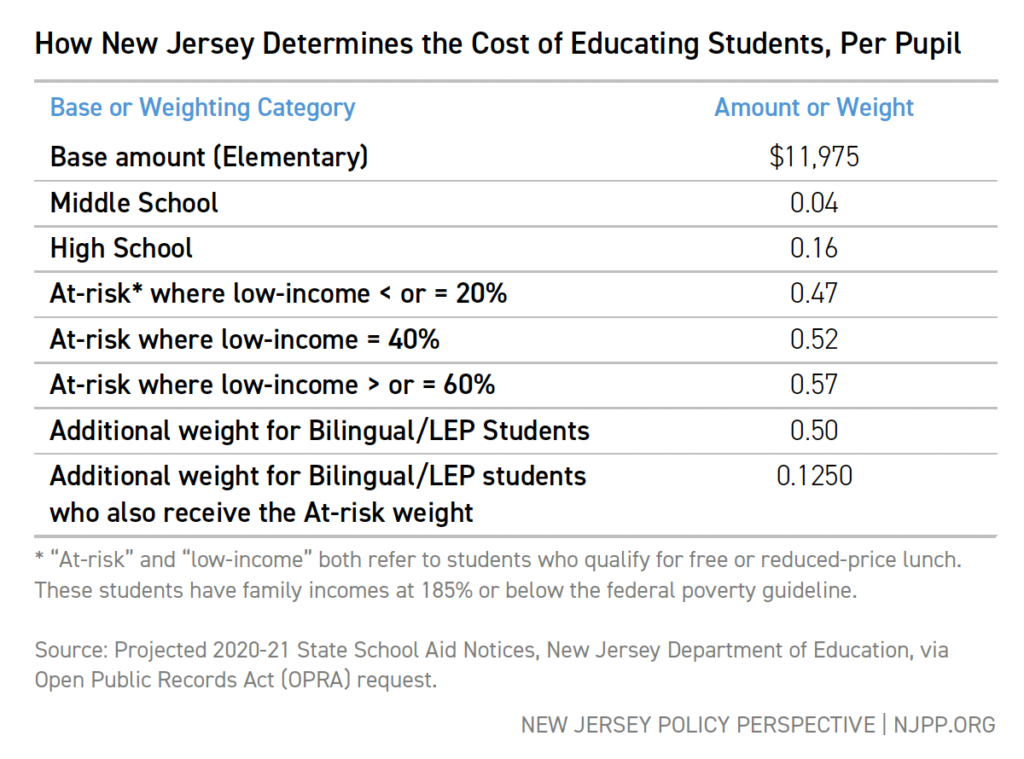
It’s important to understand that both the base and the weights were set based on the goal of having most students reach standards of academic performance as laid out by the state.[vi] New Jersey’s initial cost estimates were calibrated with the 2008 goal of having between 50 and 80 percent of students achieve “proficiency” on state tests. The state could have set a higher target: for example, 90 percent of students reaching proficiency. It could also have set a higher bar for “proficiency,” increasing the difficulty of the tests.
However, these weighting costs estimates were based on the state’s educational goals in 2008. While there have been some adjustments to the estimates to account for changes in the price of educational inputs, such a teacher salaries,[vii] the estimates assume that the goals for students haven’t changed – that the same percentage of students will achieve the same level of proficiency on similar tests of the same content.
New Jersey’s Move to Higher Student Standards and Outcomes
Over the past two decades, much of the focus of K-12 education policy has been on standards and assessments. Driven by concerns that US students academically underperform compared to the rest of the world, a movement grew that emphasized raising the bar for student achievement. In 2009, the Common Core State Standards (CCSS) were launched with the goal of creating a challenging set of student expectations that would be uniform across all states.[viii] Initially, most states adopted these standards, including New Jersey, which replaced its previous standards in math and English with those of the CCSS. A largely political backlash against CCSS, however, quickly led to many states withdrawing from the initiative, again including New Jersey.[ix] The state introduced another new set of standards in 2016: the New Jersey Student Learning Standards (NJSLS). But while the name changed, there was, in fact, little difference between the CCSS and the NJSLS.[x]
The result of these changes is that New Jersey has more challenging standards in math and English than when SFRA was enacted in 2008. The more recent NJSLS standards expect students to acquire deeper knowledge and demonstrate higher-order thinking skills, solving real-world problems as they master new material. The insert below gives an example of how the bar for New Jersey’s students has been raised since SFRA was ratified.
|
New Jersey’s More Rigorous Learning Standards: An Example The goal of the Common Core State Standards was to “…establish clear, consistent guidelines for what every student should know and be able to do in math and English language arts…”[xi] In general, the CCSS – which eventually became the New Jersey Student Learning Standards – are more explicit and more rigorous than New Jersey’s previous standards. Here’s an example: both the old and new Grade 5 math standards require students to demonstrate the ability to measure geometric objects. The new NJSLS, however, are much more specific in their demands, requiring students to “solve real-world problems” and not merely “recognize” concepts. They also require students to measure the volume of objects; the older standards only required measuring area (measuring volume was introduced in Grade 6 in the older standards). Students who are expected to meet the more rigorous standards will need more intensive, personalized instruction, delivered by well-trained teachers, with extra support for students with learning disabilities or who are English language learners. Lawmakers cannot simply assume the costs of meeting older, less rigorous standards will be the same as meeting new, more challenging ones. |
|
Grade 5: New Jersey Core Curriculum Content Standards (2008)[xii] 4.2.5 E. Measuring Geometric Objects 1. Use a protractor to measure angles. 2. Develop and apply strategies and formulas for finding perimeter and area. • Square • Rectangle 3. Recognize that rectangles with the same perimeter do not necessarily have the same area and vice versa. |
|
Grade 5: New Jersey Student Learning Standards (2016)[xiii] C. Geometric measurement: understand concepts of volume and relate volume to multiplication and to addition. 3. Recognize volume as an attribute of solid figures and understand concepts of volume measurement. a. A cube with side length 1 unit, called a “unit cube,” is said to have “one cubic unit” of volume, and can be used to measure volume. b. A solid figure which can be packed without gaps or overlaps using n unit cubes is said to have a volume of n cubic units. 4. Measure volumes by counting unit cubes, using cubic cm, cubic in, cubic ft, and non-standard units. 5. Relate volume to the operations of multiplication and addition and solve real world and mathematical problems involving volume. a. Find the volume of a right rectangular prism with whole-number side lengths by packing it with unit cubes, and show that the volume is the same as would be found by multiplying the edge lengths, equivalently by multiplying the height by the area of the base. Represent threefold whole-number products as volumes, e.g., to represent the associative property of multiplication. b. Apply the formulas V = l × w × h and V = B × h for rectangular prisms to find volumes of right rectangular prisms with whole number edge lengths in the context of solving real world and mathematical problems. c. Recognize volume as additive. Find volumes of solid figures composed of two nonoverlapping right rectangular prisms by adding the volumes of the non-overlapping parts, applying this technique to solve real world problems. |
New Jersey’s Move to Higher Student Standards and Outcomes
Changes in standards inevitably require changes in student assessments: higher standards lead to harder tests. New Jersey’s earlier NJASK exam was replaced in 2014 by the PARCC (now called the NJSLA), an exam aligned with the CCSS.[xiv] The newer exam was designed to be predictive of success in college-level courses (see the Appendix for a full discussion).
However, for the purposes of informing school finance policy, it is important to determine whether the state’s exams have become more difficult, particularly between the PARCC/NJSLA and NJASK. To answer that question, the authors compare outcomes on different New Jersey tests to the National Assessment of Educational Progress (NAEP), an exam designed as a stable measure of student achievement over time by tracking test outcomes.
TABLE 1
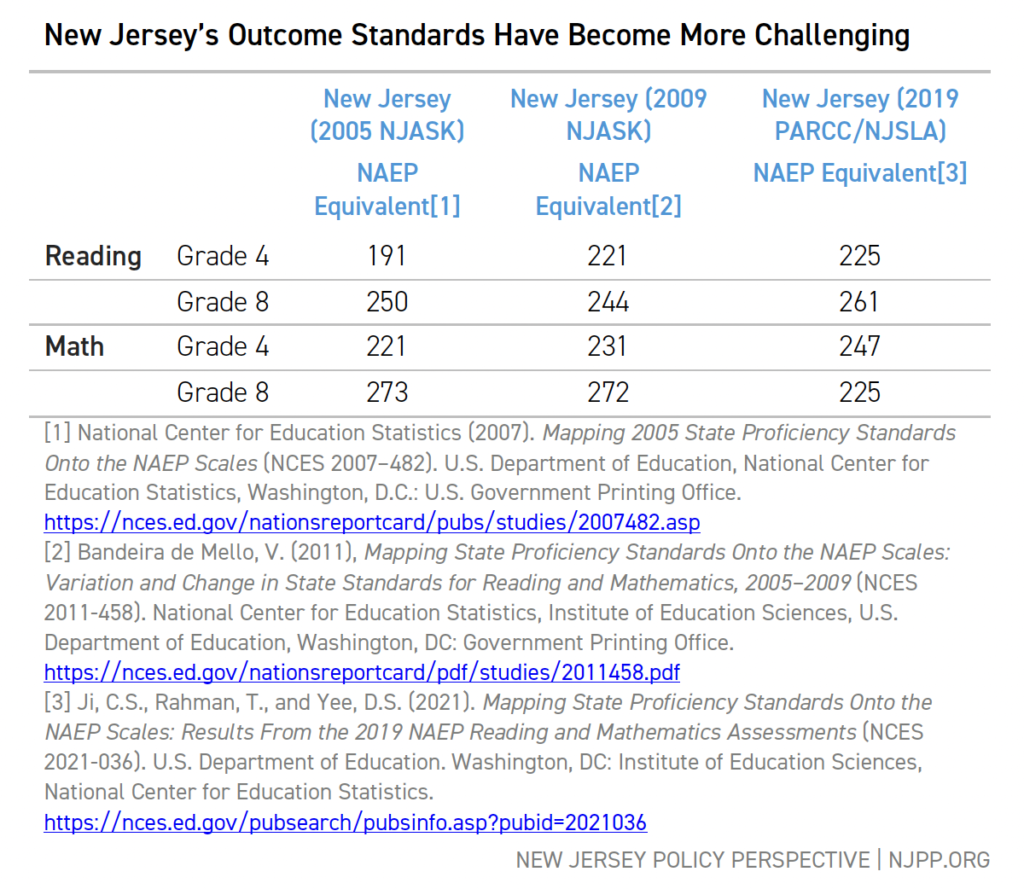
Table 1 reports the NAEP equivalent scores for New Jersey’s proficiency scores in 2005, 2009, and 2019 along with the NAEP equivalent scores for the PARCC’s college readiness standards.
For example, to be “proficient” in Grade 4 reading in 2005 required a NAEP equivalent score of at least 191. By 2009, the NAEP equivalent for proficiency had risen to 221, and by 2019 to 225.[xv] Grade 4 math standards have also increased.[xvi] In addition, while Grade 8 reading standards dropped slightly between 2005 and 2009, they increased under new assessments in 2019.
These comparisons across time show that New Jersey’s students are being held to a higher standard of performance than a decade ago. The original outcome goals of SFRA, which were used to set the original cost estimates, are out of date. New Jersey expects more of its students than it did in 2008; consequently, the state must recalibrate its cost estimates to reflect more rigorous standards.
Comparing New Jersey to Other High-Performing States
Before estimating the costs of achieving more rigorous standards, the authors explore the levels of student performance that are both challenging and reasonable. Comparing New Jersey’s NAEP scores to those in similar states provides a way to set outcome goals that are ambitious yet attainable. The following figures show instructive comparisons of New Jersey’s outcomes on NAEP scores along with those of Connecticut and Massachusetts — three Northeastern states ranked first, second, and third on the Grade 8 Reading NAEP in 2019.[xvii] Included for context are the proficiency standards for the NAEP and the NAEP equivalent scores for PARCC college readiness standards.
Figure 1 shows that Massachusetts students have scored, on average, around the level of the PARCC NAEP proficiency over the past several years in Grade 4 reading. New Jersey and Connecticut have done slightly less well.
FIGURE 1
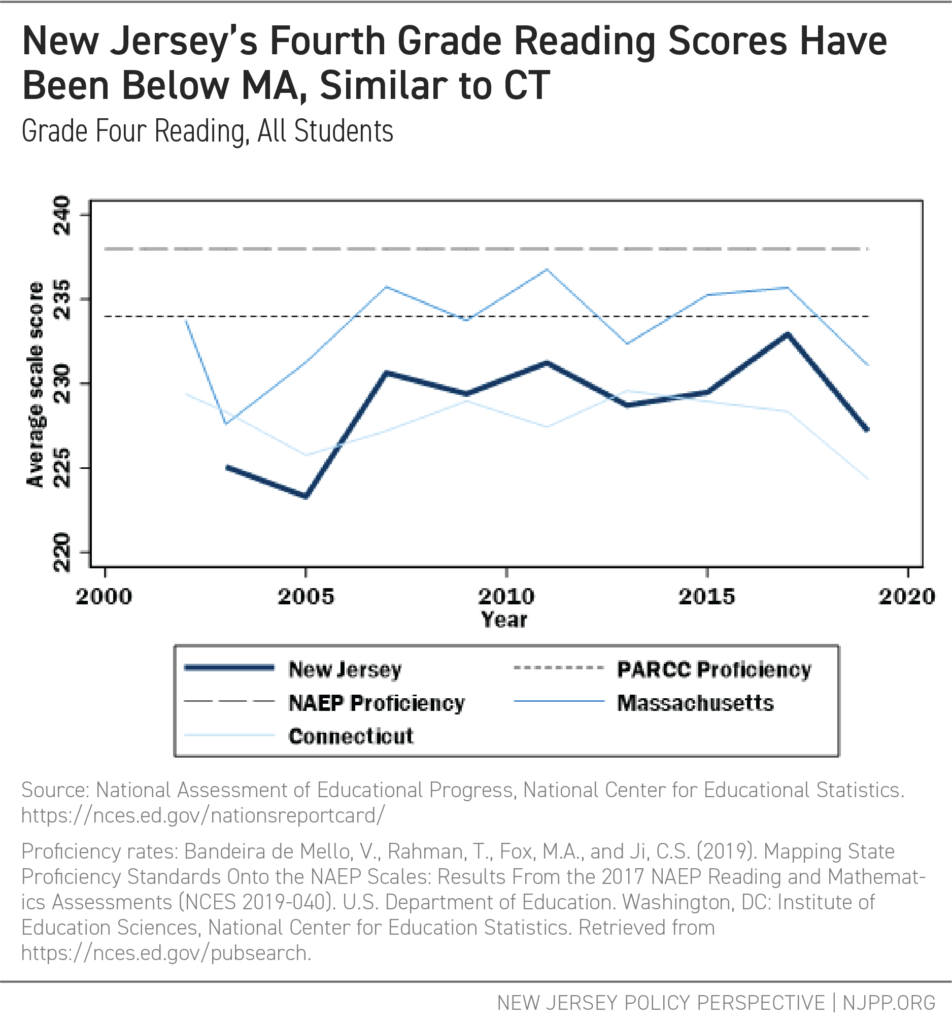
Figure 2 shows that for Grade 4 Math, Massachusetts achieves PARCC proficiency levels on average for a few years before falling off, while New Jersey achieves marginally lower levels.
FIGURE 2
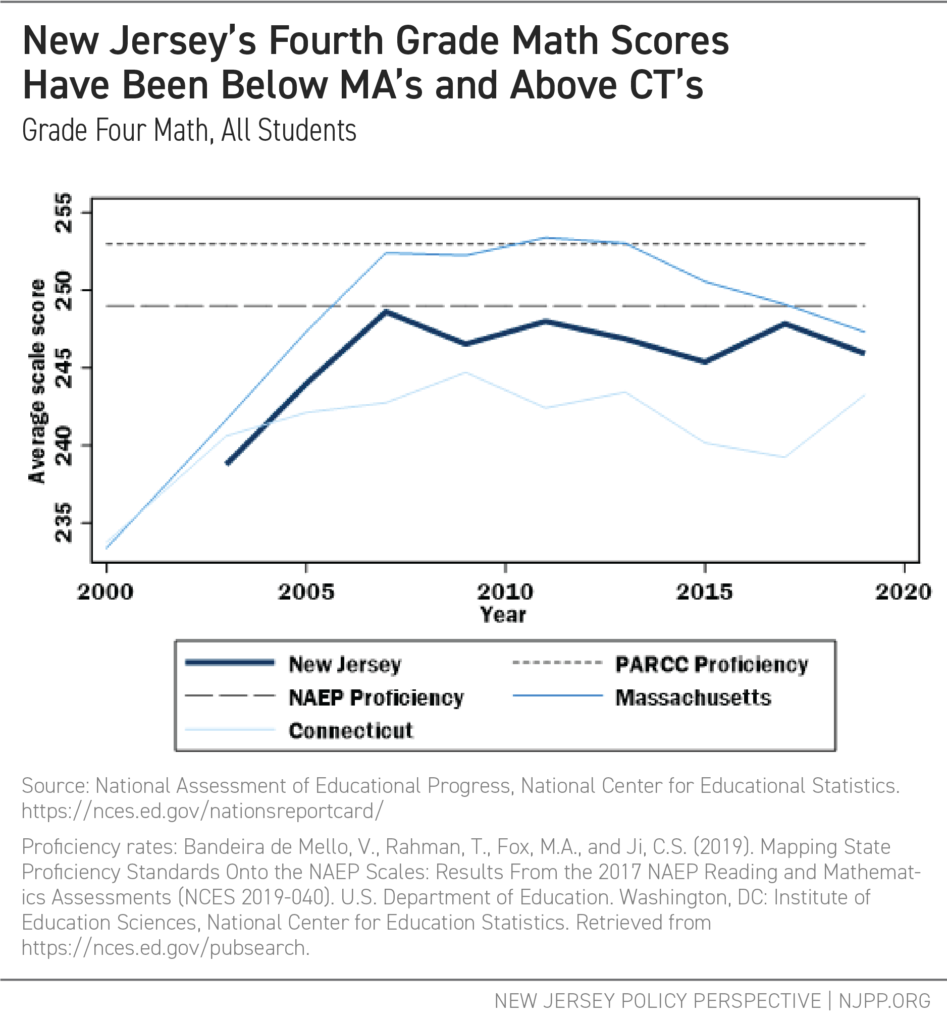
Figure 3 shows that, for Grade 8 reading, all three states have approached PARCC proficiency levels in recent years. For Grade 8 math (Figure 4), New Jersey has consistently scored between Massachusetts and Connecticut.
FIGURE 3
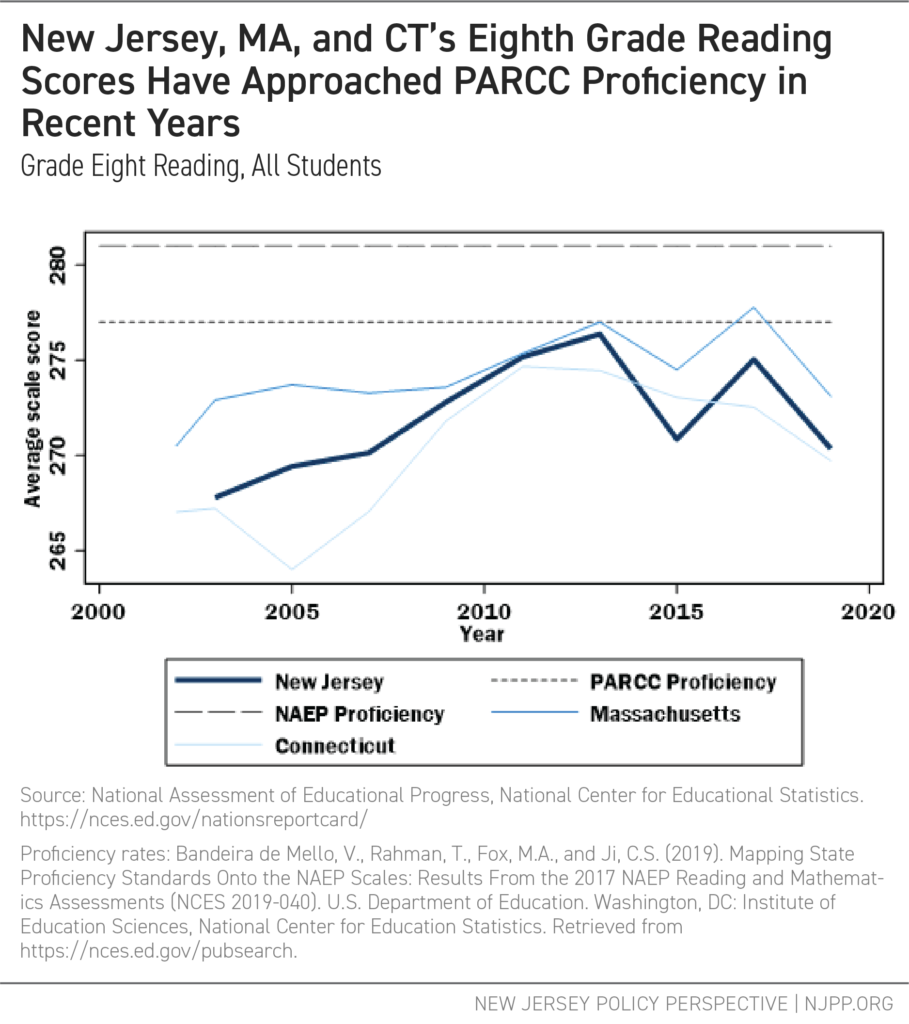
FIGURE 4
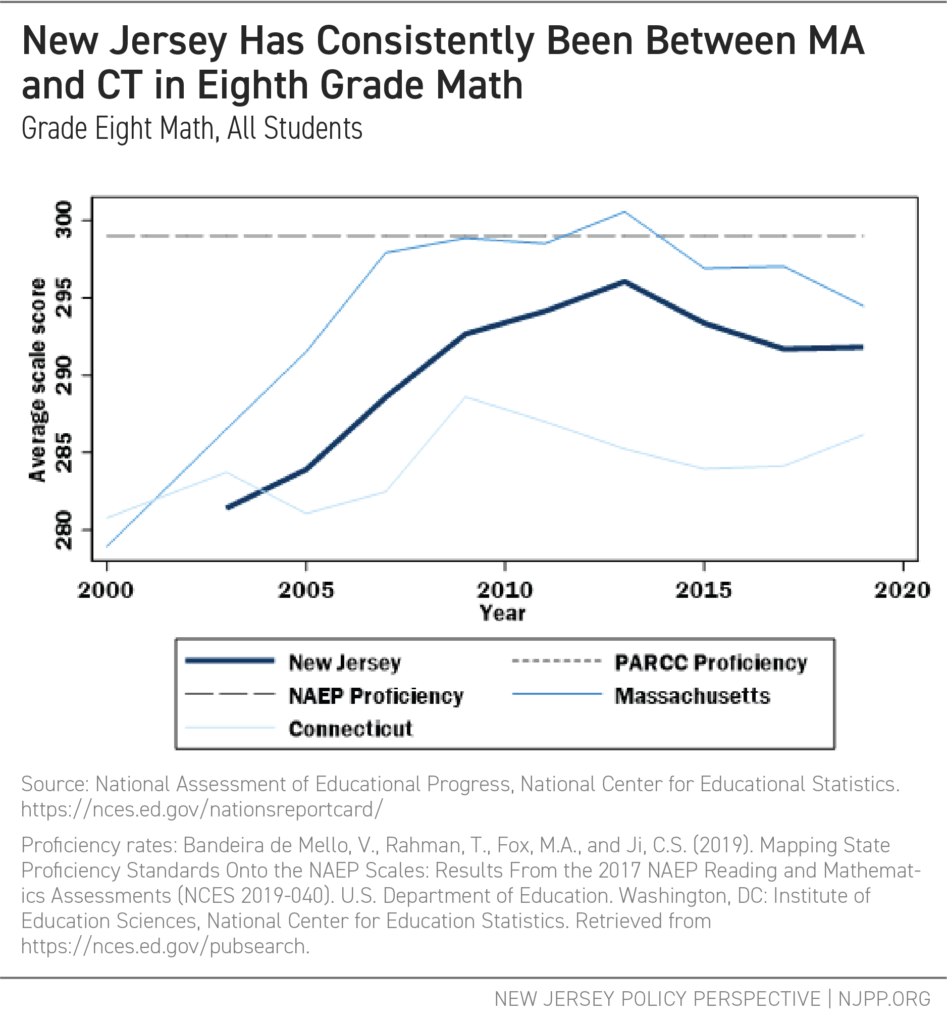
These comparisons suggest that while New Jersey is a high-performing state, there is room for improvement towards proficiency. Note: the figures above are averages; by definition, many students score below the scores shown, which means a large share of children are still not achieving proficiency.
Setting an ambitious yet reasonable outcome goal is necessary if New Jersey is to determine the costs of an adequate education. For purposes of this report’s analysis, the authors use Massachusetts’ current outcomes, on average, as an aspirational goal. This target, which is challenging but attainable, is the basis for the following estimation of the costs of providing equal and adequate educational opportunities for New Jersey children.
Determining Costs: Flaws in the Development in SFRA
In 2007, the New Jersey Department of Education (NJDOE) outlined the SFRA framework in A Formula For Success: All Children, All Communities.[xviii] The NJDOE intended for the SFRA formula to be based on real-world evidence: It would establish a statewide approach to financing New Jersey’s public schools, determining how much it would cost districts to ensure that their students would have equal and adequate opportunity to achieve common state standards.
NJDOE approached the cost analysis in two major ways. First, it hired consultants to look at average spending of a subset of school districts meeting specific outcome standards.[xix] This approach, known as “Successful Schools” analysis, is not a cost analysis, but a summary of average spending of districts serving relatively advantaged student populations who are more likely to meet these standards. This approach does not account for the different costs that districts in under-resourced communities will have in providing equal educational opportunity. As such, it offers little insight into how to set the student “weights” in the SFRA formula.
Second, the consultants convened panels of practitioners and experts from around the state to determine the resources needed to achieve the standards, while complying with the state’s curricular requirements.[xx] This approach, called Professional Judgment Panels (PJP), is of limited value for estimating costs associated with specific outcome goals, and even less so for estimating needs in high-poverty settings.[xxi] The flaws in this approach included:
- Panel recommendations drew largely on the experiences of panel members, many of whom never worked in high-poverty school districts. Of those who did, few had ever worked in schools with resources sufficient for disadvantaged students to achieve the desired outcomes.[xxii] As such, these panelists tended to request marginally more — not sufficiently more — than what they had experienced in their own jobs, underestimating actual costs.[xxiii]
- The PJP approach provided no external validation as to whether the proposed resources, and resulting expenditure levels, are statistically associated with the desired outcomes.[xxiv]
- During the translation from the cost study analysis to the SFRA framework, several adjustments were made, further compromising the link between cost analysis and formula design.[xxv] An example: the combined low-income and ELL weights for children who qualified for both was changed in the final law to be less than the sum of the independent LEP and low-income weights. This resulted in less funding for districts that had many low-income students who were not native English speakers.
Finally, the consultants and the NJDOE rejected a more comprehensive approach to estimating educational costs, called the “cost function” approach. They reasoned that there was insufficient data available to inform the formula and that the procedure involved complex statistical techniques that would not be understood by the parties whom the results would directly impact.[xxvi] Whether a cost function is too sophisticated for stakeholders to understand is a matter of debate. But over the past decade, more and better data has become available, and researchers have refined and improved their approaches to this type of analysis. In recent years, more states, such as New Hampshire,[xxvii] Vermont,[xxviii] and Kansas,[xxix] have engaged in more rigorous and relevant analyses, modeling statistical relationships between school spending, student outcomes, and various school and student characteristics to better understand and estimate costs of providing all children with equal educational opportunity.
Estimating Educational Costs
Using several years of detailed historical data is the most appropriate approach for understanding just how much it costs to provide equal educational opportunity to the wide variety of students in different settings.[xxx] This section applies a “cost function” approach to provide preliminary guidance for the recalibration of SFRA by using the National Education Cost Model (NECM), a part of the School Finance Indicators Database.[xxxi] The NECM uses actual fiscal and test score data to make reasonable, empirical estimates of education costs. Specifically, this section presents the per-pupil cost predictions from the NECM, set to Massachusetts average outcomes as the aspirational goal. Based on student characteristics, labor-market conditions, and district characteristics, the model produces a predicted per-pupil cost for each district to achieve Massachusetts’ average outcomes (see the insert below for a description).
Importantly, this is the only method of cost analysis that provides insights — and specific estimates — as to how much more it may cost to achieve higher or broader outcomes than narrower or lower ones. Put simply, the higher the goals, the higher the costs.[xxxii] With this method, legislators can better relate budgetary decisions to outcome expectations and consider those outcome expectations in the context of budget constraints.[xxxiii]
|
The National Education Cost Model A large and growing body of research shows adequate school funding leads to better educational outcomes. But determining how much is needed to reach a specific educational goal is a difficult task. The National Education Cost Model (NECM), developed by Dr. Bruce D. Baker of Rutgers University, uses student, school district, and testing data to estimate how much a district needs to spend to reach a specific educational goal. The basic procedure is to:
The NECM uses econometric methods to find a causal relationship between spending and outcomes. The model yields imprecise but useful estimates; they stand as guideposts that can aid policymakers in developing and improving school funding systems. Details about the NECM can be found in a peer-reviewed article published this past year.* Source: * Baker, B.D., Weber, M., & Srikanth, A (2021). Informing Federal School Finance Policy with Empirical Evidence. Journal of Education Finance, 47(1), pp 1-25. |
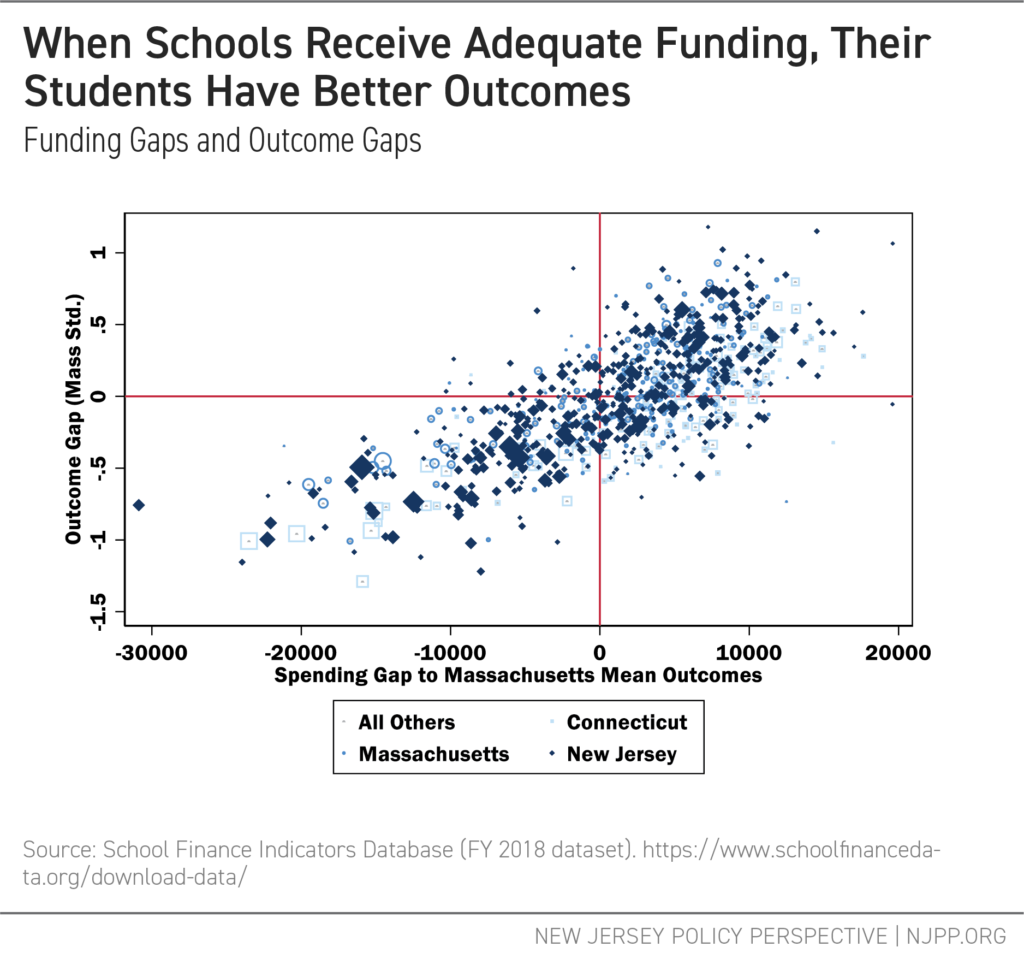
Overall, the estimates derived from this method show that most districts spend either more or less than what the model says is needed. For instance, Figure 5 plots Massachusetts, Connecticut, and New Jersey school districts, along with all other districts nationally, on two dimensions.[xxxiv] On the horizontal axis are estimates of the extent to which districts spend more or less than needed to achieve Massachusetts average outcomes. On the vertical axis are average outcomes (reading and math grades 3 to 8), relative to Massachusetts average outcomes.[xxxv]
Importantly, Figure 5 reveals that more adequate spending (relative to cost) is unmistakably associated with better student outcomes. When spending is above what the model estimates, student outcomes are higher. In contrast, when spending is below what the model predicts, student outcomes are lower, as shown in the lower-left quadrant for New Jersey. This raises an important question: Which students are most disadvantaged simply because they reside in these districts?
FIGURE 5
Next, Figure 6 highlights large districts with significant levels of poverty that are enrolling many of the state’s low-income students. It shows the districts within each state that enroll over 10,000 pupils in the 20 percent of districts with the highest level of child poverty. Each of the three states has a handful of districts in this category, and large, high-poverty districts invariably fall in the lower left quadrant. Connecticut districts in particular (squares) appear to be lower performing and, on average, less adequately funded. While New Jersey has more districts in this group, fewer of them are as poorly funded or poorly performing.
FIGURE 6
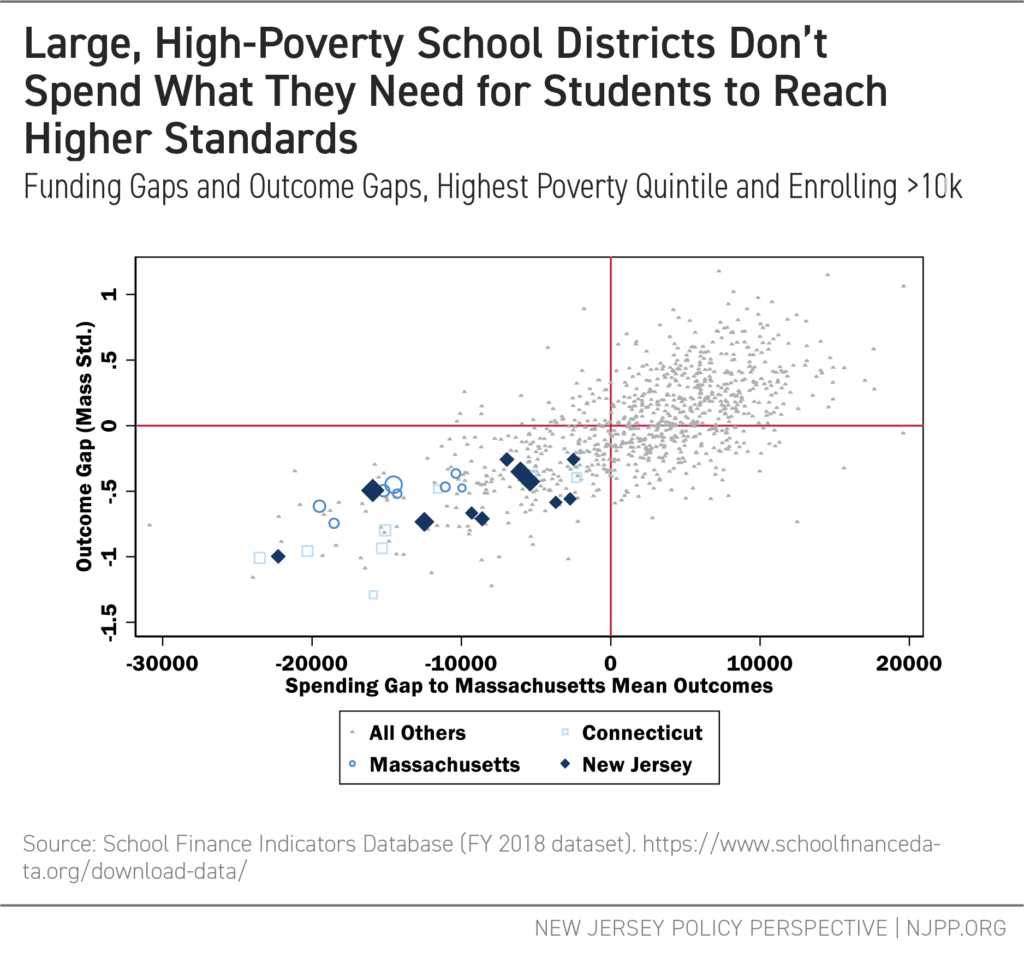
Table 2 summarizes the large, high-poverty, underfunded New Jersey districts identified in the model. While two of the districts have sizable Black populations — Newark and Trenton — the most notable feature is their large Hispanic/Latinx populations. Nine of 11 districts have more than 50 percent Hispanic/Latinx share, including four districts with more than 90 percent. This finding is consistent with prior reports that find systemic underfunding of Hispanic/Latinx districts in New Jersey.[xxxvi]
TABLE 2
Recalibrating SFRA for Current Educational Goals
This report’s analysis makes clear that schools that teach New Jersey’s most underserved students need more resources for an adequate education. The question before lawmakers is: How much more? The NECM produces estimates of educational costs that provide guidance for changing the base costs and weights in the SFRA so the state can drive resources where they are needed most.
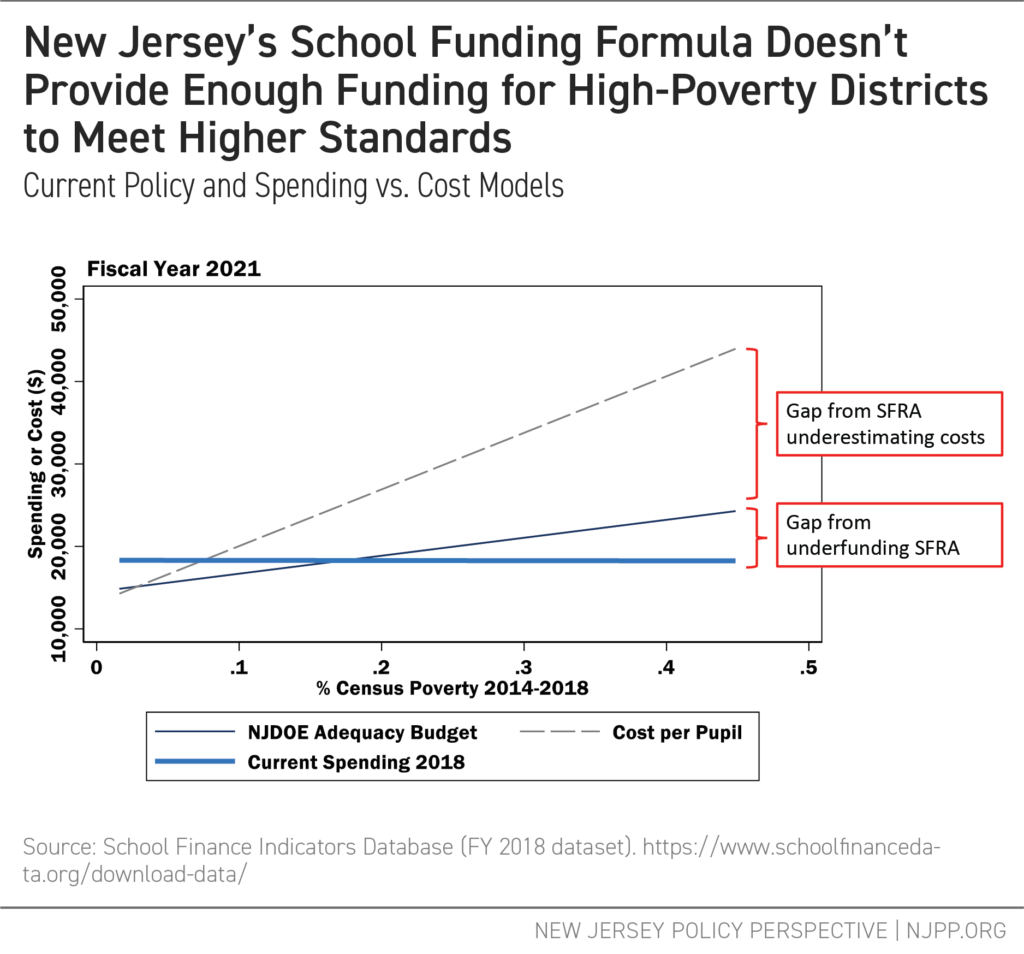
The SFRA now allocates somewhat more funding to districts with higher levels of poverty. But the degree of additional funding for higher-poverty districts in the SFRA is inadequate. While it estimates costs for low-poverty, wealthier districts fairly accurately, the SFRA fails to appropriately account for the cost of educating children in higher-needs districts. For instance, Figure 7 shows that the current SFRA adequacy budget (the thin blue line) rises slightly as poverty increases, meaning that more revenue should flow to districts with more students who are underserved. Unfortunately, current spending (the thick blue line) doesn’t match the SFRA budget, a consequence of not fully funding the SFRA formula.
However, even if the SFRA was fully funded, the amount spent still wouldn’t be enough for high-poverty districts to reach rigorous standards (again, Massachusetts average outcomes), according to the NECM estimates (the dashed grey line). The students in these districts suffer from two gaps: one created by the underfunding of the current SFRA formula, and the other from setting that formula’s base costs and weights too low.
FIGURE 7
These results are not surprising, considering that the original SFRA costs study was based largely on the needs of more affluent districts. Overall, the formula isn’t progressive enough to provide equal educational opportunity. And the situation is even worse because the state fails to appropriately fund SFRA targets that are already inadequate.
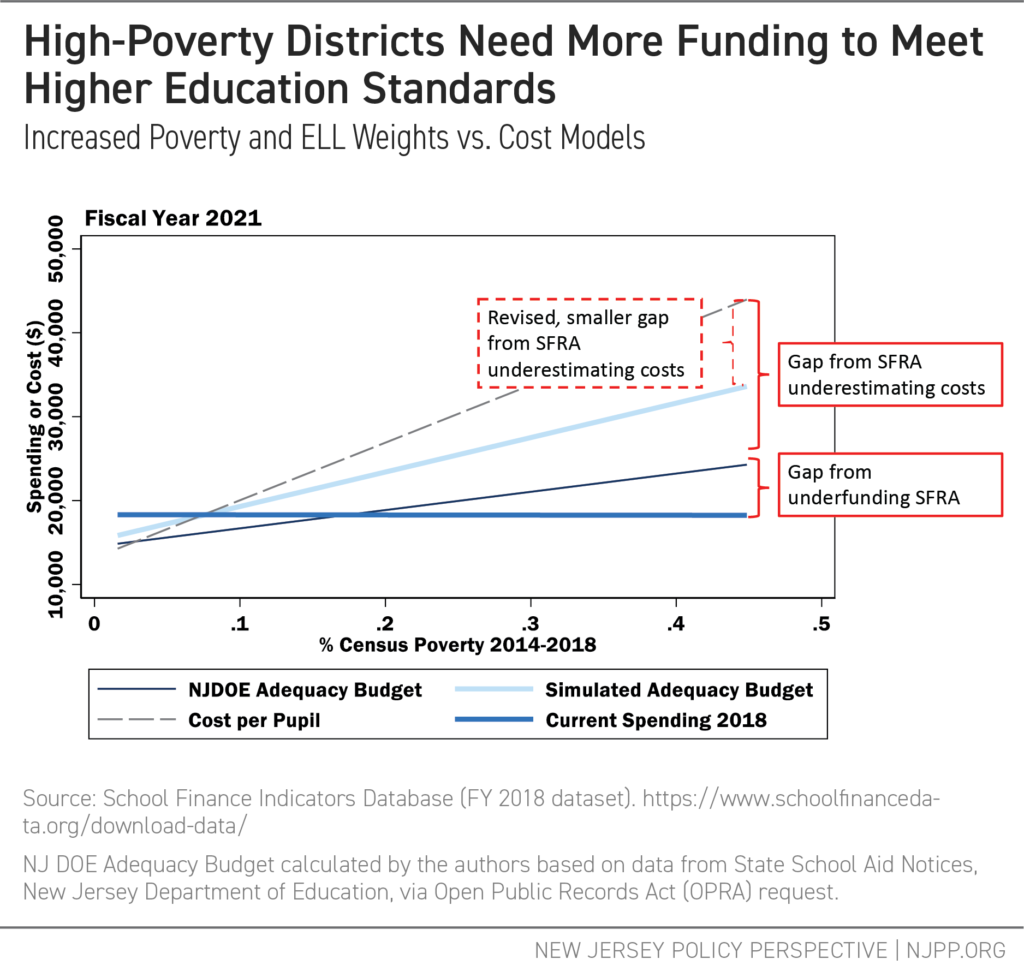
Finally, Figure 8 offers a handful of modifications that would move the formula closer to national cost-model targets for Massachusetts outcomes. Currently, a student from a low-income family who is an English language learner (ELL) would not receive the sum of the two separate weights, but instead would receive the poverty weight and one-quarter of the ELL weight. This combination weight approach is unhelpful because it underestimates the true cost of adequately educating English language learners living in poverty. For instance, the poverty weighting addresses a general population condition (social/economic context) of school districts, not a specific programming cost for a child from a low-income family. In contrast, ELL weighting intends to address specific costs of support services and personnel to meet individual students’ needs.
Therefore, Figure 8 eliminates the combination weight, providing the full sum of weights for students who are both ELL and low-income. It also raises the low-income and ELL weights to a full 1.0 (double the cost per non-low income or non-ELL child), consistent with published empirical work, but marginally less than the national cost model here.[xxxvii] While changing the weights does not close the entire gap, it does substantially move the cost estimates toward the target set by a model based on actual data.
FIGURE 8
Recommendations
This report makes clear that the original SFRA cost estimates are insufficient to reach even the older, outdated outcomes goals enacted in 2008 and fails low-income students of color by giving their schools too few resources to reach the state’s learning goals. But, even if those analyses were sufficient, even if the formula largely aligned with the findings, and even if the state had fully funded the formula for the past decade (which it has not), that formula would still be outdated and insufficient to support today’s standards and student outcome expectations. The result is that the state must:
- Fully fund the SFRA. As a first step, the Governor and Legislature should fully fund the current formula. As this report shows, the SFRA does not provide nearly enough funding to schools enrolling large numbers of students in poverty; however, the formula does drive at least some additional revenue to these schools, where it is needed. Fully funding the SFRA does not require any changes in statute; all the state needs to do is follow its own law, and the adequacy gap will begin to shrink.
- Update the SFRA formula. Next, the base spending and student weights in the funding formula need to be adjusted to better reflect current school and student needs. The state should use modern, data-based analysis to set both spending and outcome targets.
New Jersey cannot afford to get it wrong again. Students in these high-needs districts cannot get back a decade of underfunding. The state has left a generation of low-income and children of color behind. The bar for student achievement has been raised, and so, too, has the cost of achieving that bar equally for all New Jersey children — even as the SFRA remains unchanged and underfunded. Now is the time to recalibrate and reinvest in the future of New Jersey and its students.
Appendix: National Trends in Standards and Assessments
Determining the costs of providing an adequate education requires setting a standard for student outcomes. For purposes of cost estimation, that standard must be sufficiently precise and based on existing measures for which there are available data. During the past decade, federal initiatives and numerous states have converged on a framing of standards for elementary and secondary schools focused on “college and career readiness.”[xxxviii] This policy emphasis arises from studies in years prior that stressed the lack of preparedness of U.S. high school graduates for college-level work, leading to excessive numbers of students placed in remedial college coursework. The need for remediation has also been accompanied by a marked drop in our nation’s global competitiveness with respect to college completion rates. Thus, to a large extent, college and career readiness standards have been developed with a focus on mitigating this particular problem, ensuring that high school graduates can succeed in college-level coursework and achieve timely completion of postsecondary degrees.[xxxix]
Standard setting for college and career readiness has two key components: curricular frameworks and assessments. Developing curricular frameworks involves identifying what high school graduates should know and be able to do to succeed in college-level coursework, as laid out in the Common Core State Standards, and then working backward to develop grade-level standards that define the knowledge and skills students should gain throughout their elementary and secondary school experience.[xl] These standards should then guide the development of assessments of student proficiency.[xli] Both curricular frameworks and assessments are designed to be predictive of college and career readiness; that is, students who have successfully completed these curricular requirements, as evidenced on the assessments, should be more likely to succeed in college-level coursework, persist in postsecondary education, and complete postsecondary degrees. New Jersey, like many other states, has adopted “College and Career Ready Standards.”[xlii]
On the assessment side of this puzzle—measuring student preparedness—two separate consortium assessments emerged to test whether students were proficient in areas identified in the Common Core State Standards: the Partnership for the Assessment of Readiness for College and Careers (PARCC) and the Smarter Balanced Assessment Consortium (SBAC).
Again, much of the interest in college and career readiness and the Common Core State Standards arose from concerns that students were graduating from high school and achieving “proficiency” on state assessments but were unable to succeed in entry-level coursework in public colleges and universities such as the City University of New York system.[xliii] Research by the College Board showed that students scoring 1150 or higher on the SAT were more likely to succeed in first-year college coursework.[xliv] Building on this work, several researchers have proposed a statistical definition of college readiness using standardized test scores and other measures to predict college success.[xlv] For example, Wiley et al. (2011) defined college readiness as having at least a 65% probability of achieving a college grade point average of B- or higher, based on measures of high school students’ SAT scores, high school grade point average, and an index of the academic rigor of courses taken.[xlvi]
Statistical definitions of college readiness have had a key influence on the design of modern state assessments as well as the assignment of cut scores intended to denote proficiency for these assessments. Therefore, the equating of student achievement on test scores to college and career readiness can also guide how outcome measures are set for the purpose of modeling the costs of achieving desired levels of educational outcomes. Prior to the Common Core State Standards and the emergence of college and career readiness standards, most states never assessed the validity of chosen cut scores when developing their state assessments; that is, they never asked the following: Does making the cut lead to greater likelihood of some bigger goal, like succeeding in college level coursework?
Prior to switching to PARCC, New York State engaged Daniel Koretz, PhD, of the Harvard Graduate School of Education to conduct an analysis of their state assessments, including the identification of cut scores that would better reflect college readiness. Dr. Koretz took an approach similar to that of researchers at the College Board, assessing what scores on state assessments were associated with achieving 1150 or higher on the SAT and eventually succeeding in college-level coursework.[xlvii] The consortium assessments SBAC and PARCC established their cut scores on similar bases, with the intent that students scoring proficient or higher would have a significantly higher likelihood of successfully completing college-level coursework.[xlviii]
State assessments can also be measured against the National Assessment of Educational Progress (NAEP), which establishes cut scores for “basic” and “proficient” achievement levels (National Center for Education Statistics [NCES], 2019). The NAEP standards tend to be quite high relative to most state cut scores and even relative to the new SBAC and PARCC assessments.[xlix] SBAC standards also differ from PARCC standards. For example, statistical analysis by the American Institutes for Research (Phillips, 2016) found:
- Smarter Balanced college-ready standards (Level 3) are comparable in difficulty to the NAEP basic levels.
- Smarter Balanced college-ready standards (Level 3) are significantly below PARCC college-ready standards (Level 4) by about one quarter of a standard deviation.[l]
However, the NAEP standards were not set statistically to represent “college readiness.” As noted by Phillips (2016), NAEP’s proficiency standards are high, at least with respect to SBAC. Alternatively, it may be that SBAC standards are too low, given that SBAC college readiness standards are also lower than PARCC standards.
End Notes
[i] Bruce Baker and Mark Weber (2020). School Funding in New Jersey: A Fair Future for All. New Jersey Policy Perspective; Trenton, NJ. https://www.njpp.org/publications/report/school-funding-in-new-jersey-a-fair-future-for-all/
[ii] Jackson, C. K. (2018). Does School Spending Matter? The New Literature on an Old Question. National Bureau of Economic Research. https://www.nber.org/papers/w25368.pdf
[iii] Baker, B.D., Weber, M., & Srikanth, A (2021). Informing Federal School Finance Policy with Empirical Evidence. Journal of Education Finance, 47(1), pp 1-25.
[iv] Baker and Weber (2021). [Previous report] New Jersey Policy Perspective; Trenton, NJ. [link TBD]
[v] Duncombe, W. D., & Yinger, J. (2005). How much more does a disadvantaged student cost? Economics of Education Review, 24(5), 513–532.
[vi] By law, the Commissioner of Education releases an Education Adequacy Report every three years that adjusts both the base costs and the weights. These changes are not recalibrations of the formula as much as they are adjustments to the original cost estimates.
[vii] Educational Adequacy Report, New Jersey, 2020. (2019). New Jersey Department of Education. https://www.nj.gov/education/stateaid/1920/EARFY20.pdf
[viii] Catherine Gewertz (September 30, 2015). “The Common Core Explained.” Education Week. https://www.edweek.org/teaching-learning/the-common-core-explained/2015/09
[ix] Dana Goldstein (December 6, 2019). “After 10 Years of Hopes and Setbacks, What Happened to the Common Core?” The New York Times. https://www.nytimes.com/2019/12/06/us/common-core.html
[x] As the New Jersey State Board of Education President at the time explained: “It won’t be substantially different… there were some changes, but there were not major changes.” See: Adam Clark (May 4, 2016). “N.J. revises, renames Common Core academic standards.” NJ.com https://www.nj.com/education/2016/05/nj_common_core_standards_christie.html
[xi] Common Core State Standards Initiative; What Parents Should Know. http://www.corestandards.org/what-parents-should-know/
[xii] New Jersey Core Curriculum Content Standards for Mathematics (2008) https://www.state.nj.us/education/cccs/2004/s4_math.pdf
[xiii] New Jersey Student Learning Standards For Mathematics (2016) https://www.nj.gov/education/cccs/2016/math/standards.pdf
[xiv] The NJASK is the New Jersey Assessment of Skills and Knowledge; see: https://www.nj.gov/education/assessment/history.shtml The PARCC is the Partnership for the Assessment of Readiness for College and Career: see: https://www.state.nj.us/education/archive/sca/parcc/
[xv] For a discussion of standardized testing and “college readiness,” see the Appendix.
[xvi] Grade 8 math standards for the PARCC/NJSLA are not included for 2019 as the PARCC/NJSLA provides a separate exam for Grade 8 students who are enrolled in algebra courses; the student populations between the earlier and later tests are, therefore, not equivalent.
[xvii] The Nation’s Report Card; State Profiles, 2019. https://www.nationsreportcard.gov/profiles/stateprofile?chort=2&sub=RED&sj=AL&sfj=NP&st=MN&year=2019R3
[xviii] A Formula for Success: All Children, All Communities. (December, 2007) New Jersey Department of Education. https://www.nj.gov/education/sff/reports/AllChildrenAllCommunities.pdf
[xix] The consultants, Augenblick, Palaich and Associates, used these outcome standards:
75% Proficiency on grade 3 and 4 NJASK Language Arts in 2004-05
62% Proficiency on grade 3 and 4 NJASK Math in 2004-05
66% Proficiency on the Grade 8 Language Arts assessment in 2004-05
49% Proficiency on the Grade 8 Math Assessment in 2004-05
79% Proficiency on the High School Proficiency Assessment in Language Arts in 2004-05
64% Proficiency on the High School Proficiency Assessment in Math in 2004-05 (Table 1, APA)
[xx] Typically, these focus groups are provided a blank slate as a starting point, creating their recommendations from scratch. New Jersey Department of Education (NJDOE) officials, however, decided instead to pre-populate the templates with their own recommendations and permit the focus groups to adjust their recommendations if they saw fit. The panels, therefore, were working from a baseline that may have been wholly inadequate, and may have consequently underestimated what they would otherwise have found was the cost for providing an adequate education.
[xxi] Baker, B. D., Taylor, L. L., & Vedlitz, A. (2008). Adequacy estimates and the implications of common standards for the cost of instruction. National Research Council, 9(2), 24-38.
[xxii] Baker, B. D. (2006). Evaluating the reliability, validity, and usefulness of education cost studies. Journal of Education Finance, 32(2), 170-201.
[xxiii] Baker, B. D. (2009). Evaluating the “Concrete Link” between Professional Judgment Analysis, New Jersey’s School Finance Reform Act and the Costs of Meeting State Standards in Abbott Districts. https://schoolfinance101.files.wordpress.com/2011/10/baker-pjp-sfra-report-web.pdf; Baker, B. D. (2006). Evaluating the reliability, validity, and usefulness of education cost studies. Journal of Education Finance, 32(2), 170-201.
[xxiv] Baker, B. D., Taylor, L. L., & Vedlitz, A. (2008). Adequacy estimates and the implications of common standards for the cost of instruction. National Research Council, 9(2), 24-38.
[xxv] Baker, B.D., Atchison, D., Levin, J., Kearns, C. (2020). “State finance reform vignette: New Jersey.” New Hampshire Commission to Study School Funding https://carsey.unh.edu/sites/default/files/media/2020/06/20-11882_5._primer_statevignettes_new_jersey_air_formatted_v3.pdf
[xxvi] Dupree, A., & Silverstein, J. (2006). Report on the Cost of Education. https://dspace.njstatelib.org/xmlui/bitstream/handle/10929/22618/e242006f.pdf?sequence=1&isAllowed=y
[xxvii] Atchison, D., Levin, J., Baker, B. D., Kearns, C. (2020) New Hampshire Commission to Study School Funding: Final Report. https://carsey.unh.edu/sites/default/files/media/2020/09/20-12685_nh_final_report_version_v5_draft_1.pdf
[xxviii] Kolbe, T., Baker, B. D., Atchison, D., Levin, J., & Harris, P. (2021). The additional cost of operating rural schools: Evidence from Vermont. AERA Open, 7, 2332858420988868.
Kolbe, T., Baker, B.D., Atchison, D., & Levin, J. (2019). Pupil Weighting Factors Report. State of Vermont, House and Senate Committees on Education. https://legislature.vermont.gov/assets/Legislative-Reports/edu-legislative-report-pupil-weighting-factors-2019.pdf
[xxix] Taylor, L., Willis, J., Berg-Jacobson, Jaquet, K., & A., Capras, R. (2018). Estimating the Costs Associated with Reaching Student Achievement Expectations for Kansas Public Education Students: A Cost Function Approach. San Francisco, CA: WestEd.
Duncombe, W., & Yinger, J. (2005). Estimating the cost of meeting student performance outcomes adopted by the Kansas State Board of Education. A study prepared for the Kansas Division of Legislative Post Audit.
[xxx] Duncombe, W., & Yinger, J. (2005). How much more does a disadvantaged student cost? Economics of Education Review, 24(5), 513-532.
Duncombe, W., & Yinger, J. (1999). Performance standards and educational cost indexes: you can’t have one without the other. Equity and adequacy in education finance: Issues and perspectives, 260, 261.
[xxxi] Baker, B.D., Di Carlo, M., Weber, M. (2021) The Adequacy of School District Spending in the U.S. Albert Shanker Institute. https://www.schoolfinancedata.org/wp-content/uploads/2021/03/SFID_DCDbrief_Mar2021.pdf
See also: Baker, B.D., Weber, M., Srikanth, A. (2021) Informing Federal School Finance Policy with Empirical Evidence. Journal of Education Finance, 47(1)
[xxxii] As an example: Both the 2006 and 2018 legislatively sponsored studies of outcome-based costs in Kansas revealed significant sensitivity of costs to outcome goals. Baker, B.D., Atchison, D., Levin, J., Kearns, C. (2020) State finance reform vignette: Kansas. New Hampshire Commission to Study School Funding https://carsey.unh.edu/sites/default/files/media/2020/06/20-11882_5._primer_statevignettes_kansas_air_formatted_v5.pdf
[xxxiii]Baker, B.D., Atchison, D., Levin, J., Kearns, C. (2020) Setting outcome goals and standards – from a formal to a functional definition of adequacy. New Hampshire Commission to Study School Funding https://carsey.unh.edu/sites/default/files/media/2020/06/20-11882_4._primer_adequacystandard_air_formatted_v5.pdf
[xxxiv] The statistical model used here is “race-sensitive,” meaning it takes into account the racial profile of the school districts in the dataset used. In previous work we discussed the importance of race and ethnicity in modeling educational costs, with an understanding that systemic racism has played a large role in creating conditions where students in majority-Black or majority-Hispanic school districts suffer from structure inequities. See: [reference to previous report]
[xxxv] The outcomes are “standardized” around 0, meaning test outcomes in different states are translated to a common scale where 0 represents the average.
[xxxvi] Bruce Baker and Mark Weber (2020). School Funding in New Jersey: A Fair Future for All. New Jersey Policy Perspective; Trenton, NJ. https://www.njpp.org/publications/report/school-funding-in-new-jersey-a-fair-future-for-all/
[xxxvii] Duncombe, W., & Yinger, J. (2005). How much more does a disadvantaged student cost? Economics of Education Review, 24(5), 513-532.
[xxxviii] U.S. Department of Education. (n.d.). College- and career-ready standards. Washington, DC: US Department of Education. https://www.ed.gov/k-12reforms/standards
[xxxix] National Research Council. (2008). Common standards for K–12 education?: Considering the evidence: Summary of a workshop series. Washington, DC: National Academies Press.
[xl] See the Common Core State Standards Initiative: http://www.corestandards.org/.
[xli] Polikoff, M. S., Porter, A. C., & Smithson, J. (2011). How well aligned are state assessments of student achievement with state content standards? American Educational Research Journal, 48(4), 965–995.
[xlii] Common Core State Standards Initiative. (2020). Standards in your state. http://www.corestandards.org/standards-in-your-state/
[xliii] Cooper, B. S., Cilo, M. R., & Baker, B. D. (1999). Making the transition from school to college: The case of New York City Public Education. In M. Alampi & P. M. Comeau (Eds.), American education annual: Trends and issues in the educational community (1998-1999). New York, NY: Gale Research
[xliv] Kobrin, J. (2007). Determining SAT benchmarks for college readiness (Research Notes RN-30). New York, NY: College Board, Office of Research and Analysis. https://files.eric.ed.gov/fulltext/ED562605.pdf
[xlv] Fina, A. D., Dunbar, S. B., & Welch, C. J. (2018). Establishing empirical links between high school assessments and college outcomes: An essential requirement for college readiness interpretations. Educational Assessment, 23(3), 157–172.
[xlvi] Wiley, A., Wyatt, J., & Camara, W. J. (2011). The development of a multidimensional college readiness index (Research Report 2010-3). New York, NY: College Board.
[xlvii] New York State Education Department. (2010). Statement on research related to proficiency on state assessments. http://usny.nysed.gov/scoring_changes/
[xlviii] Smarter Balanced Assessment Consortium. (2017). Smarter Balanced cut score validation: Final report. Santa Clara, CA: Author. https://portal.smarterbalanced.org/library/en/smarter-balanced-cut-score-validation-final-report.pdf
[xlix] Rahman, T., Bandeira de Mello, V., Fox, M. A., & Ji, C. S. (2019). Mapping state proficiency standards onto the NAEP scales: Results from the 2017 NAEP reading and mathematics assessments (NCES 2019-040). Washington, DC: National Center for Education Statistics.
[l] Phillips, G. (2016). National benchmarks for state achievement standards. Washington, DC: American Institutes for Research. https://www.air.org/sites/default/files/downloads/report/National-Benchmarks-State-Achievement-Standards-February-2016_rev.pdf