New Jersey thrives when every resident has their basic needs met. A pathway to achieve this is through reform of Work First New Jersey (WFNJ). WFNJ is the state’s umbrella program for cash assistance and job-related supports, covering three distinct components: the Temporary Assistance for Needy Families (TANF) program for families with children, General Assistance for adults without dependent children, and Emergency Assistance for households in crisis.[1]
The largest of the three is the TANF program, intended to lift families out of poverty and provide support as parents search for employment and build toward economic stability.[2] Yet, over time, this program has fallen short of that goal. Stagnant benefits, outdated eligibility rules, and a design that penalizes recipients have left families struggling to secure housing, maintain food security, and access the supports necessary for long-term economic stability.[3]
Gov. Mikie Sherrill’s administration and the legislature have an opportunity to reexamine how the state supports families with the lowest incomes. Put simply, the TANF program has not kept pace with the realities of life in the Garden State. Benefit amounts have lost more than a third of their purchasing power since 1998.[4] Eligibility rules make it difficult for families to access, save, and gradually exit the program. And because poverty in New Jersey is disproportionately experienced by Black and Hispanic/Latinx households, TANF’s restrictive rules and outdated benefit amounts have their largest consequences on the very communities already facing the steepest economic barriers.[5] This is true both for many families who manage to enroll in TANF, and for those who are shut out. This exclusion is a legacy of the racialized narratives that originally shaped TANF’s assumptions about who is “deserving” of help.[6]
Yet TANF is a cornerstone of New Jersey’s safety net. When adequately designed and funded, cash assistance provides families with financial stability and flexibility, improves children’s health and educational outcomes, and generates long-term returns that benefit entire communities.[7]
This report examines TANF’s gradual decline over 30 years and makes the case for the following reforms to strengthen the program:
- Raising benefit levels, indexing them to inflation, and directing more TANF funding toward direct cash assistance
- Updating eligibility thresholds and time limits to reflect today’s economic realities
- Aligning work requirements with lived experiences and needs
Nearly Three Decades of Decline
TANF’s decline is the result of deliberate policy decisions. New Jersey set that trajectory beginning in 1997 by adopting rules stricter than federal law required. In the decades since, lawmakers have repeatedly chosen to leave those rules in place, even as the cost of living has soared and need has grown. The result is a program in steady retreat across three measures: the purchasing power of the TANF grant, the number of families TANF reaches, and the adequacy of the program’s design.
Benefits That Buy Less Each Year
Monthly grant amounts in New Jersey vary based on factors such as family size, income, and legal status, but to convey the scale of its growing shortfall, consider a family of three receiving the maximum benefit: $559 a month, or $6,708 a year in 2026.[8] By contrast, the original 1998 grant of $424 a month, worth about $850 in 2026 dollars, provided far more support than today’s benefit.[9]
Adjusted for inflation, today’s grant has lost more than one-third of its value.[10] What once covered a month’s groceries with some money left over for rent or utilities now barely covers food alone. For context, an analysis on typical household costs finds that a New Jersey family of three spends almost $10,300 a year on food, nearly $3,600 more than the entire annual TANF grant.[11]

The gap between what families receive and what they need to survive continues to widen. The 2026 federal poverty level (FPL) for a family of three is $27,320, yet TANF’s annual benefit amount is less than a quarter of that.[12] A family of three needs income closer to $80,000, roughly 300 percent of the FPL, to cover basic necessities without making trade-offs between essentials.[13] Most families receive less than the maximum grant, so what TANF provides falls even further short of what families need. The tens of thousands of New Jerseyans living in persistent and deep poverty (income below 50 percent of the FPL) feel this shortfall most profoundly.[14]
 The latest meaningful adjustment to TANF’s cash assistance came in 2019-2020, when maximum monthly grant levels increased. For a family of three, this meant an increase from $424 to $559.[15] That increase was meaningful, but it was a one‑time event that partially restored the value TANF had lost over the prior two decades of inflation. Since then, the grant has continued to fall behind New Jersey’s rapidly rising housing, food, and transportation costs.[16]
A one-off increase temporarily slows the erosion of TANF’s value but does not reverse it. A stagnant monthly grant is not a solution. In the seven years since that increase, families have had to stretch already-thin budgets even further, likely giving up other basic needs to make ends meet.
A Safety Net That Reaches Fewer Families
TANF serves fewer families today than it did when it first rolled out, leaving more families without the cash assistance the program was created to provide. But a shrinking TANF caseload is not evidence of reduced need — it is the result of policy decisions that have steadily narrowed who can get assistance.
In 2025, TANF served an average of 26,700 people across New Jersey’s 21 counties, a sharp drop from more than 31,300 the year before, according to the latest Current Program Statistics report.[17] This decline does not signal less poverty. In fact, poverty in New Jersey remains widespread and entrenched: in 2024, roughly 860,000 residents lived below the federal poverty level.[18] The shrinking caseload instead reflects how difficult the program has become to access and remain on.
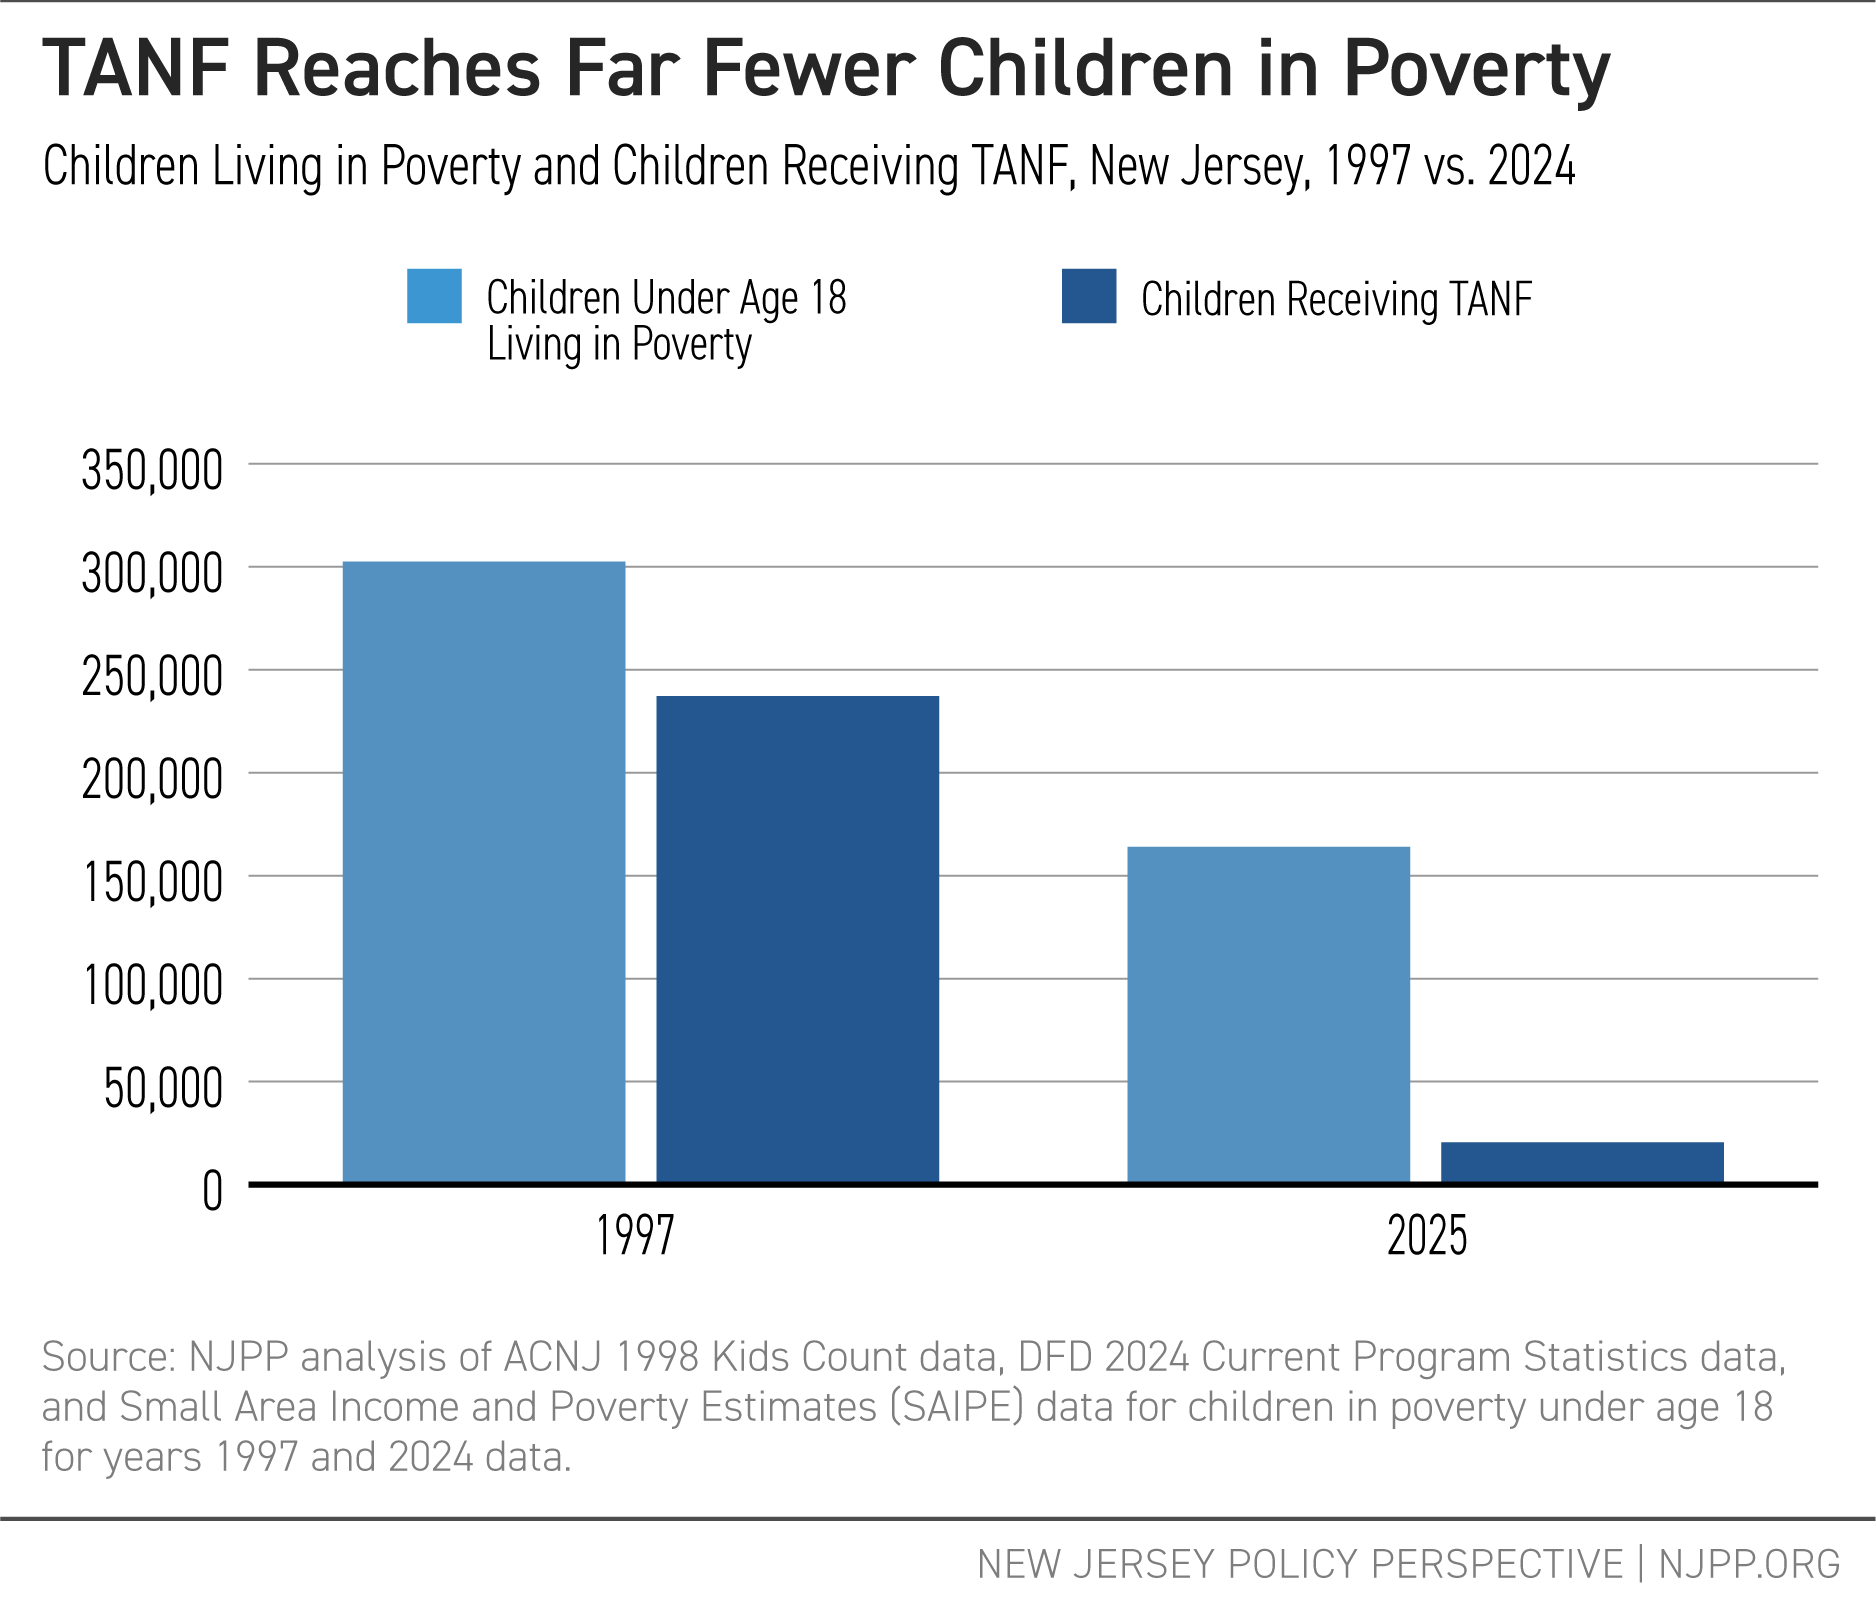
Before TANF replaced its predecessor, Aid to Families with Dependent Children (AFDC), New Jersey assisted far more families living below the FPL — 72 per 100 families living in poverty, well above the national average.[19] By 2022-2023, that number had fallen to just 11 families per 100, far below the national average of 20. If TANF reached the same number of families in poverty that AFDC had, an estimated 98,000 more families would be receiving support now.[20] Tens of thousands of families who would have qualified for TANF were, and continue to be, excluded by design.
What that retreat has meant for children in particular comes through most clearly in the numbers. NJPP analysis finds that TANF’s shrinking caseload has stripped away assistance that would have supported thousands more children statewide, a cumulative loss built up over years of declining reach.[21]
The steepest declines are concentrated in high‑poverty counties such as Camden, Essex, and Hudson, areas where Black and Hispanic/Latinx communities also make up significant shares of the population.

The program’s contraction has fallen hardest on the very communities that face the highest barriers to economic opportunity, a pattern rooted in long‑standing racial inequities in income, employment, and wealth that make Black and Hispanic/Latinx families more likely to experience deep poverty and need safety net programs like TANF to stay afloat.[22]
These inequities are visible both in who is likely to need assistance and in who is most affected when TANF reaches too few families. Many families living in poverty in New Jersey are led by women and people of color, and the families who do receive TANF reflect this as well. In Fiscal Year 2023, 47.8 percent of TANF recipients were Black and 31.9 percent were Hispanic/Latinx.[23] When TANF reaches fewer families overall, it disproportionately leaves these communities without the assistance they need to advance their economic security. The issue is not just about who enrolls, but also who is systematically shut out.
New Jersey has a policy history that explains how these inequities became embedded in the program. For example, the state was the first in the nation to adopt a “family cap” policy, which denied additional cash assistance to parents who had another child while receiving TANF.[24] Many of New Jersey’s TANF policies continue to be punitive and are rooted in racialized assumptions of who is “deserving” of help, frame a child’s access to help as dependent on the mother’s “character”, and depict and reinforce stereotypes of Black women and other women of color that have eroded public support for assistance and paved the way for policies centered on work and personal responsibility, regardless of economic challenges.[25] Although the family cap was repealed in 2020, its underlying racial assumptions still shape key features of TANF today, including strict work requirements, harsh sanctions, and narrow eligibility rules.
Without intentional reform to correct these issues, TANF’s restrictive design will continue to reproduce them. Strengthening the program is economically rational. It is also essential to ensuring all families and children who face steep barriers are not systematically excluded from the support they need to reach stability.
A Design That Stops Families at the Starting Line
Low benefits and a declining reach are just some parts of the problem. TANF’s design makes it difficult for families to get ahead in many other ways. When TANF was created, New Jersey adopted rules that went further than federal law required. The state imposed 35 hours of work activity per week instead of the federal 20 to 30 hours, limited work exemptions for parents of infants to just three months instead of the federal allowance of up to 12, and layered on complex application processes and administrative hurdles.[26] Over time, these restrictive policies, compounded by understaffing and outdated administrative systems, transformed a safety net into what many families experience as an obstacle course.
A major barrier comes from how the program treats earnings, which determines a family’s monthly grant. TANF uses a strict income limit to determine whether a family still qualifies for help. With the exception of the first month on TANF, a significant portion of income earned every month is counted right away against a fixed cap. Even a small raise or a few extra work hours can push a family over that limit, causing their cash assistance to drop sharply or end altogether. In essence, this “benefits cliff” leaves families worse-off for trying to earn a little more.[27] More generous income‑disregard policies, which allow parents to keep some of their earnings out of the eligibility calculation for a longer period of time, would give families the breathing room to increase their income without immediately losing the support they still need.
TANF’s structure also limits how long families can receive help. Federal law caps assistance at 60 months (or five years) over a lifetime, and New Jersey adheres to that limit. In 2024, 321 families had their cases closed solely because they reached this lifetime limit. If a family remains on TANF all the way to month 60, it is likely that family has not reached stability by month 61, yet the program cuts them off anyway.[28] This underscores how arbitrary the five‑year cap is, especially given that many families face circumstances that cannot be resolved within such a rigid timeframe, including limited education, disabilities, chronic health needs, and caregiving responsibilities.[29] The program further assumes nearly any job will lift families out of poverty. Yet even with New Jersey’s strong minimum wage, a family of three relying on full-time work plus the maximum monthly grant still falls short of what is required to cover basic expenses like rent, food, utilities, and transportation.[30]
These design choices are negatively reinforced by how the state allocates its TANF dollars.[31] New Jersey has broad flexibility in how it spends its federal block grant and invests state funds in the TANF program, yet in 2023 directed only five percent of TANF funding toward cash assistance.[32] A significant share of funding went to programs like pre‑K, child care, and refundable tax credits, investments that strengthen long‑term economic security but do not replace the predictable, month‑to‑month income families need to keep a roof overhead or cover daily essentials. When so little of the block grant is dedicated to monthly cash assistance, TANF cannot function as the first‑line support it was designed to be. Instead, families encounter a system that offers help far too late. Help comes during the next tax filing season if they earn enough to file or when a child finally reaches a certain age. It is not available when they are standing at the starting line trying to regain their footing.
What New Jersey Should Do Next
The shortcomings described above do not operate independently. They compound each other in ways that steadily weaken the program’s ability to lift families out of poverty. New Jersey must take the lead in protecting families from economic hardship through a stronger, more modern TANF — one that reflects today’s economic realities and provides families with the stability required to build a secure future. New Jersey has both the capacity and the responsibility to act on the following core reforms: raising benefit levels and indexing them to inflation, updating eligibility thresholds and time limits to reflect today’s economic realities, and aligning work requirements with federal standards and lived experience.
Raising Benefit Levels to Reflect Real Costs
The most urgent reform is raising the grant. Benefits should be increased to at least 50 percent of the federal poverty level. In 2026, that means a monthly grant of roughly $1,138, compared to the current maximum of $559 — about $6.20 per day per person for a family of three. New Jersey should also adopt an automatic cost-of-living adjustment (COLA) so that benefits keep pace with inflation without requiring a legislative act every year.[33] Without a COLA, any increase will lose value too quickly.
In alignment with this, New Jersey should direct a substantially greater share of its TANF funding toward cash assistance. In 2023, the state diverted most TANF funds away from cash assistance, when those dollars should go directly to families.[34] While TANF’s flexibility allows states to fund a wide range of programs, too few dollars currently reach families who need immediate support in the form of a monthly grant. Prioritizing cash assistance would ensure that TANF fulfills its core purpose: helping families meet basic needs during periods of financial instability.
Updating Eligibility Rules and Limits
New Jersey must update its eligibility rules and strengthen the pathways that allow families to enter, remain, and gradually transition off TANF. This includes a higher asset and income limit, removing state-level restrictions that prevent families from accessing the full federal 60-month lifetime limit, prioritizing stability, and eliminating full family sanctions if work requirements are not fully met. All are changes that would better reflect the realities of low‑wage work, caregiving, and economic volatility.
At the same time, expanding income disregards — allowing families to keep more of their earnings when applying for TANF and while participating without losing eligibility, and for a longer period — would allow families to build earnings steadily, maintain housing and work supports, and exit TANF with greater stability.[35]
Finally, simplifying application processes and addressing chronic administrative understaffing, including reducing documentation burdens and improving access, would remove barriers that likely discourage eligible families from accessing or maintaining support.[36] Together, these changes would help reverse the steep decline in caseloads and ensure that assistance reaches families experiencing the deepest levels of poverty.
Aligning Work Requirements with Economic Reality
New Jersey’s work requirements go beyond those set by the federal government, likely pushing families out of the program when they cannot meet rigid participation rules and work requirements.[37] Federal TANF guidelines generally require 20 hours per week of participation in a work activity, job, or a combination of both for single parents with children under age six, and 30 hours per week for those with older children.[38] New Jersey, by contrast, requires 35 hours per week for most parents — a threshold that is difficult to meet for families dealing with unstable jobs, unpredictable schedules, limited child care, or transportation barriers.[39]
Bringing state rules in line with federal standards would likely reduce unnecessary case closures and better reflect the realities of low‑wage work. Just as important, work activity requirements should recognize that not all jobs offer a path out of poverty. Treating a broader range of education, training, and credential‑building programs as core tools that may fully, not just partially, meet work activities would ensure that TANF supports long‑term stability and economic mobility rather than penalizing families for circumstances beyond their control.
A Call to Action
New Jersey lawmakers must reject the status quo that leaves families, especially children, without the resources they need to survive, let alone thrive. Strengthening TANF through reforms, including higher benefit levels, fairer eligibility rules, and updated work requirements, is essential to protecting the hundreds of thousands of residents living in or close to deep poverty. These reforms would not only stabilize families today but also reduce long-term costs associated with housing instability, food insecurity, and poor health outcomes — and would do so without creating new programs or new bureaucracy.
Lawmakers should enact comprehensive TANF reforms in the current legislative session to reach the families this program was designed to serve.
End Notes
[1] Mercer County Board of Social Services, Cash Assistance, Accessed Mar. 24, 2026.
[2] New Jersey Department of Human Services, Work First New Jersey, Jan. 20, 2026.
[3] Holom-Trundy, B., Outdated and Ineffective: Why New Jersey Needs to Update Its Top Anti-Poverty Program, New Jersey Policy Perspective, May 22, 2025.
[4] NJPP Analysis of U.S. Department of Health and Human Services Federal 2026 Poverty Guidelines to determine the amounts for varying federal poverty levels, Work First New Jersey grant amounts provided through the New Jersey state budget and Department of Human Services, and Bureau of Labor Statistics Consumer Price Index Calculator to consider inflation, Jan. 2026.
[5] Aguas, T., Census 2024: Economic Gains Bypass Many New Jersey Communities, New Jersey Policy Perspective, Oct. 21, 2025.
[6] Dalaker, J., An Introduction to Poverty Measurement, Library of Congress, Sep. 16, 2024. Administration for Children & Families, Characteristics and Financial Circumstances of TANF Recipients, Fiscal Year 2023, Table 10, Oct. 3, 2024. Floyd, Ife, et al., TANF Policies Reflect Racist Legacy of Cash Assistance, Center on Budget and Policy Priorities, Aug. 4, 2021.
[7] Haider, Areeba, et al., Re-Envisioning TANF: Toward an Anti Racist Program That Meaningfully Serves Families, Georgetown Center on Poverty and Inequality, Oct. 20, 2022.
[8] New Jersey Department of Human Services, New Jersey State Plan for Temporary Assistance for Needy Families (TANF) FFY 2024 – FFY 2026, Schedule I and Schedule II, 2024.
[9] NJPP analysis of Bureau of Labor Statistics Consumer Price Index Calculator data to consider inflation and Welfare Rules Database on TANF monthly amount for a family the size of three.
[10] NJPP Analysis of U.S. Department of Health and Human Services Federal Poverty Guidelines for 2026 to determine the amounts for varying federal poverty levels, Work First New Jersey grant amounts provided through the New Jersey state budget and Department of Human Services, and Bureau of Labor Statistics Consumer Price Index Calculator to consider inflation, Jan. 2026.
[11] Massachusetts Institute of Technology, Living Wage Calculation for New Jersey, Feb. 28, 2026.
[12] NJPP analysis of TANF benefit amounts and 2026 federal poverty levels. See for example: U.S. Department of Health and Human Services Poverty Guidelines for 2026 to determine the amounts for varying federal poverty levels, Jan. 2026. New Jersey Department of Human Services, New Jersey State Plan for Temporary Assistance for Needy Families (TANF) FFY 2024 – FFY 2026, Schedule I and Schedule II, 2024
[13] Legal Services of New Jersey, New Jersey True Poverty Tracker: A Report on Populations Experiencing Deprivation in New Jersey, Sep. 2022.
[14] University of California, Davis, Center for Poverty and Inequality Research, What is “deep poverty”?, Oct. 30, 2025.
[15] Department of Human Services, Murphy Administration Boosts Payments for Families & Individuals in Need, Sep. 4, 2019. Holom-Trundy, B., Adjusting Work First New Jersey Eligibility Would Help Tackle Child Poverty, New Jersey Policy Perspective, Feb. 14, 2022. Holom-Trundy, B., Expand Anti-Poverty Programs to Help Families in Crisis, New Jersey Policy Perspective, Jan. 22, 2025.
[16] Holom-Trundy, B., Outdated and Ineffective: Why New Jersey Needs to Update Its Top Anti-Poverty Program, New Jersey Policy Perspective, May 22, 2025.
[17] NJ Department of Human Services, Current Program Statistics – December 2025, Table 1, Mar. 2026.
[18] Aguas, T., Census 2024: Economic Gains Bypass Many New Jersey Communities, New Jersey Policy Perspective, Oct. 21, 2025.
[19] Center on Budget and Policy Priorities, Trends in State TANF-to-Poverty Ratios, Oct. 1, 2025.
[20] Center on Budget and Policy Priorities, TANF State-by-State Fact Sheets – New Jersey, Oct. 1, 2025.
[21] NJPP analysis of ACNJ 1998 Kids Count data and Division of Family Development 2024 Current Program Statistics data, all years are for enrollment in June. Small Area Income and Poverty Estimates (SAIPE) data for poverty under age 18 for years 1997 and 2024
[22] Castro, R., Promoting Equal Opportunities for Children Living in Poverty, Appendix Table, New Jersey Policy Perspective, Apr. 2020. NJ Department of Human Services, Current Program Statistics – June 2019, Jan. 2026. NJ Department of Human Services, Current Program Statistics – June 2025, Jan. 2026. Aguas, T., Census 2024: Economic Gains Bypass Many New Jersey Communities, New Jersey Policy Perspective, Oct. 21, 2025.
[23] Administration for Children & Families, Characteristics and Financial Circumstances of TANF Recipients, Fiscal Year 2023, Table 10, Oct. 3, 2024. Aguas, T., Census 2024: Economic Gains Bypass Many New Jersey Communities, New Jersey Policy Perspective, Oct. 21, 2025.
[24] Covert, B., New Jersey, Birthplace of Welfare Family Caps, Has Finally Repealed Them, TalkPoverty, Oct. 16, 2020.
[25] Floyd, Ife, et al., TANF Policies Reflect Racist Legacy of Cash Assistance, Center on Budget and Policy Priorities, Aug. 4, 2021. Floyd, I., States Should Follow New Jersey: Repeal Racist “Family Cap”, Center on Budget and Policy Priorities, Oct. 14, 2020.
[26] Castro, R., TANF at 23: Reform is Necessary to Break the Cycle of Poverty, New Jersey Policy Perspective, Aug. 22, 2019. National Center for Children in Poverty, A 50-State Comparison of TANF Policy Settings Linked to Child and Family Protection, Mar. 24, 2025. Holom-Trundy, B., Understaffed and Underfunded: Barriers to Effective Anti-Poverty Assistance, New Jersey Policy Perspective, Nov. 25, 2024.
[27] American Public Human Services Association, Seven Ways to Improve TANF and Help Families Advance, Aug. 22, 2022.
[28] NJ Division of Family Development, 2024 Quarterly Progress Reports, Work First New Jersey, Accessed Mar. 24, 2026.
[29] Castro, R., TANF at 23: Reform is Necessary to Break the Cycle of Poverty, New Jersey Policy Perspective, Aug. 22, 2019. National Center for Children in Poverty, A 50-State Comparison of TANF Policy Settings Linked to Child and Family Protection, Mar. 24, 2025.
[30] Aguas, T., What Could $0.43 Offer You?…NJ Minimum Wage Just Went Up!, Princeton Perspectives, Jan. 2026.
[31] NJPP analysis of New Jersey Office of Management and Budget, BUDGET IN BRIEF – Summary of Budget Recommendations FISCAL YEAR 2026, p. 95, Feb. 2025. Congressional Research Service, The Temporary Assistance for Needy Families (TANF) Block Grant: A Legislative History, Jan. 6, 2025.
[32] Center on Budget and Policy Priorities, New Jersey TANF Spending, Jan. 16, 2026.
[33] Azevedo-McCaffrey, D. and Aguas, T., Continued Increases in TANF Benefit Levels Are Critical to Helping Families Meet Their Needs and Thrive, Center on Budget and Policy Priorities, Feb. 26, 2025.
[34] Center on Budget and Policy Priorities, New Jersey TANF Spending, Jan. 16, 2026.
[35] National Center for Children in Poverty, A 50-State Comparison of TANF Policy Settings Linked to Child and Family Protection, Mar. 24, 2025.
[36] Holom-Trundy, B., Understaffed and Underfunded: Barriers to Effective Anti-Poverty Assistance, New Jersey Policy Perspective, Nov. 25, 2024.
[37] There is no recent published research examining New Jersey TANF participants’ experiences with WorkFirst NJ specifically. However, studies from other states offer insight into how participation rules and administrative processes can shape families’ ability to remain on the program. Qualitative research from Illinois documents that many TANF recipients experience the program as difficult to navigate, with complex work requirements and procedural hurdles contributing to case closures. While these findings do not describe New Jersey’s system, they illustrate broader patterns in how TANF’s design can create barriers for families. See for example: Heartland Alliance, Resigned to the Process: Barriers to Accessing and Maintaining TANF among Low-Income Families with Young Children in Illinois, 2022.
[38] Library of Congress, The Temporary Assistance for Needy Families (TANF) Work Standard and How States Met It, Feb. 18, 2026.
[39] Under Work First New Jersey rules, parents with infants under three months old may receive a temporary deferral from work participation requirements. After this period, parents are generally expected to engage in approved work activities unless they qualify for another exemption (such as a documented medical condition or caregiving need). These deferrals do not eliminate program obligations but temporarily pause work requirements during the postpartum period. See for example: Work First New Jersey, Work First New Jersey Handbook, Aug. 2019. Justia Regulations, NJ Admin Code 10:90-4.10, Jun. 16, 2025.