New Jersey’s Shrinking Pool of Teacher Candidates

To read a PDF version of the full report, click here.


Executive Summary

Maintaining a high-quality teaching workforce is critically important for the future of public education in New Jersey. Federal data, however, show cause for concern: New Jersey is producing far fewer teacher candidates than a decade ago. In fact, the number of candidates completing teacher preparation programs has dropped 49 percent between 2009 and 2018. These declines, which are part of national and regional trends, cut across both gender and race. The dwindling number of teacher candidates creates instability in the teaching profession and jeopardizes the ability of students to learn.[1]

While reasons for the decline in teacher candidates are complex, we know that New Jersey’s teachers are paid considerably less than other college-educated workers, even when controlling for age and time worked.[2] Of particular concern is that the evidence suggests fewer college graduates see teaching as a viable career option with adequate compensation. New Jersey must aggressively address these problems if it wishes to retain its status as having one of the best education systems in the nation.

To stem the decline in teacher candidates, New Jersey should work to make the teaching profession more attractive by raising teacher pay, shoring up benefits, and increasing the respect and appreciation shown to New Jersey’s educators.

This report explores enrollment and completion data in teacher preparation programs, gives context around state policy changes affecting education professionals, reviews the level of teacher demand in the state, and examines the change in demographics within the profession over the past ten years.

Background

This past September, NJPP published an analysis of the New Jersey teaching corps entitled, New Jersey’s Teacher Workforce, 2019.[3] Among its findings:

  • While factors outside of school are the strongest influences on student achievement, teacher quality is the most significant in-school influence.
  • The research on teacher quality suggests that qualified people become teachers based, in part, on how well teaching pays compared to other jobs.
  • Despite the importance of teachers, there is a significant gap in wages between New Jersey teachers and other college-educated workers in the state, even when accounting for differences in time worked.
  • Pensions and health benefits do not fully close the pay gap between teachers and college-educated workers in other professions.
  • New Jersey’s teaching workforce is mostly white and female; there is little evidence of a trend toward a more diverse teaching workforce.
  • New Jersey’s teacher workforce is aging, suggesting a new wave of retirements in the next several years.


These findings are similar to other analyses, which show a significant pay gap for teachers compared to other college-educated workers.[4] Critics suggest, however, that these studies are flawed in that they don’t fully account for differences in benefits and other non-pecuniary compensation, unmeasured differences in talent between workers, and other factors. Teachers, they argue, are actually well-compensated, even in today’s tightening labor market.

To test these criticisms, this report examines whether more or fewer workers are becoming teachers. If teacher pay and benefits have kept pace with compensation in other sectors, we would expect to see workers respond in kind, and continue to enter the profession at previous rates. Because compensation levels influence workers’ decisions to go into teaching those workers would judge the benefits that teachers receive as adequate to close the teacher pay gap and continue to enroll in programs to prepare to become educators.[5]

The data, however, tell a different story. Fewer workers in New Jersey are electing to enter teacher preparation programs, a clear indication that teaching is not as attractive a career option as it once was.

Findings

Teacher Preparation Programs: Enrollment & Completion

Teacher preparation programs across the United States can be either traditional or alternative. Traditional programs are generally run by institutions of higher education and lead to degrees or credentials that fulfill the requirements for a teaching certification. Alternative programs enroll candidates who have previous subject-matter knowledge; these candidates often are already the teachers of record in a classroom while they participate in their preparation program.[6]

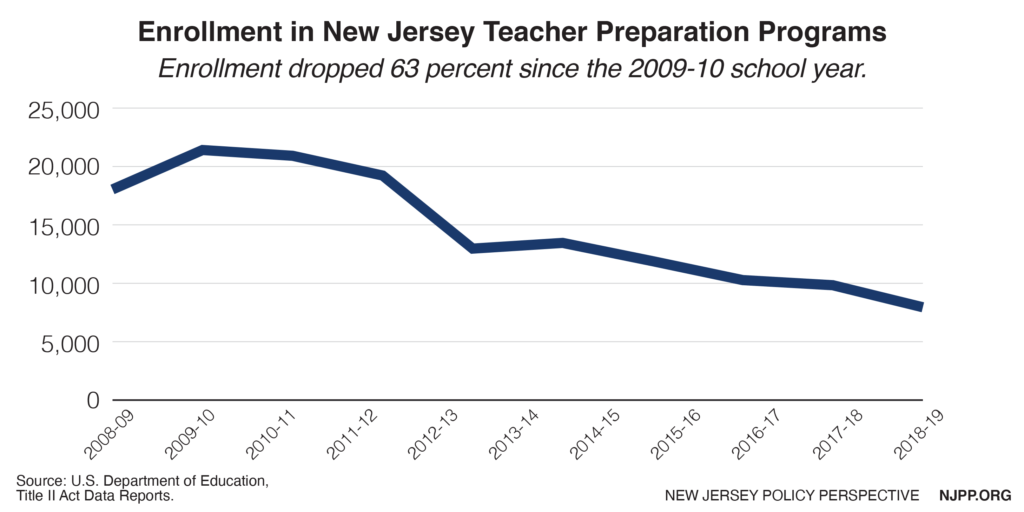
At its peak in the 2009-10 academic year, the state enrolled 21,410 teacher candidates in various preparation programs. By 2017-18, however, the number of enrollees had declined to 7,950, a 63 percent drop.

Graph: Enrollment in New Jersey teacher preparation programs has dropped 63 percent since the 2009-2010 school year.
Figure 1

The decline in enrollment led to a decline in the number of people who completed teacher preparation programs (henceforth referred to as “completers”), from 6,373 in the 2009-10 academic year to just 3,366 in 2017-2018, representing a 47 percent decrease.

Graph: Completers of New Jersey teacher preparation programs have dropped 47 percent since the 2009-2010 school year.
Figure 2

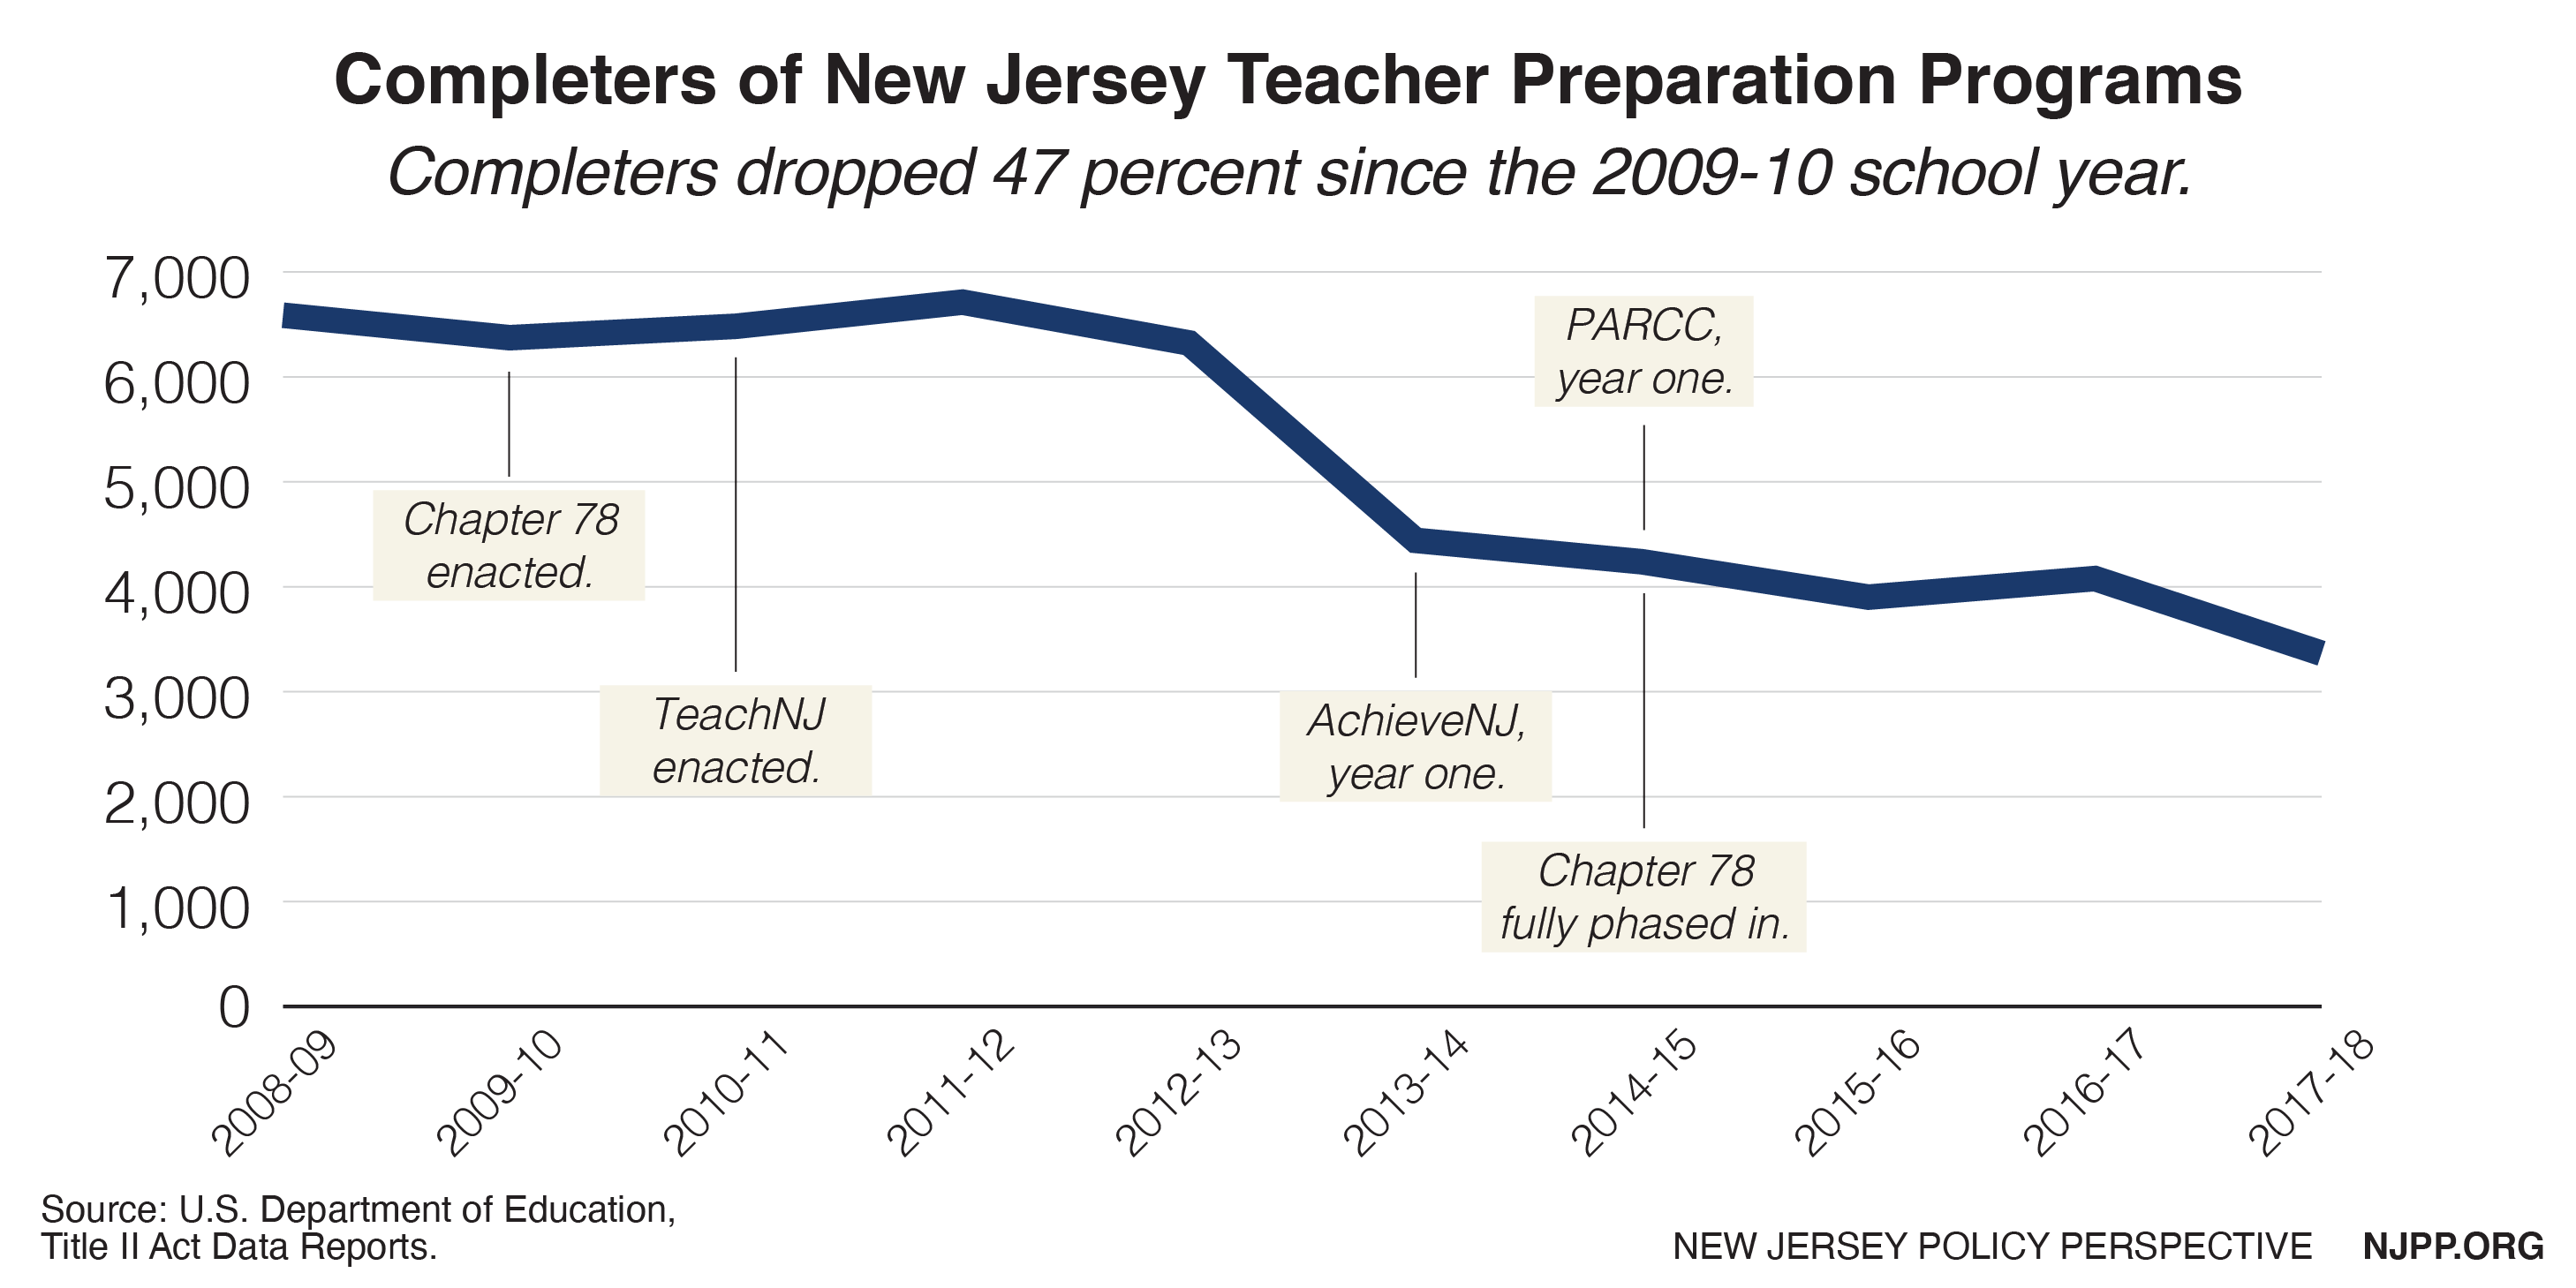
To contextualize these data, it is instructive to consider the changes in the state’s policies regarding teachers over the same period of time[7]:

  • Chapter 78, enacted in June of 2011, was a law that forced teachers to pay substantially higher pension contributions, removed cost of living increases from pensions, and required teachers to pay substantially more for health care benefits.
  • TEACHNJ was enacted in August of 2012; it weakened teacher tenure protections, expanded teacher evaluation requirements, and led to the increased use of standardized test scores in teacher rating systems.
  • AchieveNJ was implemented by the state for the 2013-14 school year; the new regulations required the use of approved teacher observation systems, as well as the use of Student Growth Percentiles (SGPs) based on test scores, and Student Growth Objectives (SGOs) which require additional work for all teachers.
  • The state moved from the New Jersey Assessment of Skills and Knowledge (NJASK) to the Partnership for Assessment of Readiness for College and Careers (PARCC) exams in the 2014-15 school year. PARCC expanded the grade levels subject to testing, increased the amount of time spent administering exams, and required a substantial expansion of technology infrastructure.

It is worth noting that the number of work hours per week reported by teachers increased during this same period. [8] It is likely this is, at least in part, a result of the policy changes listed above.

While reasons for the decline in teacher candidates are complex, these policies likely contribute to working conditions that make it difficult for teachers to thrive. New Jersey’s teachers have been increasingly underpaid relative to similarly educated workers and have seen an erosion of their benefits while the demands of their jobs have grown.[9]

The Demand for Teachers

To sustain a strong teacher workforce, it is critical that New Jersey has a large pool of highly qualified candidates for school districts from which to hire. Over the last decade, the number of new teachers entering New Jersey’s workforce has varied sharply. The Great Recession of 2008-09 severely stifled the hiring of novice teachers (certified teachers with less than one year of experience) in New Jersey’s schools. 2009 saw the beginning of a sharp drop off in novice teachers, reaching a low point in 2011. The economic recovery, however, led to a substantial rise in teacher hiring; by 2014, nearly 10,000 novices were in the state’s teacher workforce.

Graph: Demand for New Jersey teachers has returned to pre-Great Recession levels.
Figure 3

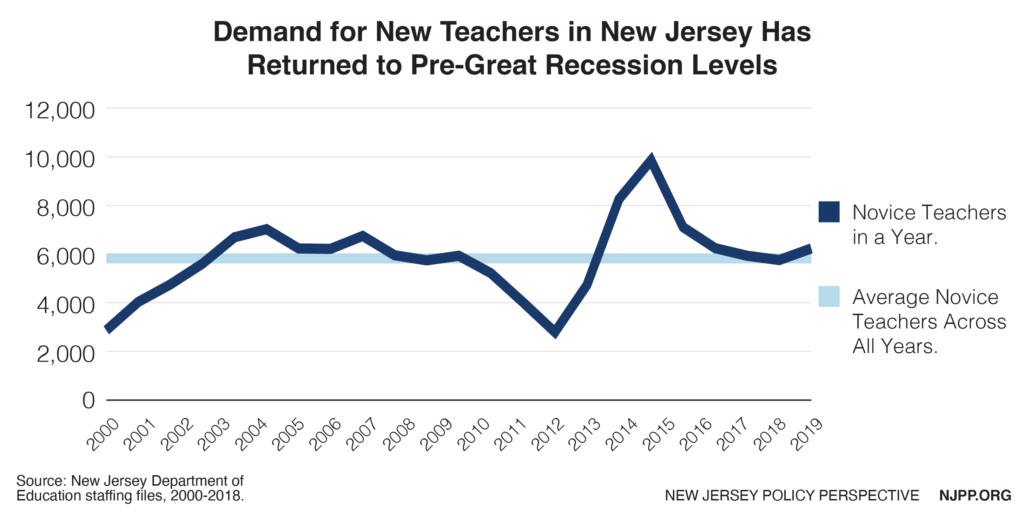
The latest data indicate that New Jersey’s demand for novice teachers is back where it was before the Great Recession. However, the number of teacher candidates has not rebounded – even as the student population has remained relatively stable at around 1.37 million K-12 students from 2009 to 2017. The consequence is that the number of teacher candidates per 1,000 students has dropped significantly.

Graph: Fewer teacher prepation enrollees and completers, but the same number of students.
Figure 4

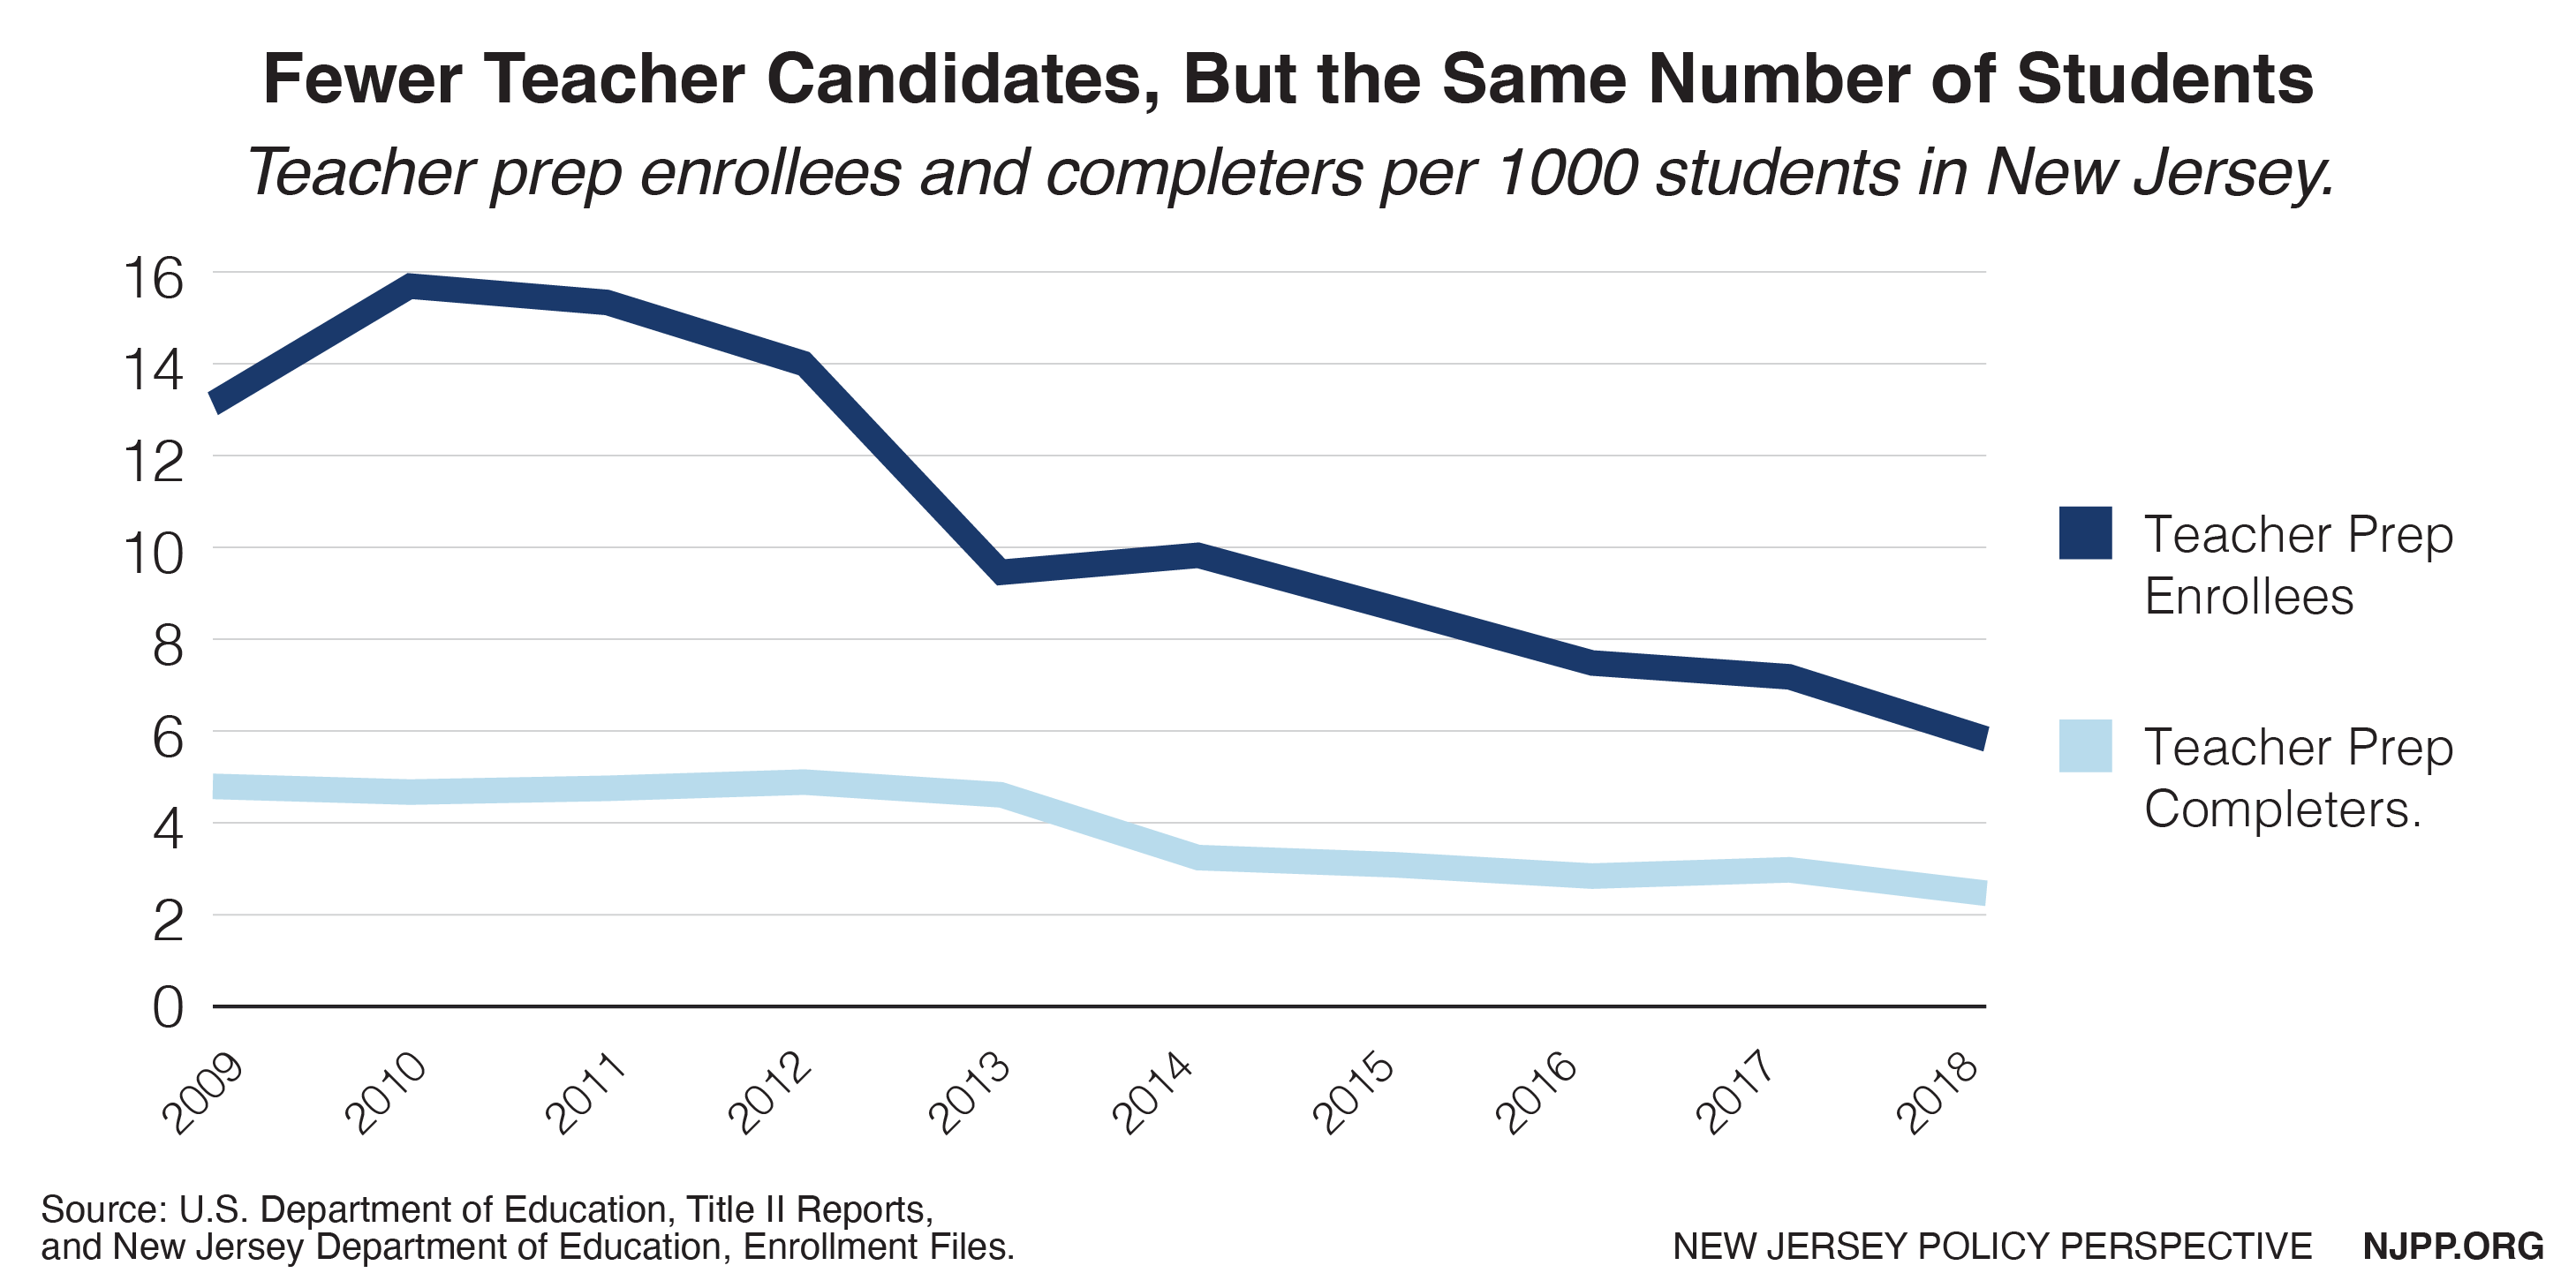
In 2009, there were about 13 enrollees in teacher preparation programs for every 1,000 students; in 2018, there were only about six enrollees per 1,000 students. Likewise, in 2009 there were nearly five program completers for every 1,000 students; in 2017, there were less than three completers per 1,000 students.

Overall, there are fewer New Jersey workers entering the teaching workforce than a decade ago while the student population has not declined significantly. Each year, school administrators have had to draw from a shallower pool of teacher candidates to fill the positions needed to maintain the quality of New Jersey’s schools. If this trend continues, there will not be enough well-qualified teacher candidates available to maintain the state’s teacher workforce.

“Alternate Route” Teacher Preparation

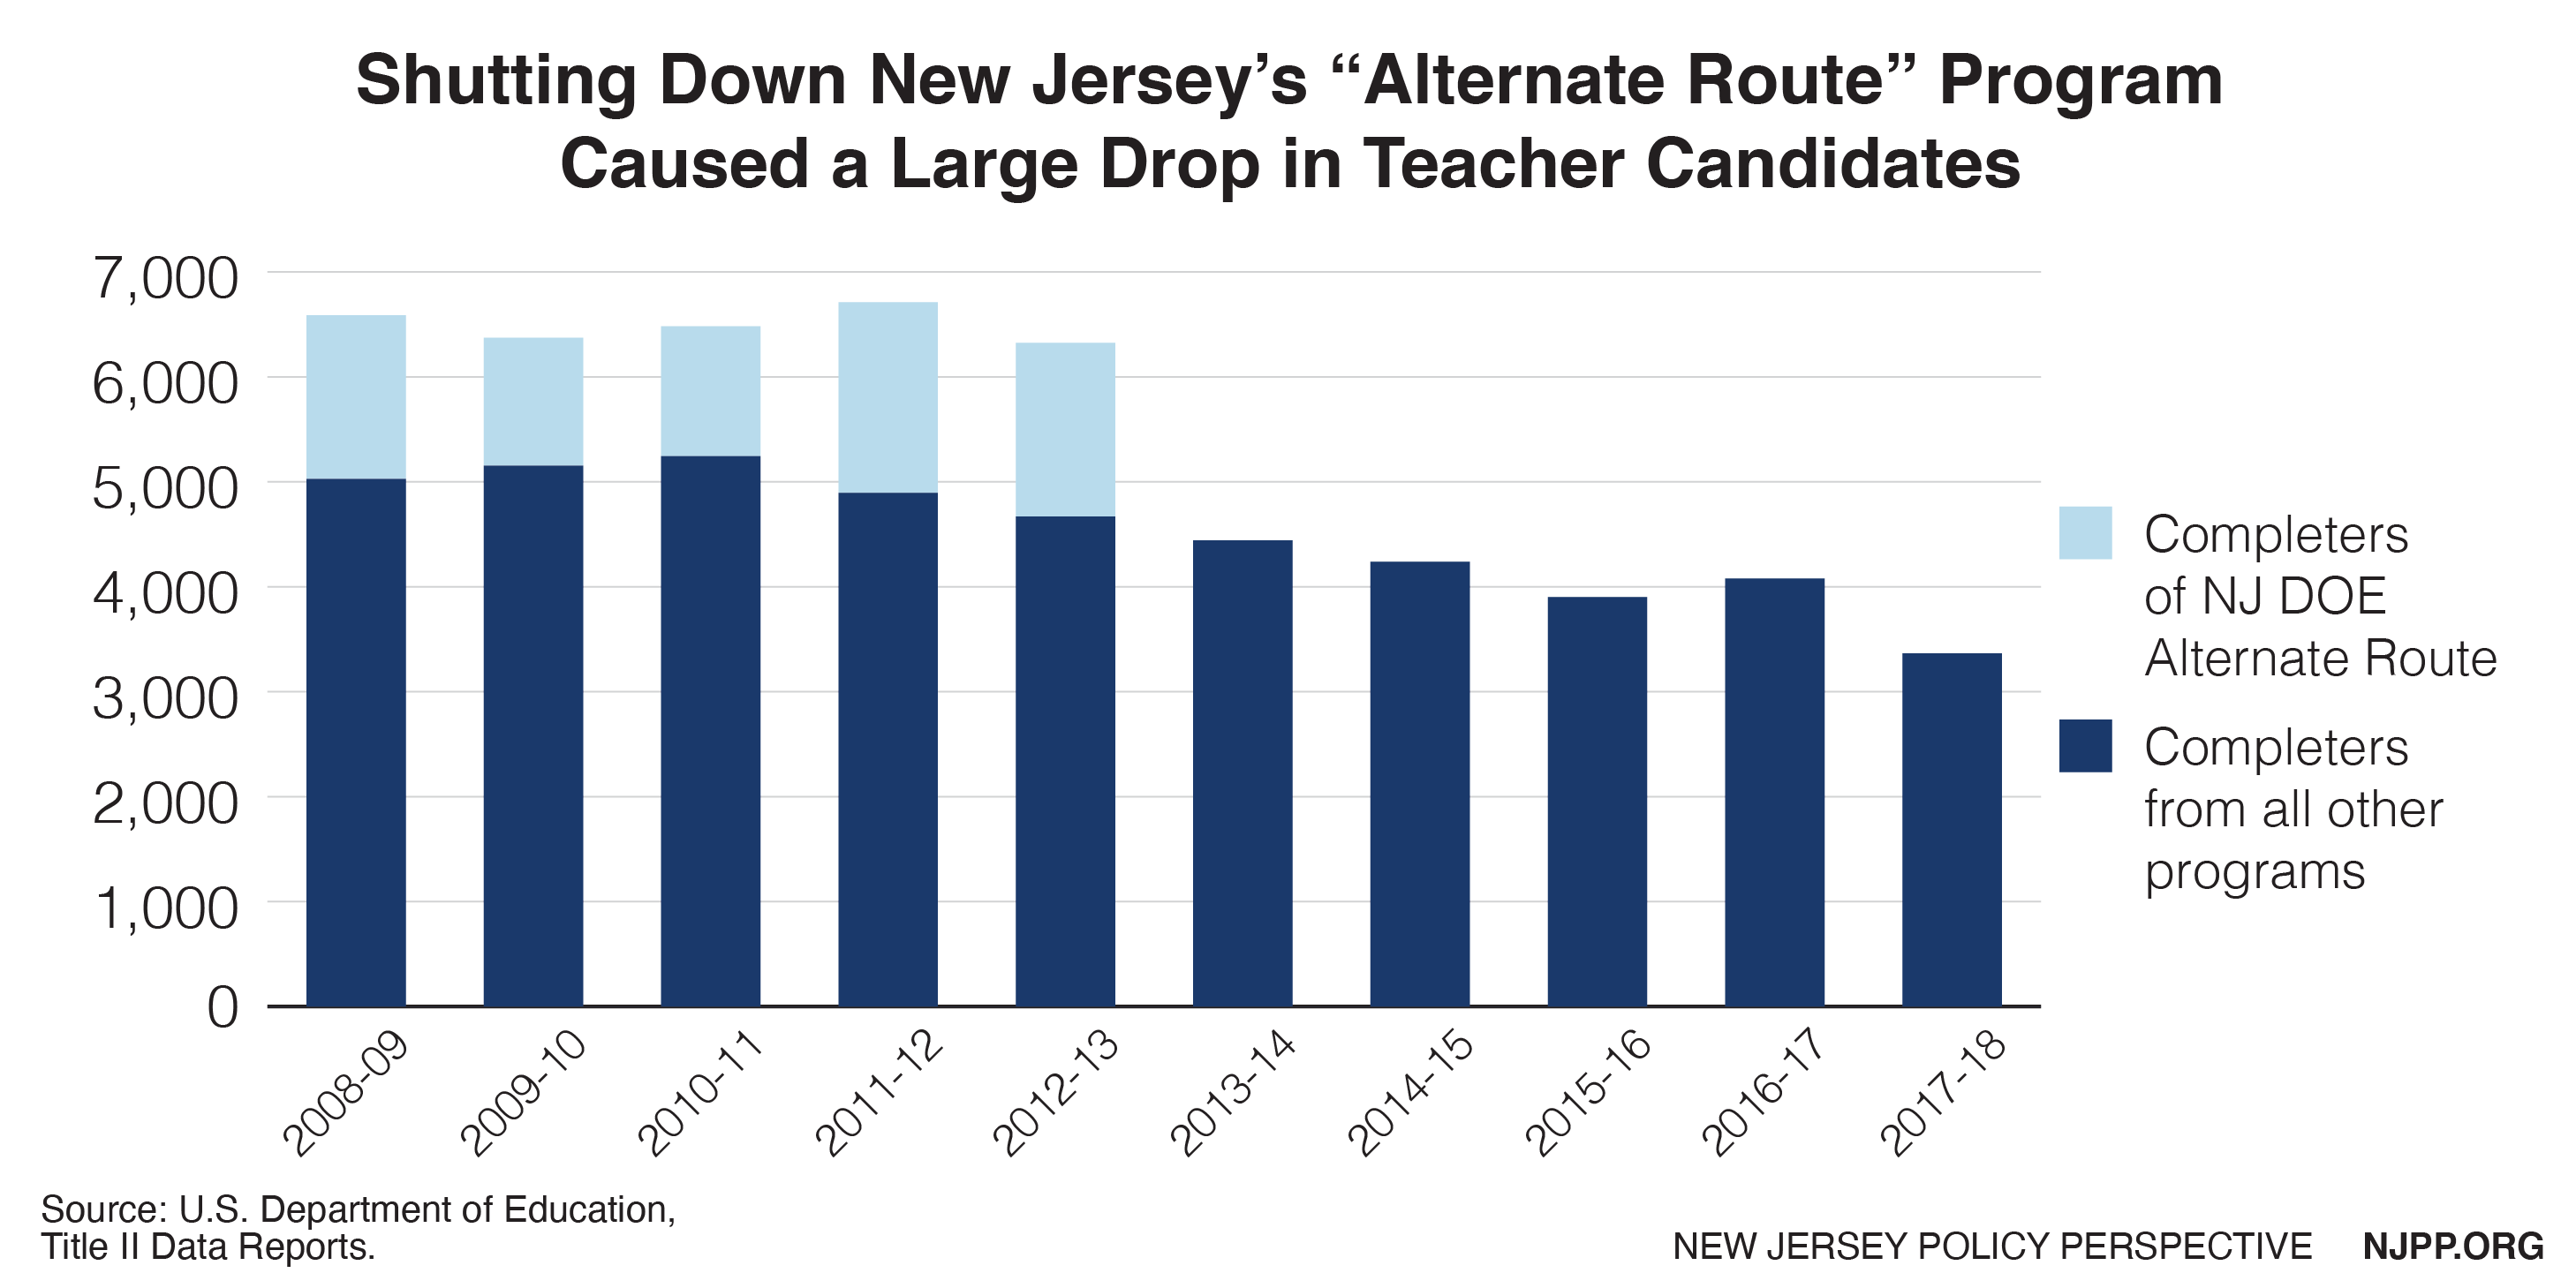
Between the 2012-13 and 2013-14 school years, there was a large drop in teacher prep program completers. This decline is a direct result of the shuttering of the New Jersey Department of Education’s (NJDOE) Alternate Route program. This program, which was administered directly by the state, allowed candidates with previous subject-matter knowledge to acquire a Certificate of Eligibility (CE) and begin employment as a teacher of record in a classroom. Candidates could eventually become a fully credentialed teacher without enrolling in a traditional program at an institution of higher education (IHE).[10] The state still issues CE’s; however, the Alternate Route program is no longer directly administered by the NJDOE, but by a variety of institutions that also offer traditional preparation programs.

The closing of the NJDOE Alternate Route program brought on a significant decline in the total number of teacher program completers. Further, the number of completers in all other programs also decreased during this time, from a high of 5,243 in 2010-11 to 3,366 in 2017-18, a decline of 36 percent.

Graph: Shutting down New Jersey's "Alternate Route" program has caused a large drop in teacher candidates.
Figure 5

When such a large and sudden drop in program completers appears in the data, it is reasonable to ask whether there may be data errors, or some other reporting issue. Conversations with NJDOE staff, however, confirm that the large declines due to the end of the old Alternate Route program were actual declines.[11] Further analysis reveals that New Jersey is not alone; the decline in enrollees and completers of teacher prep programs of all types is a national problem.

Comparing New Jersey to Neighboring States

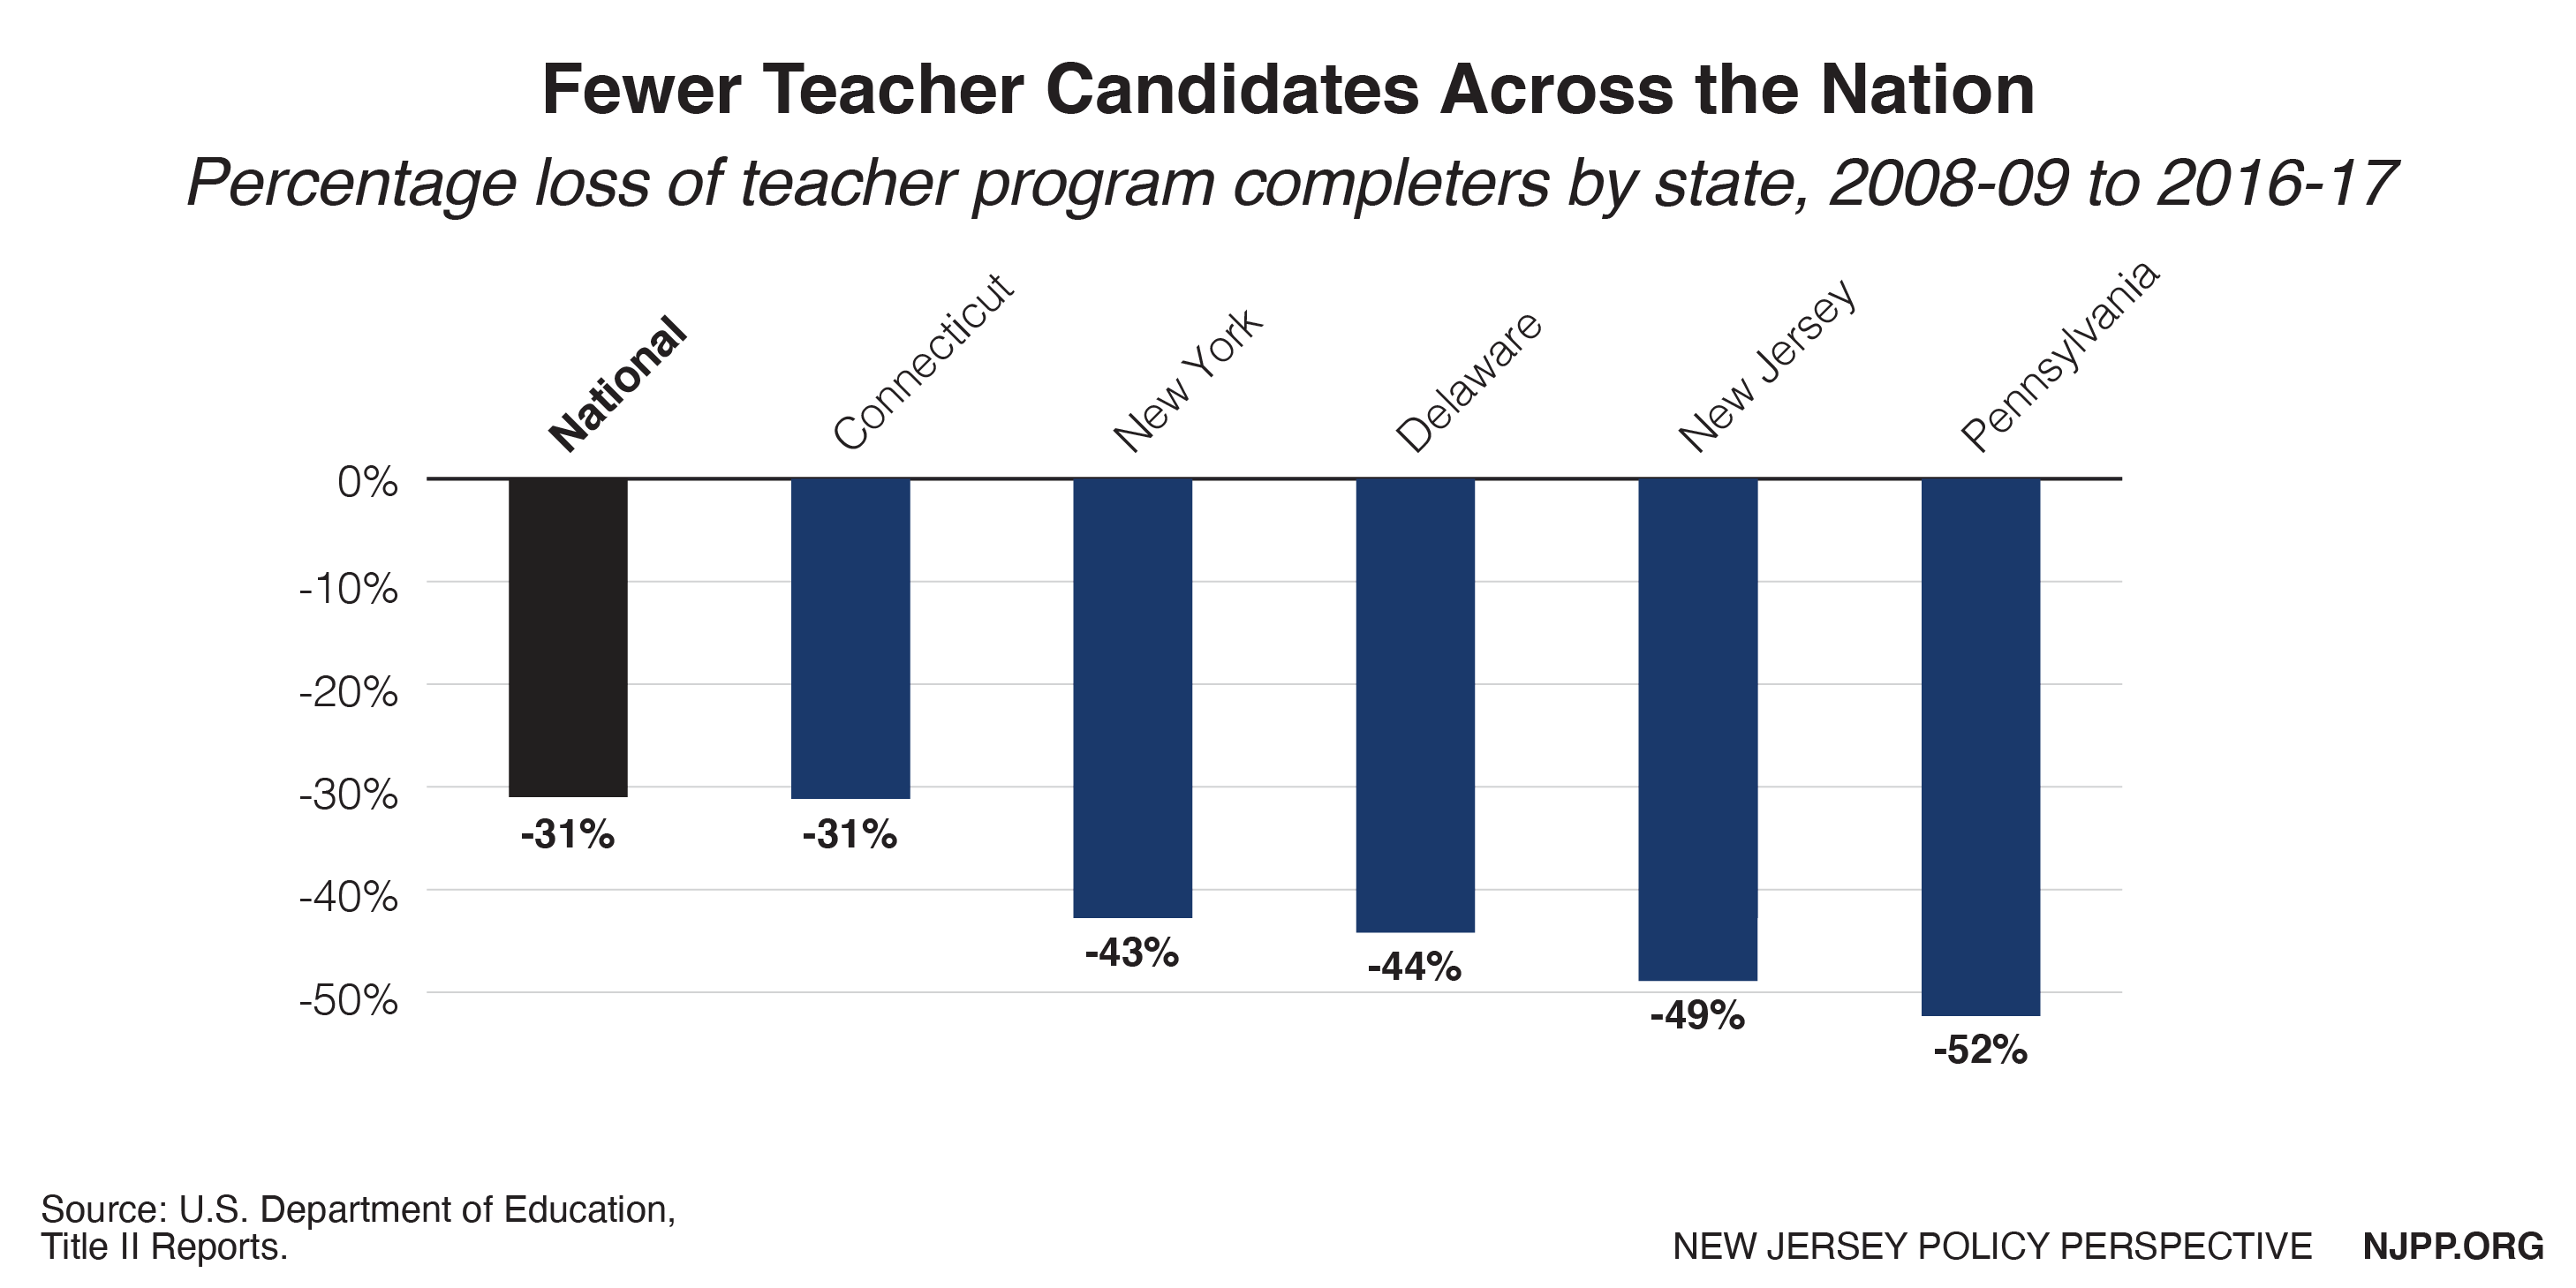
The number of teacher candidates is declining across the United States: 31 percent fewer people completed a teacher prep program in the 2017-18 academic year than in 2008-09. New Jersey’s decline of 49 percent is high compared to the rest of the nation, but not when compared to most of its regional neighbors. Pennsylvania had slightly greater losses in teacher candidates during this same period; New York’s and Delaware’s losses were somewhat smaller. Losses in Connecticut, in contrast, were closer to the national average.

Graph: Fewer teachers candidates are completing teacher preparation programs all across the nation.
Figure 6

Demographics

Past research shows students of color benefit from having teachers of color in their schools, reporting that students demonstrate small but significant increases in academic outcomes.[12] Unfortunately, New Jersey’s teacher workforce looks nothing like its student population. While only 22 percent of the state’s students are white females, 66 percent of the state’s teachers are white women.[13]

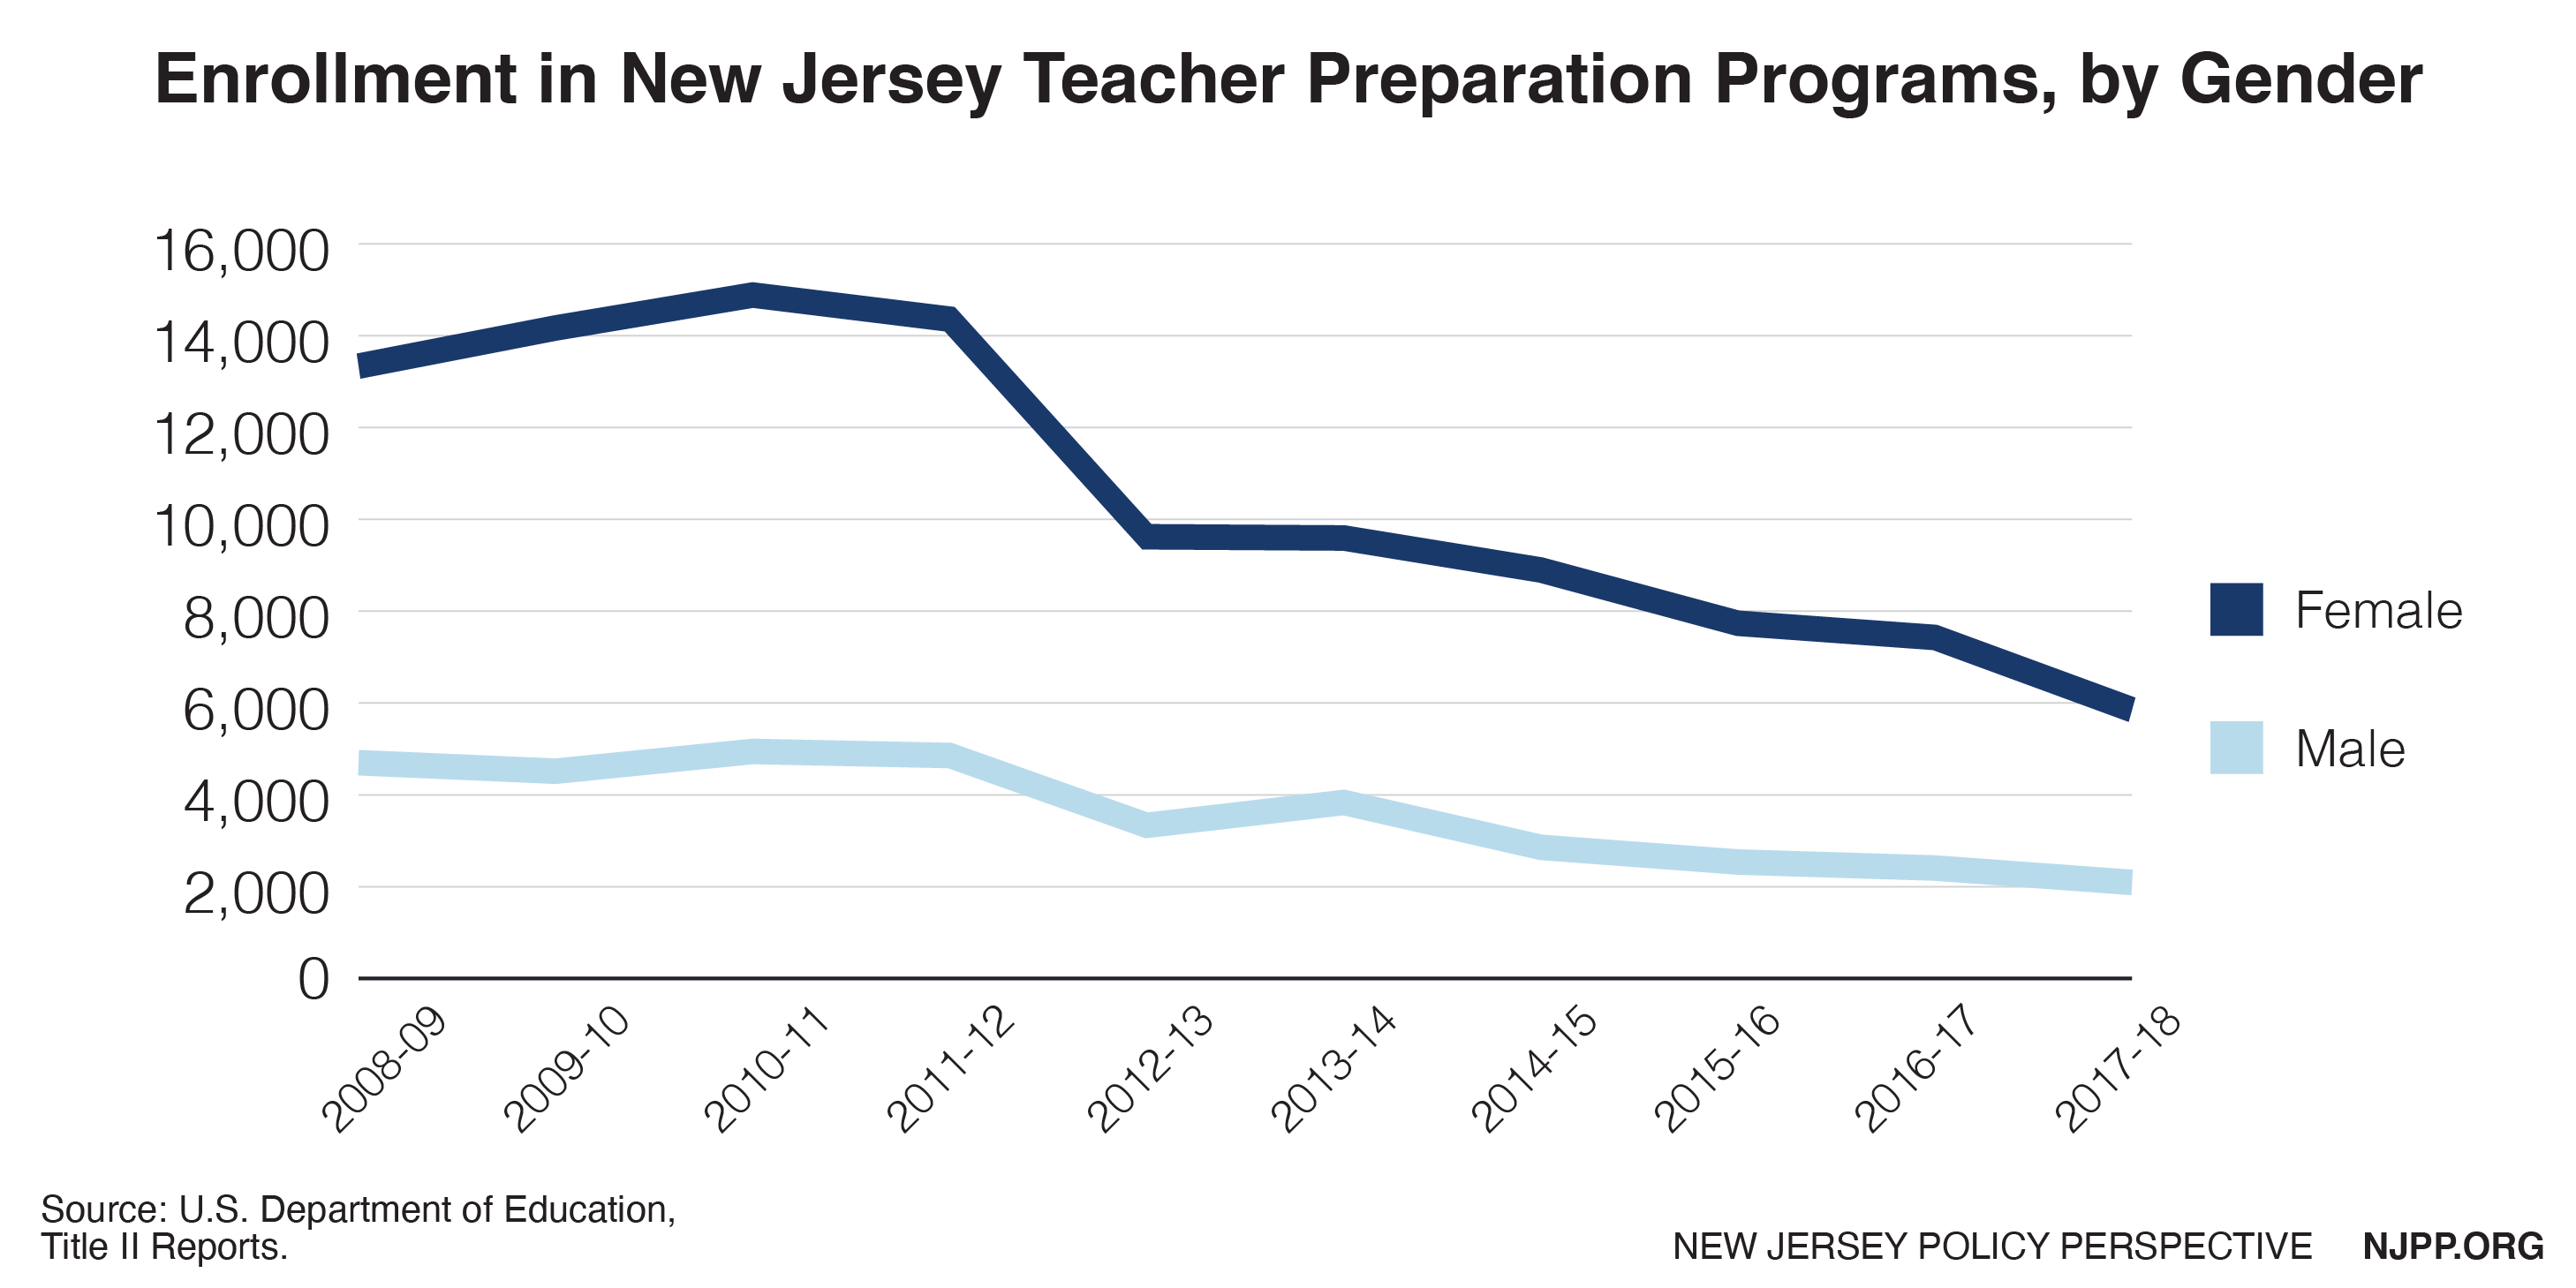
If the state is to have a more diverse teacher workforce, it must recruit a more diverse population of teacher candidates. However, the declines in enrollees in teacher prep programs cut across gender and racial lines.

With regard to gender, between academic years 2008-09 and 2017-18, the number of men enrolled in teacher prep programs declined by 55 percent. During the same period of time, the number of women declined by 56 percent.

Graph: Enrollment in New Jersey teacher preparation programs by gender.
Figure 7

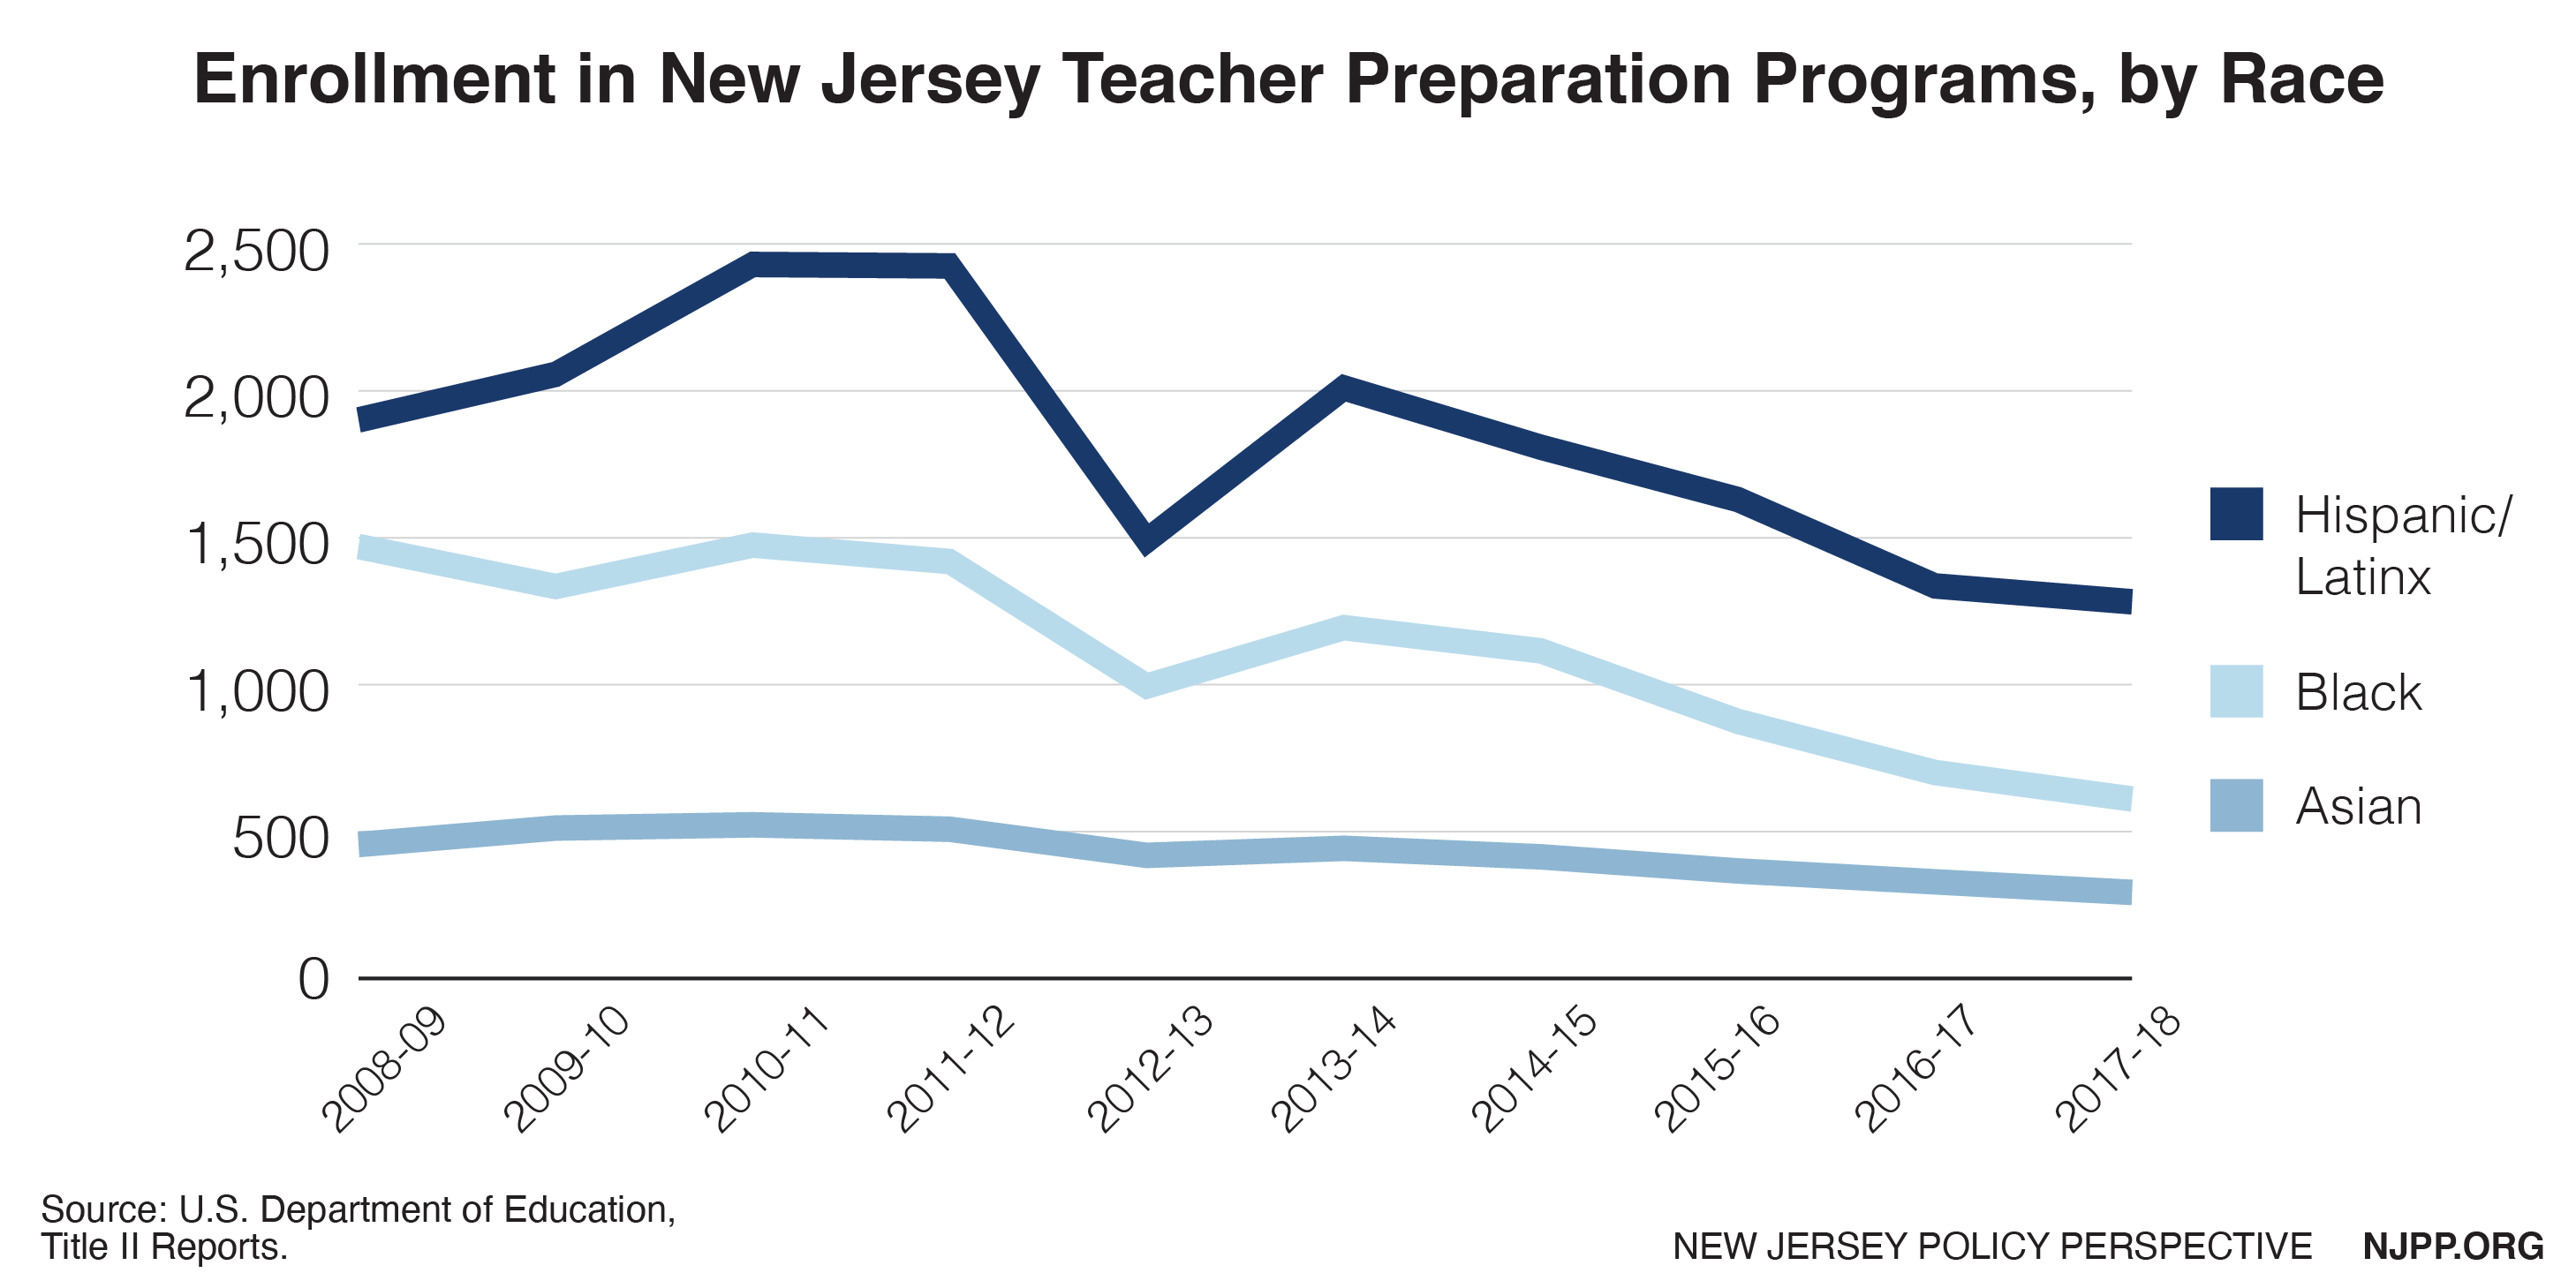
While enrollees of different races and ethnicities have all seen declines, there is some variation. Between academic years 2008-09 and 2017-18, Hispanic/Latinx enrollees of any race declined by 33 percent and Asian enrollees declined 36 percent. Even more striking is that Black or African American enrollees declined by 58 percent.

Students of color already face significant challenges in completing college, due to systemic barriers that they are uniquely forced to grapple with. These challenges are compounded when students consider entering a teacher preparation program.[14] Teacher licensure exams, for example, often have higher rates of failure for prospective teachers of color, even as studies find the exams do not consistently or accurately predict teacher effectiveness. There is a disturbing history of deliberate bias in these exams, whose results were often used to justify racially disparate hiring practices in schools.[15]

Graph: Enrollment in New Jersey teacher preparation programs by race.
Figure 8

New Jersey has recently made efforts to recruit more men of color into teaching, but such efforts are likely to have minimal effect if college-educated workers are increasingly turning away from the profession.[16] New Jersey will only recruit a diverse teacher workforce if it both makes teaching more attractive and dismantles the systemic barriers to entry for teacher candidates of color.

Production of Teaching Degrees

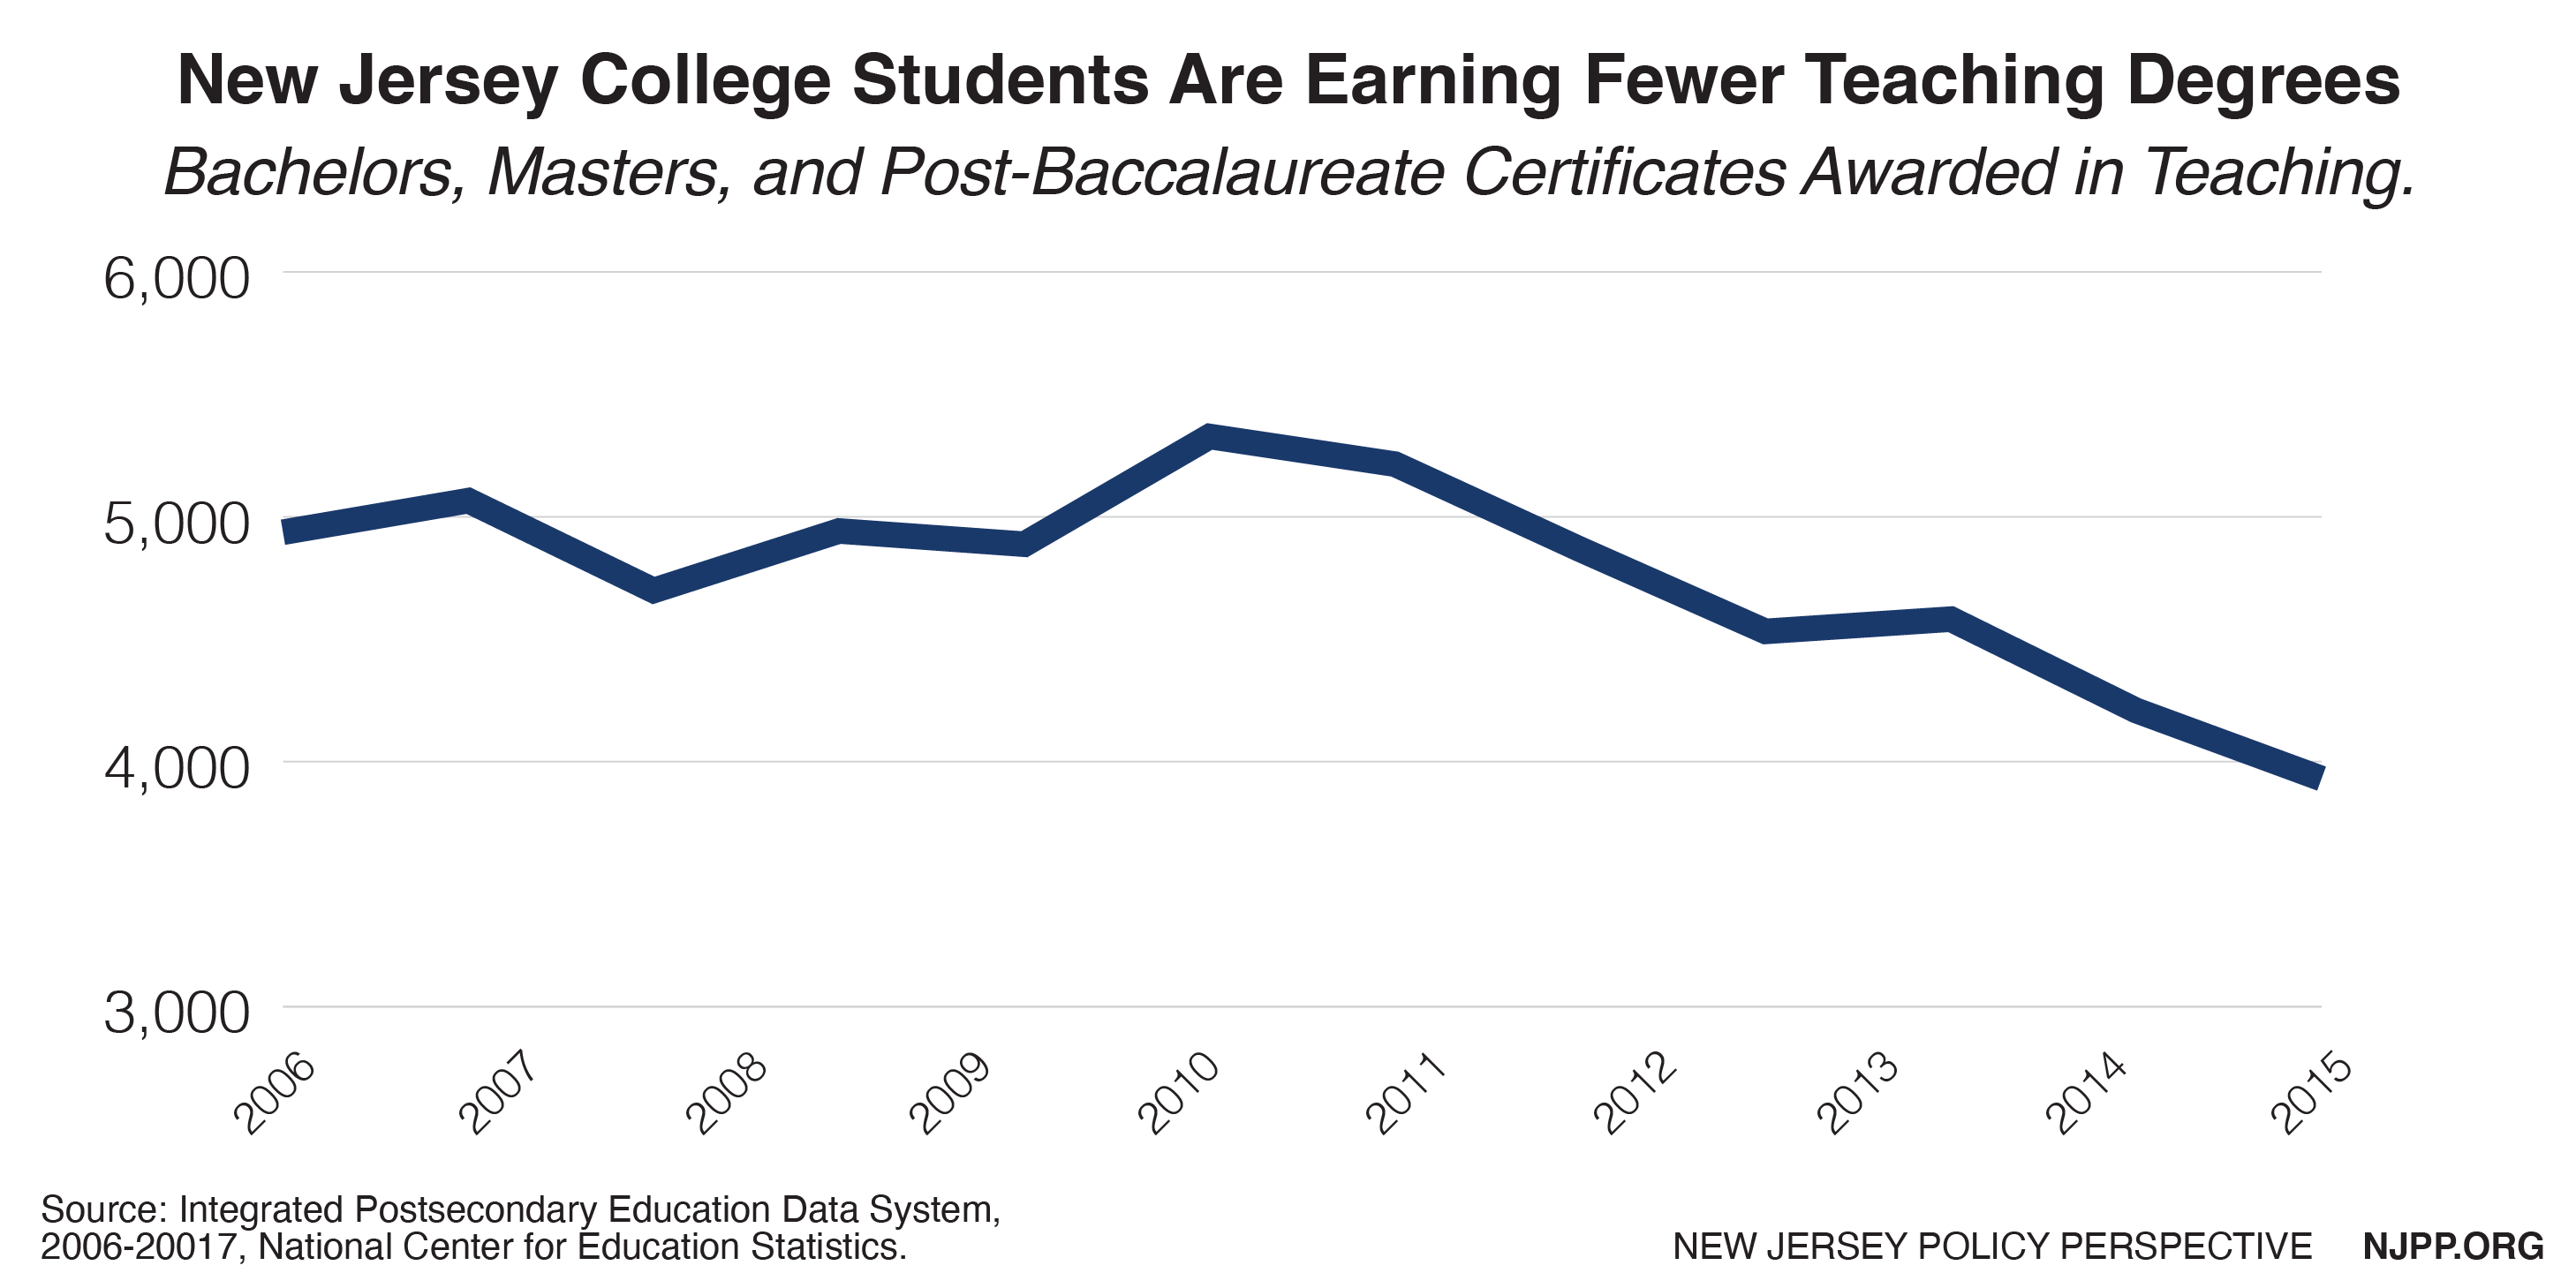
While all certificated teachers in New Jersey must meet specific academic credit requirements, it is not necessary for a teacher to have a degree in education. That said, it is useful to look at the changes in the numbers of New Jersey college students who are granted education degrees by the state’s universities. If teaching has become less attractive to college students, we would expect the number of teaching degrees to decline. The degree production data here comes from a different source than the data above; therefore, any trends here that mirror the trends above bolster the validity of this analysis.

At their peak in 2011, the state’s colleges and universities awarded 5,328 education degrees specific to teaching. By 2017, the number of teaching degrees dropped to 3,911, a decline of 26 percent. Overall, fewer students are pursuing degrees and certificates in teaching than a decade ago.

Graph: New Jersey college students are earning fewer teaching degrees.
Figure 9

Completers by Institution of Higher Education

While not all teacher candidates pursue degrees in education, institutions of higher education (IHEs) are the primary providers of teacher preparation programs. Federal Title II data break down completers by IHE, allowing us to evaluate program trends and assess which colleges are producing the most teachers.

While there is substantial variation from year-to-year in the number of enrollees and completers, the simplified data here shows the number of teacher prep program completers in 2008-09 and 2017-18. This comparison allows us to look across a substantial number of years at the changes in completion for each IHE.

Graph: Most New Jersey colleges see decline in teacher candidates.
Figure 10

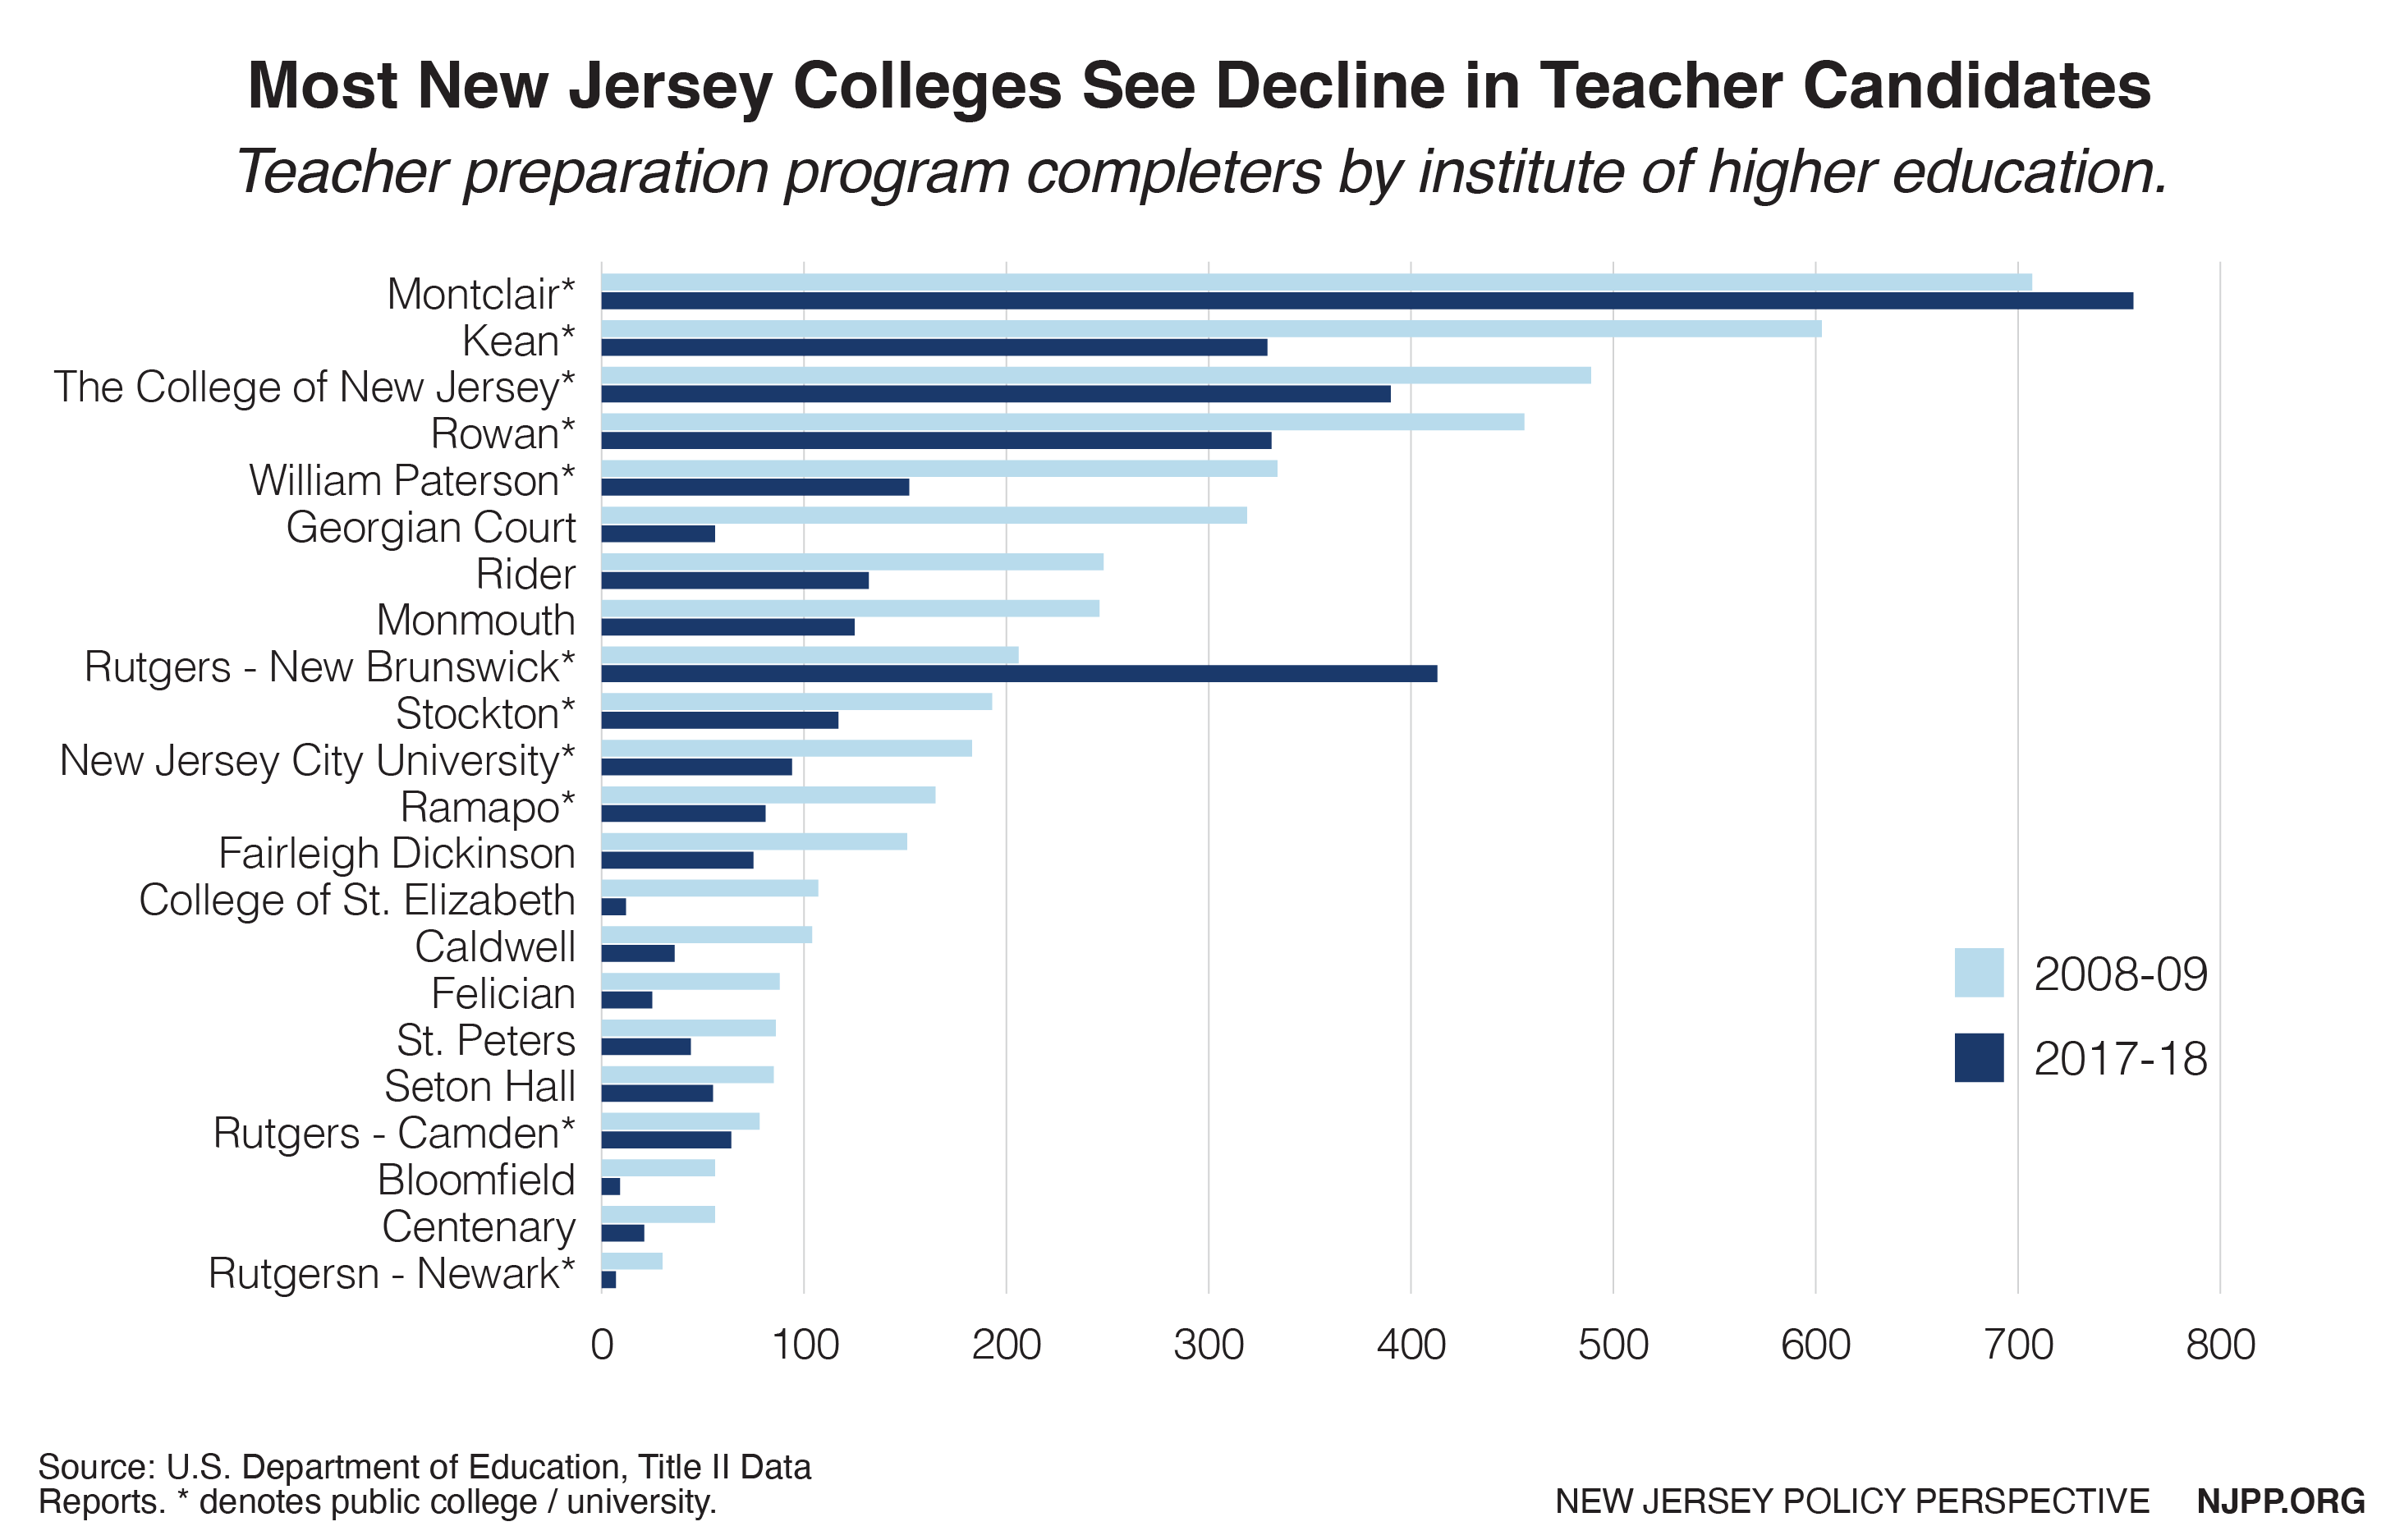
Montclair State University, the state’s largest teacher program provider, has had a modest increase in completers over this time. Rutgers-New Brunswick has had a substantial increase, although much of this occurred within the last year of the available data. In contrast, the largest decline in teacher prep program completers has been at Kean University, which had almost half the completers in 2017-18 than it did in 2008-09. The College of New Jersey (TCNJ), Rowan University, and William Paterson University have also had notable declines.

New Jersey’s private colleges and universities produce far fewer teacher program completers than its public postsecondary institutions. The most notable decline has been at Georgian Court University, which had 319 completers in 2008-09, but only 56 in 2017-18.

These changes occurred at a time when the NJDOE Alternate Route program, which produced 1,819 program completers in 2011-12, was disbanded. Clearly, New Jersey’s colleges and universities were unable to produce an additional equivalent number of teacher candidates to fill the gap left by the “Alternate Route” program.

Conclusions and Recommendations

The data show that fewer people are entering and completing teacher programs. Working conditions and other factors such as the decline in pay (as compared to other professions), eroding benefits, and punitive policies are likely contributing to the shortage. Given the importance of teachers, the decline in teacher candidates should be a serious concern for New Jersey’s education policymakers. The demand for new teachers has returned to pre-recession levels, but the number of available candidates per 1,000 students has decreased significantly, threatening the state’s quality of education in the long-term.

If New Jersey is to retain its rank as one of the best performing statewide school systems in the United States, it must do a better job of attracting teaching candidates – particularly candidates of color.[17] Toward that end, the following changes are recommended:

  1. Teacher compensation must rise to attract the best possible candidates into the profession. If we want to attract high-quality candidates into teaching, we must offer teachers competitive wages. Given the rising costs of earning a degree, college-educated workers have more incentive than ever to seek out careers that will maximize the return on their investment in college tuition.[18] Consequently, if we want great teachers, we must offer them a compensation package that reflects the value of their work. Other sectors face the same challenges when determining how to attract and maintain a high-quality workforce — teaching is no different.
  2. New Jersey must shore up its teacher pension system and stop degrading teacher health care benefits. There is an indisputable wage gap between teachers and other college-educated employees. Good benefits can help close this gap, but New Jersey has, over the past decade, degraded the value of teacher pensions and health care benefits.[19] The decline in enrollees in teacher preparation programs suggests that these policies have had detrimental consequences. The state must take steps to reverse the eroding value of retirement and health care benefits for teachers.
  3. The state should streamline the process of obtaining a teacher certification as much as possible without sacrificing rigor. Whether the state was previously overproducing teacher candidates is an open question. There is little doubt, however, that the number of teacher candidates has decreased while the number of students has stayed the same. New Jersey should review its certification and preparation programs for teachers to determine whether their requirements impede entry into teaching without adding value to a teacher’s training.[20]
  4. All of the state’s teacher preparation providers should continue to work together to attract teacher candidates of color. As previous research shows, there are many benefits to having a diverse teacher workforce.[21] New Jersey has recently made commendable efforts to recruit men of color into the profession. These efforts should be evaluated as quickly as possible and, if found successful, expanded.
  5. New Jersey’s leaders should commit to improving the state’s level of appreciation and regard for its educators. The surest, easiest – and cheapest – way to boost teacher morale is for elected officials to show respect for teachers by acknowledging the importance of their work, giving them a seat at the table when decisions are made about education policy, and refraining from unfairly blaming them for New Jersey’s fiscal troubles.


In a 2018 national poll, 61 percent of superintendents strongly agreed that recruiting and retaining talented teachers would be a challenge for their school district.[22] New Jersey must implement policies to help school district leaders develop and retain the best possible teaching staffs.

Overall, New Jersey’s decline in teacher candidates is a call to action. The state should act immediately to make the teaching profession more attractive, including raising pay, shoring up benefits, and increasing the respect and appreciation shown to New Jersey’s educators.

Technical Appendix

The primary data source for this report is “2019 Title II Reports: National Teacher Preparation Data” from the U.S. Department of Education. https://title2.ed.gov/Public/Home.aspx

Data on teaching degrees is from the Integrated Postsecondary Education Data System (IPEDS), administered by the National Center for Education Statistics. https://nces.ed.gov/ipeds/ To determine the production of teaching-related degrees, I employed this methodology:

  • Include only institutions designated as offering teacher certification.
  • Include only bachelors and masters degrees, and post baccalaureate certificates.
  • Count all degrees awarded in education (cipcode “13”).
  • Count all degrees in curriculum and instruction; educational administration and supervision; educational/instructional media design; educational assessment, evaluation, and research; social and philosophical foundations of education; teaching assistants/aides; and education, other.
  • Subtract this count from the total count of education degrees.

Student counts to determine teacher candidates per 1,000 students are from the New Jersey Department of Education’s fall enrollment files. https://www.nj.gov/education/data/enr/

Staffing counts of novice teachers come from New Jersey Department of Education staffing files, which were obtained through Open Public Records Act (OPRA) requests.

Citations for New Jersey teacher policy changes in Figure 2 are as follows:

About the Author

Mark Weber is the Special Analyst for Education Policy at the New Jersey Policy Perspective. He is also a full-time public-school teacher in Warren Township (where he won the Governor’s Award for Excellence in Education in 2018), and a lecturer at Rutgers University in public school finance. Weber is the author of numerous academic papers on education policy, as well as many policy briefs published by the National Education Policy Center, the Albert Shanker Institute, the Education Law Center, the New Jersey Education Policy Forum, and others. Weber holds a Ph.D. from Rutgers University in Education Theory, Organization, and Policy.


End Notes

[1] García, E., & Weiss, E. (2019). U.S. schools struggle to hire and retain teachers. Economic Policy Institute. https://www.epi.org/publication/u-s-schools-struggle-to-hire-and-retain-teachers-the-second-report-in-the-perfect-storm-in-the-teacher-labor-market-series/

[2] Weber, M. (2019) New Jersey’s Teacher Workforce, 2019: Diversity Lags, Wage Gap Persists https://www.njpp.org/reports/in-brief-new-jerseys-teacher-workforce-2019-diversity-lags-and-wage-gap-persists

[3] Weber, M. (2019) New Jersey’s Teacher Workforce, 2019: Diversity Lags, Wage Gap Persists https://www.njpp.org/reports/in-brief-new-jerseys-teacher-workforce-2019-diversity-lags-and-wage-gap-persists

[4] Weber, M. (2019) New Jersey’s Teacher Workforce, 2019: Diversity Lags, Wage Gap Persists, p. 38. https://www.njpp.org/reports/in-brief-new-jerseys-teacher-workforce-2019-diversity-lags-and-wage-gap-persists

[5] Weber, M. (2019) New Jersey’s Teacher Workforce, 2019: Diversity Lags, Wage Gap Persists, pp. 7-8. https://www.njpp.org/reports/in-brief-new-jerseys-teacher-workforce-2019-diversity-lags-and-wage-gap-persists

[6] Preparing and Credentialing the Nation’s Teachers; The Secretary’s 10th Report on Teacher Quality. (2016) U.S. Department of Education, Office of Postsecondary Education. https://title2.ed.gov/Public/TitleIIReport16.pdf

[7] See the Technical Appendix for citations in this section.

[8] Weber, M. (2019) New Jersey’s Teacher Workforce, 2019: Diversity Lags, Wage Gap Persists, p. 36-37. https://www.njpp.org/reports/in-brief-new-jerseys-teacher-workforce-2019-diversity-lags-and-wage-gap-persists

[9] Weber, M. (2019) New Jersey’s Teacher Workforce, 2019: Diversity Lags, Wage Gap Persists, p. 23-25. https://www.njpp.org/reports/in-brief-new-jerseys-teacher-workforce-2019-diversity-lags-and-wage-gap-persists

[10] State of New Jersey, Department of Education, “New Teacher Guidance.” https://nj.gov/education/newteacher/

[11] Conversation with NJDOE staff, November 25, 2019; thanks to all the staff members who generously gave their time for this conversation.

[12] Weber, M. (2019) New Jersey’s Teacher Workforce, 2019: Diversity Lags, Wage Gap Persists, pp. 5-6. https://www.njpp.org/reports/in-brief-new-jerseys-teacher-workforce-2019-diversity-lags-and-wage-gap-persists

[13] Weber, M. (2019) New Jersey’s Teacher Workforce, 2019: Diversity Lags, Wage Gap Persists, pp. 15-19. https://www.njpp.org/reports/in-brief-new-jerseys-teacher-workforce-2019-diversity-lags-and-wage-gap-persists

[14] Carver-Thomas, D. (2018). Diversifying the Teaching Profession: How to Recruit and Retain Teachers of Color. Learning Policy Institute. https://learningpolicyinstitute.org/sites/default/files/product-files/Diversifying_Teaching_Profession_REPORT_0.pdf

[15] As Carver-Thomas (2018) notes: “An analysis of teacher test design later indicated that cultural bias contributed to disparate test score outcomes. Researchers found that when a version of the NTE general knowledge test replaced traditional questions with test items based on Black culture, Black women scored higher than White women. The reverse was true when questions were drawn exclusively from non-Black culture.” (p.13)

[16] O’Dea, C. (May 13, 2019). “NJ Makes Move to Recruit More Men of Color as Teachers.” NJ Spotlight. https://www.njspotlight.com/2019/05/19-05-12-nj-makes-move-to-recruit-more-men-of-color-as-teachers/

[17] Lloyd, S.C. and Harwin, A. (September 3, 2019). “In National Ranking of School Systems, a New State Is On Top.” Education Week.  https://www.edweek.org/ew/articles/2019/09/04/new-jersey-tops-national-ranking-of-schools.html

[18] U.S. Department of Education, National Center for Education Statistics. (2019). Digest of Education Statistics, 2017 (NCES 2018-070), Chapter 3. https://nces.ed.gov/fastfacts/display.asp?id=76

[19] Weber, M. (2019) New Jersey’s Teacher Workforce, 2019: Diversity Lags, Wage Gap Persists, pp. 26-28. https://www.njpp.org/reports/in-brief-new-jerseys-teacher-workforce-2019-diversity-lags-and-wage-gap-persists. See also: Jeffrey H Keefe, “New Jersey Public School Teachers Are Underpaid, Not Overpaid” (Economic Policy Institute, February 15, 2017), https://www.epi.org/publication/new-jersey-public-school-teachers-are- underpaid-not-overpaid/

[20] As an example: in 2015, the state began requiring that teacher candidates participate in edTPA, an evaluation system for teacher candidates that requires the submission of video recordings of teaching as part of a portfolio. Yet a recent evaluation of edTPA calls into question the reliability of its assessments; see: Gitomer, D. H., Martínez, J. F., Battey, D., & Hyland, N. E. (2019). Assessing the Assessment: Evidence of Reliability and Validity in the edTPA. American Educational Research Journal. https://doi.org/10.3102/0002831219890608

[21] Weber, M. (2019) New Jersey’s Teacher Workforce, 2019: Diversity Lags, Wage Gap Persists, pp. 5-6. https://www.njpp.org/reports/in-brief-new-jerseys-teacher-workforce-2019-diversity-lags-and-wage-gap-persists

[22] “Gallup 2018 Survey of K-12 School District Superintendents” https://www.gallup.com/education/241151/gallup-k-12-superintendent-report-2018.aspx

COVID-19 Unemployment Claims Will Soon Surpass Total Claims from the Great Recession

To read a PDF version of this policy brief, click here.


The public health crisis created by the COVID-19 pandemic has caused an unprecedented demand in unemployment insurance (UI), a program that compensates eligible workers who have been recently laid off due to no fault of their own. Since the beginning of March 2020 through April 25, 2020, New Jersey saw over 930,000 UI claims.[1] This is about a 1,500 percent increase in claims, when comparing April to February.[2] While federal action will be integral to support vulnerable workers and those who are now unemployed, New Jersey must also act fast to ensure that no workers are left behind in the state’s recovery.

To better understand the magnitude of this record-breaking increase, NJPP compares UI claims seen in the current recession, which we refer to as “The Great Lockdown,”[3] to the past two recessions: the Great Recession, which lasted from December 2007 through June 2009, and the Early 2000s Recession that ran from March 2001 through November 2001.[4]

Unemployment claims made in the first weeks of the COVID-19 pandemic drastically surpass any week of the previous recessions. In fact, the total number of claims made in the current recession is over three quarters of claims seen during the entirety of the Great Recession and almost twice the amount seen during the entire early 2000s recession.[5] We expect that the total claims made by the end of May will surpass all the jobless claims made during the Great Recession.

A screenshot of a cell phone

Description automatically generated

Another way to understand the magnitude of job loss resulting from COVID-19 is to determine how much of the labor force has filed jobless claims. As seen below, so far, a record-breaking 7.4 percent of the labor force has applied for job loss claims in March, and this is expected to rise in April, when new labor force data is available.

The overwhelming number of UI claims has placed an enormous strain on the state’s Department of Labor and Workforce Development, the agency tasked with administering these benefits. New Jersey’s UI system is collapsing under the weight of so many applications, due in part to dated technology and a department staff that is 25 percent lower than it was over a decade ago.[6] Job loss also strains other agencies, such as the Departments of Health, Human Services, and Community Affairs, as many workers have also lost their employer-provided health insurance and need additional assistance to pay for essentials like food and rent.

To meet this increased demand for safety net programs, relief packages from the federal government — such as the Coronavirus Aid, Relief, and Economic Security (CARES) Act — are critical. The CARES Act made necessary expansions to state UI programs to help relieve some of the economic decline caused by the COVID-19 pandemic.[7] It includes Pandemic Unemployment Assistance, which expands benefit eligibility for those not eligible for their state UI program, such as self-employed workers, independent contractors, and part-time workers. It also contains Pandemic Unemployment Compensation, which increases the maximum unemployment benefit above one’s base unemployment compensation benefit through July 2020 by $600 per week. Finally, it includes Pandemic Emergency Unemployment Compensation, which extends unemployment benefits for an additional 13 weeks.

The CARES Act relief package will not be enough, however. New Jersey cannot meet all these immediate and approaching needs on its own, especially since the state does not have a sufficient Rainy Day Fund or any major progressive tax strategies to raise sufficient revenue. In fact, the state may likely borrow federal funds to cover unemployment claims, in addition to cover revenue shortfalls.[8] From the beginning of March through April 25, the state has distributed about $1.4 billion in unemployment related claims.[9] 

These record-breaking UI numbers also severely undercount the extent of job loss in New Jersey, as not all workers are eligible for unemployment assistance and are thus not filing claims. For instance, undocumented workers, who make up over 15 percent of the workforce in industries most affected by COVID-19, are excluded from much of the relief provided by the federal government. What’s more, other immigrant workers must have valid work authorizations during the base period,[10] at the time they apply for benefits, and throughout the period that they are receiving benefits,[11] making it more difficult to qualify. If New Jersey fails to step in and prioritize these workers throughout its recovery, the economic fallout will be much worse. (For more see, NJPP’s Undocumented Workers in Service Sector Most Likely to be Harmed by COVID-19.

Job loss claims are just one indicator to understanding the extent of this health pandemic and the repercussions that will be felt throughout the economy. Currently, they understate the impact of the virus. These claims are expected to rise beyond what most of us have seen in our lifetimes. To respond to this unprecedented surge in job loss, it is imperative that the state step in and ensure that no worker or family is left behind.


End Notes

[1] U.S. Department of Labor, Unemployment Insurance Weekly Claims Data for New Jersey. Accessed 4/30/2020 https://oui.doleta.gov/unemploy/claims.asp

[2] U.S. Department of Labor, Unemployment Insurance Weekly Claims Data for New Jersey. Accessed 4/30/2020 https://oui.doleta.gov/unemploy/claims.asp

[3] NJPP analyzes UI claims starting the first week of March 2020 to determine the start of the Great Lockdown for NJ.

[4] The National Bureau of Economic Research, US Business Cycle Expansions and Contractions. 2010. https://www.nber.org/cycles.html

[5] Total UI claims for Early 2000s Recession is about 399700 and for the Great Recession is about 1,088,000. U.S. Department of Labor, Unemployment Insurance Weekly Claims Data for New Jersey. Accessed 4/24/2020 https://oui.doleta.gov/unemploy/claims.asp

[6] New Jersey Policy Perspective, Years of Disinvestment Hamper New Jersey’s Pandemic Response. April 2020. https://www.njpp.org/budget/years-of-disinvestment-hamper-new-jerseys-pandemic-response

[7] U.S. Department of Labor, Unemployment Insurance Relief During COVID-19 Outbreak. 2020. https://www.dol.gov/coronavirus/unemployment-insurance

[8] POLITICO New Jersey, Murphy: New Jersey likely to borrow federal funds to cover unemployment. April 25, 2020. https://subscriber.politicopro.com/states/new-jersey/whiteboard/2020/04/25/murphy-new-jersey-likely-to-borrow-federal-funds-to-cover-unemployment-9422713

[9] New Jersey Department of Labor, Unemployment Payments Surpass 500K; $1B in Benefits Distributed Since Pandemic Began. April 30, 2020. https://www.nj.gov/labor/lwdhome/press/2020/20200423_weeklypayments500k.shtml

[10] Base period is the recent work history timeframe used to determine if one qualifies for UI benefits and to calculate the benefit amount. 

[11] National Employment Law Project (NELP), Immigrant Workers’ Eligibility for Unemployment Insurance, April 2020. https://www.nelp.org/publication/immigrant-workers-eligibility-unemployment-insurance/

Undocumented Workers in Service Sector Most Likely to be Harmed by COVID-19

To read a PDF version of this policy brief, click here.


Since the onset of the COVID-19 pandemic, New Jersey workers and businesses alike have faced mounting and unprecedented challenges. Public health precautions meant to contain the spread of the outbreak, like necessary business closures and stay-at-home orders, have disrupted the state’s economy, especially the service sector that relies on server-customer interactions. Immigrant workers, who make up a disproportionate segment of the service sector workforce, will likely be hit hardest by the COVID-19 pandemic. These same workers are excluded from much of the relief provided by the federal government. 

The industries most hurt by the necessary social distancing and public health directives include restaurants, bars, hotels, entertainment, non-food retail, passenger transportation, and personal care services. Taken together, these industries accounted for nearly 800,000 jobs in 2018, representing almost a quarter of New Jersey’s private-sector employment at 22.9 percent. These industries also accounted for $25.9 billion in annual payroll, or 11.4% of total private sector income.

The majority of these jobs are low-paid, with annual earnings significantly lower than the state average. Due to decades of racial and ethnic discrimination, these industries are a key source of employment for low-income workers, immigrants, and communities of color. Undocumented immigrants, who make up approximately 6 percent of New Jersey’s population, account for a disproportionate 15.7 percent of the workforce in these service sector industries.[1] In total, there are approximately 125,000 undocumented workers employed in the service sector industries that are most likely to be harmed by the pandemic.

To contextualize the high percentage of immigrant workers in service sector industries, a 2017 report by Janice Fine, Director of Research and Strategy at the Center for Innovation in Worker Organization (CIWO) at Rutgers, finds:

“[The] de-unionization and erosion of labor markets preceded the arrival of immigrants. The shift to non-union subcontracting is what led native workers to leave those jobs. The industries then shifted to immigrant labor, but labor standards in the industries had dramatically diminished. This deterioration of labor markets and working conditions, however, cannot be understood as an inevitable product of market forces. Much of the change has been shaped by a combination of firm management practices, outdated employment laws, and the lack of effective labor standards enforcement.”

As the COVID-19 pandemic and resulting economic downturn rage on, it will be critical for New Jersey policymakers to implement policies that improve working conditions across all sectors, especially the industries that contain a larger share of the low-paid workforce. Past recessions have worsened inequality as governments responded with austerity policies that cut taxes for wealthy families and corporations and failed to support low- and middle-income families with vital relief. This approach has led to major negative impacts on the health and general well-being of low-income and middle-class families, especially for immigrants. If the state’s policy response doesn’t prioritize these families throughout its recovery, they are sure to fall even further behind. 


End Notes

[1] NJPP analysis of total unauthorized population in New Jersey and total state population. Migration Policy Institute, Profile of the Unauthorized Population: New Jersey. https://www.migrationpolicy.org/data/unauthorized-immigrant-population/state/NJ; U.S. Census Bureau, Population Division, Table 1. Annual Estimates of the Resident Population for the United States, Regions, States, and Puerto Rico: April 1, 2010 to July 1, 2019. https://www.census.gov/data/tables/time-series/demo/popest/2010s-state-total.html#par_textimage_1574439295

New Jersey Must Expand Paid Sick Days During Coronavirus Outbreak

As the COVID-19 outbreak spreads across New Jersey, public health experts are advising those who feel sick to stay home. Fortunately, New Jersey is one of 12 states plus Washington D.C. to guarantee access to earned sick leave, ensuring workers do not lose pay if they call out sick. Of these states, New Jersey is among the few that includes coverage for public health emergencies. All businesses must provide paid leave to employees, with a few exceptions including independent contractors and per diem health workers.

How The Law Works

New Jersey’s Earned Sick and Safe Days Act allows workers to accrue one hour of earned sick leave for every 30 hours worked, which workers can then use after being on the job for 120 days. Workers can accrue up to 40 hours — or five full days — each year. The law applies to any person, firm, business, educational institution, nonprofit agency, corporation, limited liability company, or other entity with New Jersey-based employees, including a temporary help service firm. Employers of every size are covered, including employers based outside of New Jersey. 

How New Jersey Can Expand Paid Sick Leave Protections

It’s a triumph that New Jersey has this policy in place at this critical moment. But given the magnitude of this public health crisis, New Jersey must take immediate action to further protect its workforce by ramping up efforts to inform employees of their rights and improve the existing earned sick day law. No worker should have to make a choice between going to work sick, putting others at risk of a highly contagious virus, and potentially falling behind on living expenses during these extraordinary circumstances.

NJPP is a proud member of the New Jersey Time to Care Coalition, which supports initiatives that make sure working families have paid time off to care for themselves and their families in times of need. Time to Care recommends the following expansion to the Earned Sick and Safe Days Act to help slow the COVID-19 virus and provide financial stability for all New Jersey families.

  • Immediately require 14 additional days of paid sick leave when there is a public health outbreak or emergency. 
  • Remove the 120 day waiting period after an employee’s first day of work to access their accrued paid sick days.
  • Include coverage for workers currently excluded under the law. These include per diem health care workers, independent contractors, construction workers under a union contract, and public employees already receiving paid sick at full pay under another state policy.
  • Remove the ability for employers to require a doctor’s note after 3 days of consecutive absence, and allow for self-certification in lieu of documentation.

New Jersey lawmakers can and should expand the Earned Sick and Safe Day Act immediately, as many workers do not have the ability to work remotely and cannot easily quarantine themselves without fear of losing wages. Making these changes to the law will help prevent unnecessary spread of the COVID-19 virus, mitigate harm to our communities, and provide necessary relief to already stressed health and social systems.

NJPP: Public Charge Rule is a Discriminatory Income Test

Earlier today the U.S. Supreme Court voted 5-4 to allow the Trump administration’s “public charge” rule change to take effect. The new rule makes it more difficult for immigrant families to obtain legal permanent residence if they have used, or are deemed likely to use, public health benefits. In response to the Supreme Court’s decision, NJPP releases the following statement:

Erika Nava, Policy Analyst, New Jersey Policy Perspective:

“The Supreme Court decision is a devastating blow to working-class immigrant families in search of the American Dream. The new rule imposes a discriminatory income test to the immigration system and will force many immigrants to choose between having their basic needs met and being separated from their family. Penalizing families who qualify for public assistance runs counter to this nation’s values and must be stopped. In the meantime, immigrant families should not be fearful, but educated on the new public charge rule so they can make the best decisions for themselves and their families as they navigate the immigration process.”

For more info on the “public charge” rule change, read NJPP’s Public Charge FAQ from December 2019: https://www.njpp.org/blog/faqs-the-public-charge-rule-change#What-Would-Change

# # #

New Jersey Can Make Overtime Pay

On January 1, 2020, the Trump administration set a new threshold under which salaried workers are automatically entitled to overtime pay at $35,568 a year. This rule leaves behind thousands of New Jersey workers who would have received overtime protections under the much stronger rule, published in 2016, that was abandoned by the Trump administration.

But all is not lost. New Jersey can step up to protect its workers by creating its own, stronger overtime rule, similar to the policies implemented in New York, Washington, and California.[1] Specifically, the Murphy administration can implement its own rule to restore and strengthen the state’s overtime protections.

If New Jersey adopts its own overtime threshold at 2.5 times the minimum wage—$78,000 by 2024—it would restore the standard that existed from the 1940s through the late 1970s. Under this threshold, 287,000 more workers would gain new overtime protections than under the Trump administration’s new overtime threshold. In total, by 2024, when the minimum wage will reach $15 an hour, 842,000 salaried white-collar workers — or 38 percent of all salaried workers — would gain coverage. Of those workers, 315,000 would gain overtime protections for the first time and 528,000 would have strengthened protections, as they would be less likely to be misclassified as exempt, white-collar workers. 

Workers deserve the right to overtime pay and New Jersey should take the necessary steps to make that happen. By raising the overtime threshold, the Murphy administration has the chance to right the wrongs of the Trump administration and protect New Jersey’s working families with the pay and protections they are due.

For more, read NJPP’s report, “Valuing Our Time: Strengthening New Jersey’s Overtime Law.


End Note

[1] National Employment Law Project and Economic Policy State. Federal Overtime Thresholds and State Responses. https://www.nelp.org/wp-content/uploads/Federal-State-Overtime-Proposals-Dec-2019.pdf

New Jersey’s Minimum Wage Rises to $11.00

More than 1 in 9 workers across the state will see a modest increase in their take-home pay on January 1, 2020, when the minimum wage increases to $11 an hour. This increase will boost the economic security of over 460,000 workers and represents the second phase of a six-step increase to the $15 minimum wage approved by state lawmakers in 2019.

Of these 460,000 workers, they are mostly adults, workers of color, women, and many are parents.[1]

Local businesses also benefit as minimum wage workers’ spending power increase by $480 million in 2020.[2] When consumer spending increases, so can the demand for goods and services, keeping money circulating in the economy and furthering a virtuous cycle that benefits workers, local businesses, and communities.

While all minimum wage workers will see an increase in 2020, not all wage increases will be the same nor will all minimum wage workers be entitled to a $15 minimum wage by 2024:

  • Tipped workers’ wages will go up slightly from $2.63 to $3.13 on January 1, 2020, and only to $5.13 by 2022.[3]
  • Minimum wage workers who are seasonal or who work at small businesses (with fewer than six employees)[4] will also see an increase from $8.85 to $10.30 in 2020. However, they will not reach $15 until 2026.[5]
  • Farmworkers’ wages will increase from $8.85 to $10.30 in 2020 and will reach $15 in 2027.[6]

Once fully phased-in, the minimum wage will increase every year to inflation. With the exception of tipped workers, seasonal, farm, and workers at small businesses will reach the full-minimum wage by 2030.

For more information on the phase-in schedule of New Jersey’s $15 minimum wage, see our previous blog here.


End Notes

[1] Economic Policy Institute Minimum Wage Simulation Model using data from the Census Bureau, Bureau of Labor Statistics, and Congressional Budget Office. See EPI Minimum Wage Simulation Model 2019. Dollar values adjusted by projections for CPI-U in CBO August 2019 projections. https://www.epi.org/publication/minimum-wage-simulation-model-technical-methodology/

[2] Ibid. 1.

[3] State of New Jersey. Department of Labor and Workforce Development. “New Jersey’s Minimum Wage.” nj.gov/labor/forms_pdfs/wagehour/minimumwage_postcard.pdf

[4] Businesses with less than six employees.

[5] Ibid. 3.

[6] Ibid. 3. Please note that no later than March 31, 2024, the Commissioner of Labor and Workforce Development and Secretary of Agriculture will review the minimum wage’s impact on farm employers and on the State’s agricultural industry. Through this, they will be able to suggest whether to continue or pause the minimum wage increases for farmworkers. Subsequently, the legislature would decide whether they want to take legislative action on suspending the remaining increases.

FAQs: The Public Charge Rule Change

UPDATE: On Monday, January 27, 2020 the U.S. Supreme Court voted 5-4 to allow the public charge rule change to take effect.

New Jersey is home to the nation’s third largest share of immigrants, both documented and undocumented, who contribute greatly to the social and economic fabric of the state. Under the Trump administration, New Jersey’s immigrant residents face greater threats that put their health, safety, and future prosperity at risk. One such threat is the federal administration’s attempt to change the “public charge” policy, an inadmissibility test designed to identify people who may need public benefits in the future.[1] If the test determines that someone is likely to become a public charge, they would be denied admission to the United States or not be allowed to adjust their immigration status to lawful permanent residence (i.e. obtain a green card).[2] This brief answers frequently asked questions about the proposed public charge rule change.

It is important to note that immigrant families should not be fearful but educated on the issue of public charge so that they can make the best decision for themselves and their families.

What is the current public charge policy?

The public charge policy is a test that determines whether an immigrant is likely to use public cash assistance or institutional long-term care. The test applies to those who are applying for entry to the U.S., or for those seeking lawful permanent residence. Additionally, immigrants with green cards who are outside of the United States for more than six months could be subject to the public charge rule when they return.

The programs considered in the test are federal and state public cash assistance programs including Temporary Assistance for Needy Families (TANF), Supplemental Security Income (SSI), General Assistance, and institutional long-term .[3]If deemed a public charge, a person can be barred from entering into the U.S. or from obtaining lawful permanent residence status (LPR).  (For more on which specific state programs are considered under the rule, see section, “Would the public charge rule change immigrants’ access to New Jersey programs”).

Who is subject to public charge?

The public charge rule primarily applies to people seeking to immigrate to the U.S. or adjust their immigration status to Legal Permanent Residents (LPRs) or green card holders through family-based petitions. It also will affect certain people seeking to extend or adjust their non-immigrant status (i.e. tourists) while in the U.S. [4]

Who is not subject to public charge?

Naturalized U.S. citizens are not subject to a public charge inadmissibility determination, nor are immigrants with lawful permanent residence status (LPR). Additionally, humanitarian immigrants, such as survivors of trafficking, domestic violence or other serious crimes, special immigrant juveniles, and certain other immigrants are not subject to a public charge test.

Other immigrants who are not subject to a public charge test include those who apply for:

  • Deferred Action for Childhood Arrivals (DACA) renewals
  • Refugee status
  • Asylum status
  • Temporary Protected Status (TPS)
  • T and U visas (for victims of human trafficking and serious crimes or witnesses of certain crimes)

Which agencies enforce public charge?

The public charge policy is enforced by both the Department of Homeland Security (DHS) and the State Department. DHS is responsible for administering requests for adjustment of status and visas inside the United States and the State Department is responsible for handling similar requests made outside the U.S.

What would change under the new public charge rule?

In August 2019, the Trump administration proposed a radical change in the public charge policy that would expand the scope of public benefit programs considered in a public charge determination. The proposed rule change, which was scheduled to take effect on October 15 2019, includes public benefits programs such as the Supplemental Nutrition Assistance Program (SNAP), Medicaid, and certain subsidized housing programs.[5] The rule would apply a similar test to people seeking to extend or change their temporary visas, such as students or temporary workers.

Federal courts have temporarily blocked implementation of the rule for immigrants within the U.S., which is administered by the Department of Homeland Security. One court found that the rule raised serious questions about whether it violates the Equal Protection clause as well as the Rehabilitation Act, which prohibits discrimination against individuals with disabilities. The courts also found that the rule would cause immediate irreparable harm to states, counties, and organizations serving immigrants and their families.[6] In response, the Trump administration appealed these decisions. 

However, the court’s actions do not apply to public charge determinations made outside of the U.S. by the State Department. The new public charge rule will be enforced by the State Department once new forms are finalized.

What is the public charge policy for immigrants who have applications processed outside the United States?  

Outside the U.S., immigration officials within the State Department oversee visa applications and adjustment of status applications. In January 2018, the department revised its Foreign Affairs Manual (FAM) to change how immigration officials should weigh the affidavit of support that many U.S. sponsors must provide to demonstrate that an applicant will not become a public charge. In the past, an affidavit of support was generally considered enough to outweigh any public charge barrier.[7]

The FAM instructions also introduced other factors and thresholds that can be considered in a public charge test, such as new income thresholds, age, health, and health insurance considerations. Although it did not change the public charge definition, it allows officers to consider the use of any benefits by the applicant, family members or sponsors, thereby giving State Department officials more discretion to decide who is denied or approved.[8] 

In fiscal year 2019, the State Department denied 5,343 immigrant visa applications for Mexican nationals based on their likelihood of becoming a public charge. This is a substantial increase from just seven denials under the last full year of the Obama administration.[9]

What other factors are used to determine public charge outside the United States?

The public charge test is based on a “totality of circumstances” assessment. This includes the applicant’s age, health, family status, income and resources, education and skills, and the validity of an affidavit of support. Positive factors can be weighed against negative factors, and no one factor will determine the outcome.

The following characteristics are considered under the Foreign Affairs Manual (FAM):

  • Income, specifically whether the applicant earns less than 125 percent of the federal poverty level
  • Age, specifically whether the applicant is 18 or younger or 62 and older
  • Health, including complications that could interfere with the ability to work or care for oneself, increase future medical expenses, or require institutionalization
  • Education, specifically whether the applicant has less than a high school degree
  • Family size
  • Prior history of using public benefits

Would the public charge rule change immigrants’ access to New Jersey programs?

Immigrants, regardless of status, who participate in state-funded programs — with the exception of WorkFirst NJ, which includes TANF and General Assistance — would not have their benefits considered under the public charge rule because the programs are state funded.

In New Jersey, immigrants who are undocumented and meet certain criteria are eligible for the following programs: in-state tuition, state financial aid, and NJ FamilyCare. These benefits would not be considered in the DHS or State Department public charge test.

Additionally, if New Jersey joins other states in expanding access for undocumented immigrants to obtain state health care, driver’s licenses, or other state-funded programs, these benefits would not be counted under the public charge rule.

How would the public charge rule change harm immigrant families?

The public charge rule is purposely complicated to instill fear in immigrant families, even if the new rule does not apply to them. As a result, many immigrants and their U.S. citizen family members have unenrolled or foregone public services that they are entitled to.[10] This is also known as the “chilling effect” of the public charge rule change. In New Jersey, it is estimated that 690,000 people — including 250,000 children — may be harmed by the chilling effect. This represents 34.5 percent of the state’s immigration population.[11]

According to a survey by the Urban Institute, one in every seven adults in immigrant families avoided signing up for a public benefit program in 2018 because of the public charge rule’s chilling effect.[12] In addition, half of health care centers around the nation reported that immigrants have declined to enroll or re-enroll themselves or their children in Medicaid in the past year for fear of the public charge rule. This was found to be especially true among immigrant pregnant women, according to the Kaiser Family Foundation.[13]

To reduce the negative impact that the chilling effect has on immigrant families and their U.S. citizen family members, it is important for community organizations and state agencies to conduct outreach, clarifying what the public charge rule is and what it means.

Would  the public charge rule change harm New Jersey’s economy?

The new public charge rule, by harming immigrants and their families, also damages the broader state economy. As fewer immigrants sign up for health and nutrition programs, New Jersey can expect to lose $367 million in federal benefits.[14] The loss of these benefits could, in turn, harm local communities. Businesses such as grocery stores and supermarkets will likely lose income due to a decrease in SNAP enrollment.[15] Similarly, hospitals and health care providers will likely lose revenue with reduced enrollment in Medicaid and the Children’s Health Insurance Program (CHIP).

Overall, if the public charge rule change takes effect, New Jersey’s GDP is estimated to decline by as much as $709 million, with a related loss of 4,826 jobs and $38 million in lost state tax revenue, according to an analysis by the Fiscal Policy Institute.[16]


Acknowledgements

NJPP would like to thank Tanya Broder from the National Immigration Law Center (NILC) for reviewing this FAQ.


End Notes

[1] Protecting Immigrant Families. Updated: What Advocates Need to Know Now. Public Charge FactSheet. October 2019. https://protectingimmigrantfamilies.org/wp-content/uploads/2019/10/Public-Charge-10.17.19-Update.pdf

[2] Ibid 1.

[3] Ibid 1.

[4] Kaiser Family Foundation. Changes to “Public Charge” Inadmissibility Rule: Implications for Health and Health Coverage. August 2019. https://www.kff.org/disparities-policy/fact-sheet/public-charge-policies-for-immigrants-implications-for-health-coverage/

[5] Ibid 1.

[6] Protecting Immigrant Families. Conference Call. October 2019.

[7] Ibid 6.

[8] Ibid 6.

[9] Hesson,Ted. Exclusive: Visa denials to poor Mexicans skyrocket under Trump’s State Department. Politico,  August 2019. https://www.politico.com/story/2019/08/06/visa-denials-poor-mexicans-trump-1637094

[10] New Jersey Policy Perspective. New Trump Regulation Puts New Jersey’s Health at Risk. August 2019. https://www.njpp.org/blog/new-trump-regulation-puts-new-jerseys-health-at-risk

[11] Fiscal Policy institute. Only Wealthy Immigrants Need Apply: The Chilling Effects of “Public Charge”. November 2019. http://fiscalpolicy.org/wp-content/uploads/2019/11/FINAL-FPI-Public-Charge-2019-MasterCopy.pdf

[12] Bernstein H. et. al. One in Seven Adults in Immigrant Families Reported Avoiding Public Benefit Programs in 2018. Urban Institute. https://www.urban.org/research/publication/one-seven-adults-immigrant-families-reported-avoiding-public-benefit-programs-2018 

[13] Tolbert. S. etl. Al. Impact of Shifting Immigration Policy on Medicaid Enrollment and Utilization of Care among Health Center Patients. Kaiser Family Foundation. October 2019. https://www.kff.org/medicaid/issue-brief/impact-of-shifting-immigration-policy-on-medicaid-enrollment-and-utilization-of-care-among-health-center-patients/

[14] Ibid 11.

[15] Ibid 11.

[16] Ibid 11.

Top Six Reasons to Expand Access to Driver's Licenses

To read a PDF version of the full report, click here.


Removing barriers to opportunity is necessary for growing strong economies and resilient communities. Over the past few years, 14 states, the District of Columbia, and Puerto Rico have expanded access to driver’s licenses to all residents, creating broadly-shared opportunity through safer roads, increased state revenue, and enhanced economic opportunities for working people while removing the fear of deportation for minor traffic offenses.[i]

The latest proposal in the New Jersey legislature (A4743 / S3229) includes best practices from other states and would make it possible for 737,418 more New Jersey residents to obtain a much-needed driver’s license.[ii] It would also give everyone the opportunity to apply for a standard license if they do not want to get a REAL-ID due to privacy concerns.[iii]

Here are the top six reasons why driver’s license expansion is good public policy for all New Jersey residents.

1. Makes the Road Safer for Everyone

Driver’s license expansion would ensure that all drivers are trained, tested, and insured, making New Jersey’s roads safer. Road safety is critical in the Garden State, where over four in five workers commute to work by some form of private transportation each day.[iv]

Based on the experiences of some other states, licensing more drivers reduces fatal car accidents and the overall number of hit-and-run accidents. A 2017 study of California’s law found that driver’s license expansion reduced hit-and-run accidents by 10 percent (or 4,000 accidents) within just a few years of implementation.[v] Connecticut had a similar decline between 2016 and 2018 when hit-and-run accidents dropped by nine percent.[vi]

New Jersey is primed to experience a similar reduction in accidents with driver’s license expansion due in part to the state’s high percentage of uninsured drivers. As of 2015, one in seven New Jersey drivers were uninsured, ranking among the top 15 states with the highest rate of uninsured drivers in the nation.[vii]

For more information, see “Share the Road: Allowing Eligible Undocumented Residents Access to Driver’s Licenses Makes Sense for New Jersey.”

2. Keeps Families Together and Makes Communities Safer

Immigrants without documents are under constant threat of deportation. In fact, routine traffic stops can lead to kids being separated from their parents.[viii] In addition, immigrants are uncertain how minor traffic violations can impact their future in the country since they are asked about it on the application to cancel their deportation and adjustment of status.[ix] 

Family separation comes with a social cost to immigrant families in New Jersey. Across the state, there are 168,000 children — of which, 76 percent of U.S. citizens — who have a parent without status and at risk of deportation.[x] In total, there are more than 605,000 U.S. citizens in the state who have at least one family member without status living in the same household; these residents live in constant fear that their families will be torn apart.[xi] Driver’s license expansion will make these families more mobile with a renewed peace of mind. 

In addition to helping families stay together, expanding access to driver’s licenses will make state and local law enforcement more efficient because new drivers will be more forthcoming in interacting with the police and other government agencies.[xii] Law enforcement would thus have more time to spend on critical priorities.[xiii]

3. Benefits a Large and Diverse Group of People

The ability to drive legally and safely is central to vibrant New Jersey communities where everyone can get where they need to go and provide for themselves and their families. Some communities, however, cannot access the documents they need to obtain a license. Driver’s license expansion would address these barriers for a diverse group of New Jerseyans by expanding the scope of documents accepted by the New Jersey Motor Vehicle Commission’s (MVC) 6 Point ID Verification process.

New Jersey Policy Perspective (NJPP) estimates that approximately 737,418 people will benefit from driver’s license expansion, 40 percent of whom are low-income residents.

Those Earning Under $25,000 Per Year

Residents who work in low-paying jobs face financial barriers to obtaining a driver’s license. In the Garden State, there are 288,000 adult citizens (including naturalized citizens) who earn less than $25,000 per year and are thus less likely to have state-issued identification.[xiv] For example, some low-paid residents are less likely to use a lease or utility bill as proof of address to demonstrate New Jersey residence to the MVC because they lack the financial resources to rent an entire apartment on their own.[xv]

Allowing more documents to verify New Jersey residence, such as proof of eligibility or enrollment in a state or federal safety net program, could help low-paid residents secure a license and more fully participate in their community.

Formerly Incarcerated Individuals 

Individuals who were formerly incarcerated are often prevented from obtaining a driver’s license because they lack basic identification documents like a birth certificate, Social Security card, or a state-issued photo ID. Allowing residents to verify their identify with a prison discharge slip or Department of Corrections identification card —neither of which are currently accepted by the MVC — would help thousands of New Jersey residents. In total, approximately 10,800 inmates are released each year,[xvi] about half of those individuals do not have basic identification.[xvii]

Survivors of Domestic Violence

Survivors of domestic violence often have to flee abusive partners and risk losing identifying documents. Under driver’s license expansion, the MVC would expand the scope of acceptable documents to verify one’s identity. This would benefit some of the estimated 40,000 annual survivors of domestic violence in the Garden State, helping them gain freedom and independence from their abusive partners and restart their lives.[xviii]

Immigrants Without Status

Expanding access to driver’s licenses will benefit 444,000 driving-aged residents who do not have status. Based on the experiences of other states, NJPP projects that approximately half of these residents — 222,000 — will obtain a license for the first time during the first three years of implementation.[xix] Residents across the entire state will benefit from this proposal, especially those in Central and North Jersey. Hudson County has the largest number of driving-aged immigrants without status, followed by Middlesex, Bergen, Essex, and Union Counties.[xx]

Residents Concerned About Privacy

To obtain a REAL ID license, identifying documents must be scanned into the MVC database and cross-checked by the federal government. Privacy concerns with the federal REAL ID implementation have been raised from groups on both sides of the political spectrum, including the Tea Party and the American Civil Liberties Union.[xxi] New Jersey residents who do not want their documents scanned into a federal database would be able to get a standard license without having sensitive information collected by the MVC.

For more information, see “Explainer: Why New Jersey Should Expand Access to Driver’s Licenses.”

4. Stabilizes Insurance Premiums

New Jersey drivers pay some of the highest automobile insurance premiums in the nation, with an average payment of $1,309 per year.[xxii] At the same time, the state has among the highest rates of uninsured drivers in the nation at nearly 15 percent.[xxiii] When these uninsured drivers are in an accident, the associated costs are covered by drivers who are insured.

With driver’s license expansion comes a larger auto insurance pool, which would help hold down premium costs for all while generating fewer claims that originate with uninsured drivers. This was seen in California, where drivers saved $3.5 million in out-of-pocket expenses for car repairs.[xxiv]

In Utah, which has allowed immigrants without status to drive legally since 1999, the rate of uninsured motorists dropped from 28 percent in 1999 to 8 percent in 2011 — an astonishing 250 percent drop.[xxv] As a result, auto insurance rates increased at a lower rate than in other states that restricted access to driver’s licenses.[xxvi]

5. Promotes Healthier Communities

Expanding access to driver’s licenses not only broadens mobility for more residents in the state, it also addresses social determinants of health, which includes factors like neighborhood and physical environments and access to health care and education.

The effects of early childhood education are far-reaching. It can narrow achievement gaps, increase access to health-care screenings, improve nutrition, increase graduation rates, and decrease the chance of substance abuse as adults.[xxvii] However, due to the lack of a robust public transportation system, many low-income families without licenses cannot fully participate in early education and care programs.[xxviii] Yet, immigrant parents are three to five percentage points more likely to enroll their children if they have access to a driver’s license, according to a 2018 study by the University of Rhode Island.[xxix] 

6. Increases State Revenue and Boosts Local Economies

Over the first three years of implementation, driver’s license expansion is projected to generate $21 million in revenue from permit, title, and driver’s license fees.[xxx] New Jersey could also expect an additional $90 million from registration fees, the gas tax, and taxes paid on the sales of motor vehicles and auto parts.

For more information, see “Fast Facts: Driver’s License Expansion Would Pay for Itself and More.”

New Jersey’s economy will benefit further from expanding driver’s licenses to immigrants without status, who have $9.8 billion in spending power per year. Immigrants support local businesses, contribute to our communities, and form an essential part of our workforce. In fact, they pay over half a billion dollars each year in state and local taxes.[xxxi]

For more information, see “Undocumented Immigrants Pay Taxes: County Breakdown of Taxes Paid.”


End Notes

[i] Center for Popular Democracy, Safe Roads Across the Tri-State Area: The Case for Expanding Access to Driver’s Licenses in New York and New Jersey, May 2019. https://populardemocracy.org/news/publications/safe-roads-across-tri-state-area-case-expanding-access-driver-s-licenses-new-york

[ii] New Jersey Policy Perspective, Explainer Why New Jersey Should Expand Access to Driver’s Licenses, February 2019. https://www.njpp.org/blog/explainer-why-new-jersey-should-expand-access-to-drivers-licenses

[iii] The Pew Hispanic Center, Real ID, Real Problems: States Cope With Changing Rules, Late Rollout, August 2019. https://www.pewtrusts.org/en/research-and-analysis/blogs/stateline/2019/08/06/real-id-real-problems-states-cope-with-changing-rules-late-rollouts

[iv] Social Explorer Tables: ACS 2018 (1-Year Estimates) (SE), ACS 2018 (1-Year Estimates), Social Explorer; U.S. Census.

[v] Proceedings of the National Academy of Sciences, Providing Driver’s Licenses to Unauthorized Immigrants in California Improves Traffic Safety, April 2017. https://www.pnas.org/content/early/2017/03/28/1618991114

[vi] WGBH News, Licenses for Undocumented Immigrants Seem to be Showing Benefits in Connecticut, April 2019. https://www.wgbh.org/news/local-news/2019/04/16/licenses-for-undocumented-immigrants-seem-to-be-showing-benefits-in-connecticut

[vii] Insurance Information Institute, Estimated Percentage of Uninsured Motorist by State, 2015, last accessed December 2019. https://www.iii.org/table-archive/20641

[viii] American Immigration Lawyers Association, Immigration Enforcement Minor Offenses with Major Consequences, August 2011. https://www.aila.org/File/Related/11081609.pdf

[ix] See question 54 on U.S. Department of Justice’s Application for Cancellation of Removal and Adjustment of Status for Certain Nonpermanent Residents. https://www.justice.gov/sites/default/files/pages/attachments/2015/07/24/eoir42b.pdf

[x][x] [x] Migration Policy Institute, A Profile of U.S. Children with Unauthorized Immigrant Parents, January 2016. https://www.migrationpolicy.org/research/profile-us-children-unauthorized-immigrant-parents

[xi] Center for American Progress, State-by-State Estimates of the Family Members of Unauthorized Immigrants, March 2017. https://www.americanprogress.org/issues/immigration/news/2017/03/16/427868/state-state-estimates-family-members-unauthorized-immigrants/

[xii] National Immigration Law Center. Empirical Studies Support Issuance of Driver’s Licenses Without Regard to Immigration Status, May 2017. https://www.nilc.org/wp-content/uploads/2017/10/driver-license-research.pdf

[xiii] Ibid 12.

[xiv] Ibid 2.

[xv] The Pew Charitable Trusts, Without ID, Homeless Trapped in Vicious Cycle, May 2017. https://www.pewtrusts.org/en/research-and-analysis/blogs/stateline/2017/05/15/without-id-homeless-trapped-in-vicious-cycle

[xvi] State of New Jersey Department of Corrections State Parole Board Juvenile Justice Commission, Release Outcome 2011: A Three-Year Follow-up, 2016. https://www.state.nj.us/corrections/pdf/offender_statistics/2016/Release_Outcome_Report_2011.pdf

[xvii] Urban Policy Institute, Release Planning for Successful Reentry: A Guide for Corrections, Services, Providers, and Community Groups, September 2008. https://www.urban.org/sites/default/files/publication/32056/411767-Release-Planning-for-Successful-Reentry.PDF

[xviii] New Jersey Coalition to End Domestic Violence, Advocates for Domestic Violence Survivors, Women’s Reproductive Health Voice Support for Expanded Access to Driver’s Licenses for All, December 2019. https://www.insidernj.com/press-release/advocates-domestic-violence-survivors-womens-reproductive-health-voice-support-expanded-access-drivers-licenses-regardless-immigration-status-new-jersey/

[xix] For methodology, see: New Jersey Policy Perspective, Fast Facts: Driver’s License Expansion Would Pay for Itself and More, May 2019. https://www.njpp.org/budget/fast-facts-drivers-license-expansion-pay-for-itself-and-more

[xx] The Migration Policy Institute estimates the undocumented population by county. We assume that New Jersey would have a high-end participation rate, similar to Illinois’ rate of 47 percent. We project New Jersey’s rate will be slightly higher at 50 percent given driving is necessary to getting around the state’s sprawling suburbs. The Fiscal Policy Institute (FPI) similarly uses this take-up rate in their projections for New York. Thus, we multiply the number of undocumented residents of driving age (93 percent) by the take-up rate of 50 percent to project that the number of immigrants without status by county who would obtain a driver’s license during the first three years of implementation.

[xxi] The Pew Hispanic Center, Real ID, Real Problems: States Cope With Changing Rules, Late Rollout, August 2019.  https://www.pewtrusts.org/en/research-and-analysis/blogs/stateline/2019/08/06/real-id-real-problems-states-cope-with-changing-rules-late-rollouts

[xxii] Insurance Information Institute, Facts and Statistics: Auto Insurance, 2019. https://www.iii.org/fact-statistic/facts-statistics-auto-insurance

[xxiii] Ibid 7.

[xxiv] Ibid 5. 

[xxv] Latino Policy Institute at Roger Williams University, A Legal and Policy Analysis of Driver’s Licenses for Undocumented Rhode Islanders, June 2016.  https://www.rwu.edu/sites/default/files/downloads/lpi/drivers-license_report-legal.pdf

[xxvi] Ibid 5. 

[xxvii] Health Affairs, The Effects Of Early Care And Education On Children’s Health, April 2015. https://www.healthaffairs.org/do/10.1377/hpb20190325.519221/full/

[xxviii] Urban Policy Institute, Barriers to Preschool Participation for Low-Income Children of Immigrants in Silicon Valley, January 2018. https://www.urban.org/sites/default/files/publication/76991/2000586-Barriers-to-Preschool-Participation-for-Low-Income-Children-of-Immigrants-in-Silicon-Valley.pdf

[xxix] University of Rhode Island, Dissertation: Sin Papeles y Licencia: Access to Drivers’ Licenses and Participation in Early Care and Education, May 2018. https://digitalcommons.uri.edu/dissertations/AAI10790570/

[xxx] For methodology, see: New Jersey Policy Perspective, Fast Facts: Driver’s License Expansion Would Pay for Itself and More, May 2019.  https://www.njpp.org/budget/fast-facts-drivers-license-expansion-pay-for-itself-and-more

[xxxi] Institute for Taxation and Economic Policy, State and Local Contributions of Undocumented Immigrants in New Jersey, June 2017. https://www.njpp.org/wp-content/uploads/2018/04/NJ-Undoc-Immigrant-by-County-1.pdf

Prosperity for All: Expanding the Earned Income Tax Credit for Childless Workers

To read a PDF version of the full report, click here.


The Earned Income Tax Credit (EITC) is one of the most effective anti-poverty programs for working-age households in the U.S.[1] It raises incomes for workers with low-wages and advances income and racial equity. In fact, the EITC has helped millions of workers better make ends meet and afford basic needs for themselves and their families, particularly among Black and Latino households.[2]

In 2000, New Jersey created its own version of the EITC, building upon the federal credit and providing a bigger boost to the state’s working families. Originally, the state credit provided a benefit at 10 percent of the federal credit. Over the years, the value of the state credit has increased – and occasionally decreased – to the point where it now provides a benefit at 40 percent of the federal credit.

Nearly two decades after adopting an EITC in New Jersey, the impact of the program is clear. In 2018 alone, the state EITC infused $400 million into local economies and provided a much-needed boost to over 500,000 workers and families struggling to meet basic needs.[3] While both Republican and Democratic lawmakers recognize the program’s value and have supported several expansions to the credit, the EITC’s reach is still limited. Specifically, workers, who are not raising children at home, have a disproportionately lower income cap and lower maximum credit than qualifying families with children. Further, single workers who are not raising children at home lose the benefit completely after earning more than $15,570, and childless workers under the age of 25 and over 64 are completely ineligible for the credit.

Recognizing such disparities in the federal EITC, several lawmakers have proposed changes to the program. However, New Jersey does not need to wait for federal changes to be enacted. The state, like several others, can take steps to expand eligibility beyond federal rules. The following report examines these proposals and evaluates the potential impact of strengthening New Jersey’s EITC.

This report makes three recommendations to improve parity and accessibility of the state EITC:

  • Reduce the minimum age requirement for workers without qualifying children from 25 to 18.
  • Increase the refundability of the New Jersey EITC for workers without qualifying children from 40 percent to 100 percent of the federal credit.
  • Increase the income threshold for workers without qualifying children from $15,570 to $25,000.

If all three recommendations are implemented, over 400,000 workers would benefit, infusing $156 million into local New Jersey economies.

Introduction

The Earned Income Tax Credit (EITC), a refundable tax credit for low- and moderate-income working individuals and families, has long been one of the most successful tools for reducing poverty, promoting economic security, and improving the quality of life of working families. In 2017 alone, the federal EITC lifted approximately 5.7 million people out of poverty, including about 3 million children. And the credit further reduced the severity of poverty for an additional 19.5 million people, including about 7.3 million children.[4]

Recognizing the effectiveness of the EITC, federal lawmakers have repeatedly expanded the credit since its enactment as a temporary provision in 1975, including adjustments to both the amount of the credit and eligibility rules.[5] The federal EITC is now among the nation’s largest anti-poverty programs, with 25 million taxpayers receiving approximately $63 billion in 2018.[6]

In 2000, New Jersey enacted a state EITC to supplement the federal EITC. While the EITC has since boosted the economic security of workers and families in the Garden State, several groups of New Jersey workers receive little or no benefit from this program. The EITC for workers who are not raising children at home, in particular, is currently not available for people under the age of 25. Further, relative to the credit for households with children, the childless EITC has a disproportionately small income cap and low maximum credit amount. In short, the current state (and federal) EITC falls short for childless workers in New Jersey as compared to other groups.

With common-sense changes to the state EITC, New Jersey could better support hard-working taxpayers who are just entering the workforce. Further, expanding the credit for childless workers would improve parity between families with children and families who do not have qualifying children at home. The following report provides an overview of New Jersey’s EITC program, as well as an examination of other jurisdictions’ efforts to expand EITC eligibility. This report also provides an analysis of the impact of targeted expansions of EITC eligibility in the state as well as recommendations for improving the New Jersey’s EITC program.

Federal EITC Rules Exclude Childless Workers

Enacted as a part of the Tax Reduction Act of 1975 to reduce participation in federal assistance programs, encourage employment, and promote economic recovery from the recession, the EITC reduces the tax liability of low- and moderate-income workers. Each year, the federal EITC improves the economic security of Garden State residents and strengthens state and local economies. In 2018, for example, the EITC benefitted over 576,000 New Jersey workers and infused $1.4 billion into New Jersey’s economies.[7]

In order to qualify for the credit, households must have earned income and file a tax return with the IRS. The amount of the credit is a function of the worker’s income; the percentage of income increases with the amount of income until reaching a maximum credit threshold, at which point the value of the credit remains flat until it reaches a phase-out point.[8] After the phase-out point, the amount of the credit incrementally declines with additional income. If the amount of the credit that an individual or family qualifies for is greater than their tax liability, they can receive the balance as a refund.

Eligibility for the federal EITC is contingent on several factors, including age, citizenship, residency, number of qualifying children, marital status, tax filing status, and income.[9] The adjusted gross-income cap for eligibility for the federal EITC increases based on family size. In tax year 2019, for families with one qualifying child, the income cap is $41,094 ($46,884 if married filing jointly).[10] The cap rises to $46,703 ($52,493 for married filing jointly) for families with two qualifying children, and to $50,162 ($55,952 for married filing jointly) for families with three or more qualifying children. For workers without qualifying children, the income cap is substantially lower than for families with children: $15,570 ($21,370 for married filing jointly).

While the maximum credit for families with children ranges from $3,526 (for families with one child) to $6,557 (for families with three or more children), the maximum credit for childless workers is only $529. As a result, the amount of the tax credit received by the eligible childless workers is often less than their tax liability and fails to provide sufficient support to low-income workers.[11]

Source: See endnote[12]

In addition to a very low adjusted gross income cap and low maximum credit for workers without qualifying children, age and residency restrictions further limit the EITC eligibility. In order to qualify for the EITC, childless workers must be older than 25 years old and younger than 65.[13] Accordingly, while the majority of households that qualify are childless, over 90 percent of the federal EITC is distributed to families with children.[14] While this program was designed with the assumption that workers under 25 are dependent on parents, the reality is that many young New Jersey workers are struggling financially to meet their basic needs.[15]

Federal Proposals Recognize Shortfalls in EITC

During the past year, federal lawmakers have announced several proposals to mitigate poverty by strengthening tax credits for low- and moderate-income people. While the details of these proposals vary substantially, several of these proposals would improve parity between the EITC for families with children and families who do not have qualifying children at home.

The table below provides an overview of the impact of three of these proposals—the Cost of Living Refund Act of 2019, the Working Families Tax Relief Act, and the LIFT the Middle Class Act—on tax credits for childless workers. While the Cost of Living Refund Act and Working Families Tax Relief Act would expand the EITC, the LIFT the Middle Class Act would create a new credit that supplements the EITC.[16]

Sources: Center on Budget and Policy Priorities[17]; Ibid[18]; LIFT the Middle Class Act[19]

Cost-of-Living Refund Act

Introduced in both the House and Senate in February 2019, the Cost of Living Refund Act of 2019 (H.R. 1431, S. 527) would decrease the age eligibility for workers without qualifying children from 25 to 21, extend eligibility to qualified students, and expand qualified dependents to include seniors and other relatives.[20] The proposal would also increase the amount of the EITC by raising the credit percentage and phaseout amount, which would nearly double the maximum credit for households with children as well as increase the maximum credit for workers without children nearly six-fold from $529 to approximately $3,054.[21] This Act would also increase the maximum income cap for workers without qualifying children from $15,570 to $38,498, and for households with one child from $40,320 to $61,393. According to a microsimulation produced by Institute on Taxation and Economic Policy (ITEP), this proposal would lead to an $1,950 average decrease in tax liability for the poorest 20 percent of New Jersey residents (with incomes of less than $24,300) and a $1,330 average decrease for the second poorest 20 percent (those earning $24,300 to $43,500).


Working Families Tax Relief Act

Introduced by Senators Sherrod Brown, Michael Bennet, Richard Durbin, and Ron Wyden in April 2019, the Working Families Tax Relief Act would expand the EITC by changing both the eligibility rules and the amounts of the credits. In addition, it would make the Child Tax Credit (CTC) fully refundable and create a Young Child Tax Credit (YCTC) for children under age 6. The bill would expand the age limits for eligibility for the EITC for childless workers from 25 to 64 to 19 to 67. Further, this proposal would increase the maximum EITC for families with children by up to 25 percent (the exact amount depends on family size) and quadruple the benefit for workers without children.[22] The bill would also increase the phase-in and phase-out rates and raise the maximum income limits for eligibility for the credit. According to a microsimulation produced by ITEP, this proposal would lead to an $1,510 average decrease in tax liability for the poorest 20 percent of New Jersey residents (with incomes of less than $24,300) and a $560 average decrease for the second poorest 20 percent (those earning $24,300 to $43,500).[23] 

LIFT the Middle Class Act

Introduced by Senator Kamala Harris, the LIFT the Middle Class Act would create a new credit that would operate alongside the EITC. The new credit is designed to match a taxpayer’s earnings, providing up to $3,000 per worker ($6,000 for a married couple). In addition, this credit would consider income from Pell grants, a need-based form of financial aid for college students. Because the credit does not take family size into account and drops the minimum age requirement for all workers to 18, all childless workers would see considerable increases in tax credits under this proposal.

States Leading the Way on EITC Expansion: Addressing Gaps in Federal EITC

Since 1986, New Jersey and 28 other states as well as the District of Columbia, Puerto Rico, and some municipalities have created an EITC to supplement the federal credit. State EITCs largely mirror federal criteria and are calculated as a percentage of the federal credit. For example, in a state where the EITC is calculated at 40 percent of the federal credit, an EITC beneficiary who is eligible for a $100 federal credit would also be eligible for a $40 state EITC, for a combined total of $140. Additionally, all but 6 state EITCs are refundable, meaning that a tax filer can receive a refund for the amount by which the credit exceeds their federal income tax liability. The percentage of the federal EITC varies considerably among states.[24] Further, several state EITCs deviate from other aspects of the federal EITC, including maximum credit amounts and eligibility criteria.

Many jurisdictions have recently taken steps to address the limitations of the EITC by making targeted changes to eligibility rules. In 2014, the District of Columbia, for example, was the first jurisdiction to extend the EITC to workers without qualifying children. Further, Washington D.C. increased the match for workers without children from 40 percent to 100 percent. In addition, D.C. increased the income limit of its EITC beyond the federal cap.[25] As a result, the D.C. EITC provided a boost for 26.8 percent more workers, most of which has been attributed to 12,940 new applicants without children—9,507 of which were ineligible for the federal EITC.[26]

In 2017, Minnesota expanded eligibility for its state EITC by reducing the minimum age for childless workers without qualifying children from 25 to 21. Other states have also extended the credit to specific groups that would not otherwise benefit from this program, including New York, which provides the EITC to non-custodial parents, and Massachusetts, where survivors of domestic violence who are separated from a spouse are eligible to receive the credit.[27]

Most recently, Maryland and California expanded eligibility beyond the federal EITC’s rules, as well. In 2018, Maryland eliminated the minimum age requirement for its state EITC, which was previously set at 25.[28] This eligibility change is expected to extend the credit to an estimated 40,000 more workers.[29] Also in 2018, California expanded the program to childless workers between the ages of 18 and 24 and over the age of 64. The legislation that led to these changes also included measures to expand the state’s EITC to immigrant workers with ITINs; however, this proposal was rejected during budget negotiations.[30] In addition, in 2017, California increased its income cap, allowing people working full-time at the minimum wage to be eligible for the credit.

New Jersey’s EITC Has Improved, But Prior Expansions Continue to Leave Young and Childless Workers Behind

In 2000, New Jersey enacted a state EITC. In order to be eligible for the state EITC, applicants must meet the eligibility requirements of the federal EITC and file both a federal tax form and state income tax return. The amount of the state EITC that a taxpayer can claim, which is currently calculated as a percentage of the federal EITC, has undergone several changes during the last two decades. After remaining at 20 percent for several years, the state EITC percentage of the federal EITC increased to 22.5 percent in tax year 2008, and to 25 percent in 2009.

In 2011, the New Jersey EITC was reduced from 25 percent to 20 percent of the federal credit. Despite attempts to increase the EITC, the credit was not restored until Fiscal Year (FY) 2015,[31] when it was increased to 30 percent of the federal amount. In 2016, alongside a gas tax increase for New Jersey’s Transportation Trust Fund, the state EITC was increased to 35 percent of the federal credit. Most recently, legislation was enacted in 2018 that increased the state’s EITC from 35 percent to 40 percent over the course of three years (37 percent in tax year 2018, 39 percent in tax year 2019, and 40 percent in tax year 2020 and thereafter) and that added a new Child and Dependent Care Credit.[32]

Current Impact

Each year, New Jersey’s EITC infuses hundreds of thousands of dollars into local economies by putting cash in the hands of workers struggling to meet basic needs. This helps lift thousands of families out of poverty and eases the challenges faced by families still in poverty.  Under the state EITC’s current structure, the program has helped over 510,000 workers and their families and added $415.7 million to the state’s economy in 2018 alone. Passaic, Hudson, and Essex counties had the highest number and amount of approved EITC claims in 2018.

Many New Jersey Workers Are Left Still Behind

As noted above, the EITC has been one of the most successful anti-poverty programs in the U.S., helping lift millions of people and their families out of poverty while injecting billions of dollars into local economies.[33] Due to the fact that people of color often face barriers to reliable employment with sufficient wages, they also make up a significant share of residents who qualify for the EITC. As such, the EITC is a critical tool to combating income inequality and racial inequities, which benefits all New Jerseyans. Considering the positive impacts, it is important to expand the benefits of this credit to all of New Jersey’s low-wage workers – especially childless workers.

While the EITC has benefited Garden State residents, and the incremental increases in the amount of the credit have strengthened its impact, several groups continue to be excluded from this program. Due to the current eligibility requirements, low- and moderate-income childless workers are left behind. Like the federal EITC, workers under 25, who do not claim a child as a dependent, only benefit if they have exceedingly low-income, and those that do claim a child receive a disproportionately smaller benefit. Further, workers under 25 and over 64, who do not claim children as dependents, are ineligible for any EITC credit. By removing arbitrary age restrictions for childless workers, New Jersey could expand access to the EITC to provide a more stable foundation for young people entering the workforce.

New Jersey Can Expand and Strengthen Its EITC to Provide an Important Boost for Workers and Economies

There are several mechanisms for increasing the impact of New Jersey’s EITC. The following recommendations can be used in combination with one another to improve the impact and scope of the state EITC. Unless otherwise noted, the estimates included in this section were produced by ITEP using their Microsimulation Tax Model, which is based on tax year 2015 tax returns and other data.[34]

Recommendation #1: Lower the minimum age for the childless New Jersey EITC from 25 to 18

Under the current state rules that provide workers with 40 percent of the federal EITC amount, reducing the minimum age threshold for workers, who are not raising children at home, from 25 to 18 would benefit approximately 137,199 additional young New Jersey workers and add an estimated $17 million to state and local economies. For this newly eligible population, the average credit, which could be used for basic necessities, like clothing or transportation for work, would be $121.

While expanding eligibility for the state EITC would provide an important boost for young workers beginning their careers, the amount of the credit would remain modest under current EITC rules. By both lowering the minimum age and increasing the state EITC amount for young childless workers from 40 percent to 100 percent of the amount they would receive if they were eligible for the federal credit (see Recommendation #2), the credit could have a more meaningful impact on young people. At 100 percent of the federal rate, funds added to state and local economies would increase to an estimated $42 million, and the average credit for young childless workers would be $304.

Similar amounts of young men and women would benefit from this eligibility expansion, with men (51.6 percent), representing a slightly larger proportion of the new beneficiaries than women (48.5 percent). Additionally, compared to the New Jersey population, newly eligible Non-Hispanic White, Non-Hispanic Black and African American, and multiracial workers would make up a slightly larger amount of the newly eligible population, while Asians and Hispanics would make up a smaller amount of the potential beneficiaries.

Lowering the minimum age for the childless EITC would infuse money into under-resourced areas with high poverty rates and high populations of young people. Over one-third of the newly eligible population of beneficiaries reside in four counties – Camden (9.7 percent of the potential beneficiaries), Essex (9.5 percent), Middlesex (9.0 percent), and Ocean (8.4 percent). Relative to each county’s total population, Warren (1.66 percent), Gloucester (1.63 percent), and Mercer (1.59 percent) counties had the highest percentage of potential beneficiaries.

Recommendation #2: Increase the New Jersey EITC for childless workers from 40% of 100%

Even those childless workers struggling to meet basic needs who are currently eligible for the EITC under existing rules are only entitled to a small credit. Increasing the percentage of the federal credit for childless workers who are currently eligible for the state EITC from 40 percent to 100 percent (under existing rules) would benefit an estimated 142,310 workers between the ages of 25 and 64 and add $24 million to state and local economies. At 100 percent of the federal credit, childless workers, who are currently eligible for the EITC, would see an average increase of $166 in their EITC.

Recommendation #3: Increase the income threshold for workers without qualifying children from $15,570 to $25,000

Under current EITC eligibility rules, workers without qualifying children lose the benefit after earning more than $15,570. Raising the income threshold to $25,000 for childless workers would allow more hardworking New Jersey residents with low-wages to benefit from this program. Extending the maximum income cap to $25,000 by increasing the phase-out starting point, for example, while expanding eligibility rules to include young workers ages 18 to 24 (as in Recommendation #1) and increasing EITC amount to 100 percent for all childless workers of the federal credit (as in Recommendation #2) would benefit an estimated 408,207 childless workers and add $156 million to New Jersey’s economies.)

New Jersey Residents Need a Stronger EITC

Expanding the EITC can help increase the program’s parity and support many workers struggling to meet basic needs; however, the credit excludes many New Jerseyans. The EITC’s attachment to earned income, for example, leaves out taxpayers who are unable to participate in the formal economy, including some people with disabilities and those who serve as unpaid caregivers. A more robust set of mechanisms to promote equity that extends beyond the paradigm of paid labor is needed. Moreover, the EITC’s restrictions on immigration status excludes noncitizens and mixed-status families from benefiting from the credit.

While targeted expansions of the EITC to reach these groups would certainly provide an important boost for other low-income workers and families, New Jersey will need more than a stronger EITC to address the systemic causes of poverty. The Garden State can and should do more to ensure that all residents are equipped with the resources needed to live with financial security and dignity.


Appendix

Appendix A: Demographic Breakdown – Methodology

The demographic estimates included in this report were produced by using the 2017 American Community Survey (ACS) to evaluate the impact of lowering the minimum EITC eligibility age for workers without qualifying children from 25 to 18. In order to estimate the size and sociodemographic characteristics of the population that would benefit from this targeted expansion, ACS microdata were used as a proxy for eligibility criteria for the New Jersey EITC.

The methodology for the demographic estimates updated and built upon the target group analysis approach employed in the Closing the Gap: Expanding the Earned Income Tax Credit to Younger, Childless Workers in New Jersey,[35] which employed ACS 2016 data. In addition, distinct choices around variables used to estimate dependency status to more closely reflect EITC eligibility parameters. While household type was used to exclude all family households in Closing the Gap, for example, the present report used more narrow exclusion parameters to isolate only individuals who are likely to be claimed as a dependent by another taxpayer. Further details on the variable selection process are provided below.

Data Source

The American Community Survey is an ongoing, monthly survey that is used to produce population and housing estimates each year. This analysis employed ACS 2017 microdata, which were extracted and downloaded from Integrated Public Use Microdata Series (IPUMS USA) online data extraction tool.[36] The IPUMS sample included both household- and person- level records. IPUMS USA samples are unweighted, and the sample size for the ACS 2017 dataset for New Jersey residents is 88,114. In order to obtain representative statistics, person-level sample weights (variable “perwt”) were applied. The ACS response rate for housing units in New Jersey in 2017 was 88.4%.[37]

While the ACS provides rich information about New Jersey’s population, there are also several limitations to this dataset. As the ACS is a survey that consists of self-reported data rather than tax filing information, it is subject to error. In addition, because this study employed the ACS 2017 dataset, the results suggest the impact of extending the credit if it had been in effect in 2017 and therefore do not account for economic and demographic changes that have since taken place. Finally, while the ACS contains information on several personal and household characteristics, not all EITC eligibility criteria have corresponding variables in this dataset. A detailed explanation of the selection and limitations of each variable used in this analysis is provided in the following section.

Eligibility Parameters and Target Group Creation

In order to be eligible to receive the EITC, tax filers without qualifying children must meet several criteria related to residency, age, income, marital status, immigration status, and family relations. Variables related to each of these criteria were combined to create a target group representing an estimate of the population that would become eligible if the New Jersey EITC were expanded to include workers without qualifying children between the ages of 18 and 24. An overview of the measures of these characteristics employed in this study and any recoding of these variables is provided below.

Residence. The ACS2017 household variable “statefip” was used to limit the IPUMS data extraction to households in New Jersey (FIPS code 24).

Age. The ACS 2017 dataset included a continuous variable for age ranging from 1 to 95. As workers without qualifying children between the ages of 25 to 64 are currently eligible, and this study sought to estimate the impact on two potential expansion groups (childless workers 18 to 20 and 18 to 24), age was recoded into categorical variable (age5cat).

Original Variable  New Variable N (Weighted) % (Weighted)
age Age5cat    
0 to 17 1 Under 18” 1,976,538 21.95
18 to 20 2 “18 – 20” 337,134 3.74
21 to 24 3 “21 – 24” 449,174   4.99
24 to 64 4 “25 – 64” 4,827,300 53.60 
65 to 95 5 “65 and Older” 1,415,498 15.72

Immigration Status. While the EITC eligibility criteria allow filers who are either U.S. Citizens or resident aliens all year, the ACS 2017 only captures citizenship status and does indicate whether or not a respondent is a resident alien. For this analysis, all non-citizens are treated as ineligible, likely resulting in an underestimate of eligible immigrants.

Original Variable New Variable N (Weighted) % (Weighted)
Citizen cit2cat    
0 “N/A (Born in the US)” 1 “Citizen” 6,879,510  76.39 
1 “Born abroad of American parents” 1 “Citizen” 77,181 0.86
2 “Naturalized Citizen” 1 “Citizen” 1,135,086 12.60
3 “Not a citizen” 0 “Not a citizen” 913,867 10.15

Marital Status. The ACS 2017 person-level data includes the marital status of respondents; however, it does not include tax filing status information. For this target group analysis, respondents that are never married/single, widowed, or divorced are assumed to be single for tax filing purposes. Respondents that are married with a spouse present are assumed to be married and filing jointly. Respondents that are either separated or are married with a spouse absent are treated as married and filing separately, and therefore ineligible for the EITC.

Original Variable  New Variable N (Weighted) % (Weighted)
Marst Marst3cat    
1 “Married, spouse present” 1 “Married, likely filing jointly” 3,463,260 38.46 
2 “Married, spouse absent” 3 “Separated” 2 “Married, likely filing separately” 309,945 3.44 
4 “Divorced” 5 “Widowed” 6 “Never married/single” 0 “Not married” 5,232,439     58.10

Investment Income. The EITC eligibility criteria require that the investment income of filers be less than $3500. The ACS 2017 person variable incinvst (range: -2100 to 24700), which measures income from an estate or trust, interest, dividends, royalties, and rents received, was recoded to reflect this cap. Households with $3500 or less in investment income was marked as eligible, while households with $3501 or more in investment income were marked as ineligible. Respondents under 15 are coded as missing.

Original Variable   New Variable N (Weighted) % (Weighted)
incinvst Incinvst_3500    
-2100 (min) to 3500 1 “Eligible – $3500 or less” 448,296 4.98
$3501 to 247000 (max) 0 “Ineligible -$3501 or more” 6,929,598 76.95
999999 .i “N/A – under 15” 1,627,750 18.07

Earned Income. As EITC filers are required to have earned income, respondents without earned income were excluded from this analysis using the 7-digit numeric variable “incearn”, which records respondents’ self-reported income earned from wages or a person’s own business or farm for the previous year.

Original Variable  New Variable N (Weighted) % (Weighted)
incearn incearn2cat    
-6300 (min) to 1 (max) 0 “Ineligible – no personal earned income” 4,103,220 45.56
1 to 1025000 (max) 1 “Eligible – has personal earned income” 4,902,424 54.44  

Personal Income. For unmarried individuals, the variable inctot, which captures respondents’ pre-tax personal income or losses from all sources for the previous year was used to create a dichotomous variable for income eligibility. As the maximum adjusted gross income for single tax filers is $15,270, individuals earning more than this amount were considered ineligible in the target group analysis.

Original Variable  New Variable N (Weighted) % (Weighted)
inctot inc0child    
-6300 (min) to $15,270 1 “Eligible – $15,270 or less” 2,609,153  28.97
15271/1272000 (max) 0 – “Ineligible – $1571 or more” 4,768,741 52.95
999999 .i. “N/A – under 15 years” 1,627,750   18.07 
       

Total Family Income. For married individuals assumed to be filing jointly, the variable ftotinc, which captures the total pre-tax money income earned by one’s family (as defined by family unit) from all sources for the previous year, was used to create a dichotomous variable for income eligibility. As the maximum adjusted gross income for single tax filers is $15,270, individuals earning more than this amount were treated as ineligible in the target group analysis.

Original Variable  New Variable N (Weighted) % (Weighted)
ftotinc faminc0child    
-6300 (min) to 20950 1 “Eligible – $20,950 or less” 1,003,393 11.14
20951 to 1684500 (max) 0 – “Ineligible – $20,951 or more” 7,811,460  86.74
999999 .i. “N/A” 190,791   2.12

Qualifying Child Status. In order to be eligible for the New Jersey EITC, tax filers must not be claimed as a dependent or qualifying child of another person. Tax filers may be claimed as another person’s qualifying child until the age of 19 if they are not a student, and until the age of 24 if they are a student. Accordingly, three variables were combined to create a composite measure of whether or not a respondent was likely to be a qualifying child or dependent of another person. Respondents were coded as possible qualifying children of other tax filers if they indicated that were either 1) under 19; and the child, sibling, or grandchild of the head of household, or under 2) under 25; a student, and the child, sibling, or grandchild of the head of household. Respondents that were identified and possible qualifying children were treated as ineligible for the EITC in this analysis.

Original Variable  New Variable N (Weighted) % (Weighted)
Relate Qualchild    
3 “Child” 7 “Sibling“ 9 “Grandchild”    AND age <=19, OR age <=25 AND in school 1 “Ineligible – Could be a Qualifying Child/Sibling/Grandchild”   2,286,485       25.39
1 “Head/Householder”; 2 “Spouse”; 4 “Child-in-law”;  5 “Parent”; 6 “Parent-in-Law”; 8 “Sibling-in-Law”; 10 “Other relatives”; 11
“Partner, friend, visitor”; 12 “Other non-relatives”   OR if age >= 20 AND not in school  
0 “Eligible – Likely Not a Qualifying Child” 6,624,630       73.56 
13 “Institutional inmates”   2 “Ineligible – Institutional Inmates” 94,529         1.05

Number of Qualifying Children. The ACS 2017 household variable “number of related children in household under 18” The number of related children in the household was used as a proxy for qualifying children. Any respondents living with related children under 18 were excluded from the target group analysis. As the ACS does not capture which household member claims qualifying children, it is likely that the number of people without qualifying children is underestimated.

Original Variable  New Variable N (Weighted) % (Weighted)
us2017a_nrc numrelchild    
0 0 4,389,570          48.74
1 1 “1 Child” 1,607,720      17.85
2 2 “2 children” 1,721,873       19.12
3 to 18 3 “3 or more children”   1,103,408       12.25
BB .i “N/A (Group Quarters or Vacant)” 183,073        2.03 

Sociodemographic Measures and Descriptive Statistics

After establishing the parameters for the target group, the following variables were employed to examine the characteristics of the newly eligible population.

Original Variable  New Variable N (Weighted) % (Weighted)
Sex N/A    
1. Male 4,398,062   48.84 
2. Female 4,607,582 51.16
County
0. Not Identifiable 579,997 6.44
3. Bergen 948,558 10.53
5. Burlington 448,537 4.98
7. Camden 511,228 5.68
13. Essex 808,506 8.98
15. Gloucester 292,408 3.25
17. Hudson 691,893 7.68
19. Hunterdon 124,745 1.39
21. Mercer 374,077 4.15
23. Middlesex 841,893 9.35
27. Morris 499,306 5.54
29. Ocean 597,268 6.63
31. Passaic 511,844 5.68
35. Somerset 335,557 3.73
37. Sussex 141,896 1.58
39. Union 564,008 6.26
41. Warren 107,349 1.19
Race/Ethnicity (composite of two variables, race and Hispanic origin (hispan)
Race = 1 “White”; hispan = 0 “Not Hispanic” 1. Non-Hispanic White 4,939,554 54.85
Race = 2 “Black/African American/Negro” hispan = 0 “Not Hispanic” 2. Non-Hispanic Black or African American 1,146,813 12.73
Race = 4 “Chinese”, 5 “Japanese”, or 6 “Other Asian OR Pacific Islander” hispan = 0 “Not Hispanic” 3. Non-Hispanic Asian 879,384 9.76
Race = 3 “American Indian or Alaska Native” hispan = 0 “Not Hispanic” 4. Non-Hispanic American Indian or Alaska Native 9,339 0.10
Hispan = 1 “Mexican”, 2 “Puerto Rican”, 3 “Cuban”, or 4 “Other” 5. Hispanic/Latino, any race 1,840,591 20.44
Race = 7 “Other Race” hispan = 0 “Not Hispanic” 6. NH Other Race 37,124 0.41
Race = 8 “Two or more races” or 9 “Three or more major races” hispan = 0 “Not Hispanic” 7. NH Two or More Races 152,839 1.70


Appendix B: Demographic Breakdown – Tables

Due to data availability limitations, the demographic estimates were generated using ACS 2017 data and the total impact and cost estimates were produced using ITEP’s Microsimulation tax model. Because the two analyses are based on different data sets with unique sampling frames and assumptions related to eligibility criteria, the total number of potential beneficiaries in demographic breakdown differs from the estimates generated by ITEP’s Microsimulation Tax Model. Further information on the methodology used to produce demographic estimates is available in Appendix A. Further information on ITEP’s methodology is available here: https://itep.org/itep-tax-model-simple/.

Potential Beneficiaries of Lowering Age Limit for Childless EITC to 18 in New Jersey

County Total Pop (Weighted) Total Pop % (Weighted) Total Number of Potential Beneficiaries (18 to 24, Childless) (Weighted) Potential beneficiaries in county among total beneficiaries Potential beneficiaries in county among total county population
Not Identifiable 579,997 6.44 5,011 6.1% 0.86%
Bergen 948,558 10.53 4,578 5.6% 0.48%
Burlington 448,537 4.98 3,673 4.5% 0.82%
Camden 511,228 5.68 8,013 9.7% 1.57%
Essex 808,506 8.98 7,839 9.5% 0.97%
Gloucester 292,408 3.25 4,757 5.8% 1.63%
Hudson 691,893 7.68 5,550 6.7% 0.80%
Hunterdon 124,745 1.39 588 0.7% 0.47%
Mercer 374,077 4.15 5,930 7.2% 1.59%
Middlesex 841,893 9.35 7,384 9.0% 0.88%
Monmouth 626,574 6.96 5,041 6.1% 0.80%
Morris 499,306 5.54 3,002 3.7% 0.60%
Ocean 597,268 6.63 6,916 8.4% 1.16%
Passaic 511,844 5.68 4,004 4.9% 0.78%
Somerset 335,557 3.73 2,234 2.7% 0.67%
Sussex 141,896 1.58 849 1.0% 0.60%
Union 564,008 6.26 5,080 6.2% 0.90%
Warren 107,349 1.19 1,785 2.2% 1.66%

Source: NJPP Analysis of ACS 2017 Data

Note: Atlantic, Cape May, Cumberland and Salem counties are not included because they are not identified in the IPUMS USA sample. Because these counties are not identified in public use microdata, they are grouped together in the “Not Identifiable” category at the top of the table.

Potential Beneficiaries of Lowering Childless New Jersey EITC Age Limit to 18 by Race/Ethnicity

Race/Ethnicity Number of Potential Beneficiaries Percentage of Potential Beneficiaries
NH White 49,566 60%
NH Black or African American 13,791 17%
NH Asian 3,535 4%
NH American Indian/Alaska Native 0 0%
Hispanic/Latino, any race 12,661 15%
NH Other Race or Multiple Races 2,681 3%

Source: NJPP Analysis of ACS 2017 Data

Appendix C: New Jersey EITC Claims by County, Number and Amount

EITC Claims Approved In New Jersey Counties in Tax Year 2018

County Number of Claims Amount of Claims
ATLANTIC COUNTY 26,718 $23,296,892
BERGEN COUNTY 37,145 $26,033,256
BURLINGTON COUNTY 19,401 $14,334,688
CAMDEN   COUNTY 36,763 $31,462,183
CAPE MAY COUNTY 5,882 $4,468,061
CUMBERLAND COUNTY 12,814 $11,437,603
ESSEX COUNTY 65,257 $56,755,829
GLOUCESTER COUNTY 13,658 $10,408,981
HUDSON COUNTY 54,324 $46,272,607
HUNTERDON COUNTY 3,084 $1,868,004
MERCER COUNTY 21,757 $18,050,397
MIDDLESEX COUNTY 43,418 $34,576,149
MONMOUTH COUNTY 23,029 $16,303,291
MORRIS COUNTY 13,465 $8,704,800
OCEAN COUNTY 27,998 $23,611,984
PASSAIC COUNTY 46,138 $41,697,797
SALEM COUNTY 4,072 $3,417,477
SOMERSET COUNTY 10,079 $7,099,285
SUSSEX COUNTY 5,107 $3,207,105
UNION COUNTY 35,693 $29,050,432
WARREN COUNTY 4,853 $3,615,139

Source: NJPP Analysis of New Jersey Treasury Data

End Notes


[1] Tax Policy Center (2019). Key Elements of the U.S. Tax System. https://www.taxpolicycenter.org/briefing-book/what-earned-income-tax-credit

[2] Center of Budget and Policy Priorities (2019).). How the Federal Tax Code Can Better Advance Racial Equity. https://www.cbpp.org/research/federal-tax/how-the-federal-tax-code-can-better-advance-racial-equity

[3] NJPP analysis of data from the New Jersey Division of Taxation (2019).

[4] Center on Budget and Policy Priorities (2019). Policy Basics: The Earned Income Tax Credit. https://www.cbpp.org/research/federal-tax/policy-basics-the-earned-income-tax-credit

[5] Crandall-Hollick, Margot L. (2018). The Earned Income Tax Credit (EITC): A Brief Legislative History. Congressional Research Service. https://fas.org/sgp/crs/misc/R44825.pdf

[6] National Conference of State Legislatures (2019). Tax Credits for Working Families: Earned Income Tax Credit (EITC). Retrieved from http://www.ncsl.org/research/labor-and-employment/earned-income-tax-credits-for-working-families.aspx; Statistics for Tax Returns with EITC (2019) Retrieved from https://www.eitc.irs.gov/eitc-central/statistics-for-tax-returns-with-eitc/statistics-for-tax-returns-with-eitc

[7] IRS (2019). Statistics for Tax Returns with EITC. https://www.eitc.irs.gov/eitc-central/statistics-for-tax-returns-with-eitc/statistics-for-tax-returns-with-eitc

[8] Ibid 1.

[9] A complete list of the current federal EITC requirements can be found here: IRS (2019). Publication 596, Earned Income Credit. Retrieved from https://www.irs.gov/forms-pubs/about-publication-596

[10] IRS (2018). EITC Income Limits, Maximum Credit Amounts and Tax Law Updates. https://www.irs.gov/credits-deductions/individuals/earned-income-tax-credit/eitc-income-limits-maximum-credit-amounts

[11] Marr, Chuck, C. Huan, C.Murray, and A. Sherman (2016). Strengthening the EITC for Childless Workers Would Promote Work and Reduce Poverty Improvement Targeted at Lone Group Taxed into Poverty. https://www.cbpp.org/sites/default/files/atoms/files/4-11-16tax.pdf

[12] IRS (2019). 2019 EITC Income Limits, Maximum Credit Amounts and Tax Law Updates https://www.irs.gov/credits-deductions/individuals/earned-income-tax-credit/eitc-income-limits-maximum-credit-amounts-next-year.

[13] IRS (2019). Publication 596, Earned Income Credit. Retrieved from https://www.irs.gov/forms-pubs/about-publication-596

[14] Meyer, Bruce (2010). The Effects of the Earned Income Tax Credit and Recent Reforms. Tax Policy and the Economy 2010 24:1, 153-180. https://www-journals-uchicago-edu.proxy.libraries.rutgers.edu/doi/full/10.1086/649831

[15] Brand, J., Friscia, E., Lleras, A., Patel, A., Robinson, Y., Williams, R. (2018). Millennials In New Jersey: Migratory Patterns and Public Opinion. https://www.njpp.org/wp-content/uploads/2018/09/Embargoed-NJPP-Practicum-Millennial-MIgration.pdf

[16] ITEP (2019). Understanding Five Major Federal Tax Credit Proposals. Retrieved from https://itep.org/wp-content/uploads/052219-Understanding-Five-Major-Federal-Tax-Credit-Proposals_ITEP.pdf

[17] Marr, Chuck et al. (2019). Working Families Tax Relief Act Would Raise Incomes of 46 Million Households, Reduce Child Poverty. https://www.cbpp.org/sites/default/files/atoms/files/4-10-19tax.pdf

[18] Ibid.

[19] S.4 – LIFT (Livable Incomes for Families Today) the Middle Class Act. https://www.congress.gov/bill/116th-congress/senate-bill/4/text?q=%7B%22search%22%3A%5B%22lift+the+middle+class+act%22%5D%7D&r=1&s=3

[20] H.R.1431 – Cost-of-Living Refund Act of 2019 https://www.congress.gov/bill/116th-congress/house-bill/1431/text; S.527 – Cost-of-Living Refund Act of 2019 https://www.congress.gov/bill/116th-congress/senate-bill/527

[21] ITEP (2019). Cost-of-Living Refund Act. https://itep.org/cost-of-living-refund-act/; Tax Policy Institute (2019). Analyst of the Cost-of-Living Refund Act of 2019.  https://taxfoundation.org/cost-of-living-refund-act-2019-analysis/

[22] ITEP (2019). Working Families Tax Relief Act. https://itep.org/working-families-tax-relief-act/

[23] Ibid.

[24] Urban Institute (2019). State Earned Income Tax Credits. https://www.urban.org/policy-centers/cross-center-initiatives/state-and-local-finance-initiative/state-and-local-backgrounders/state-earned-income-tax-credits

[25] Muhammad, Daniel (2019). The 2015 Expansion of the District of Columbia Earned Income Tax Credit for Childless Workers. https://cfo.dc.gov/sites/default/files/dc/sites/ocfo/publication/attachments/DC%20Childless%20EITC%20020619.pdf

[26] Ibid 12.

[27] Center on Budget and Policy Priorities (2019). States Can Adopt or Expand Earned Income Tax Credits to Build a Stronger Future Economy. https://www.cbpp.org/research/state-budget-and-tax/states-can-adopt-or-expand-earned-income-tax-credits-to-build-a#_ftn6

[28] Maryland Center on Economic Policy (2018). 2018 Legislation Largely Improved Maryland’s Tax Code.  https://www.mdeconomy.org/2018-legislation-largely-improved-marylands-tax-code/

[29] Tax Credits for Workers and Their Families (2018). Maryland Expands EITC to Younger Workers. http://www.taxcreditsforworkersandfamilies.org/news/maryland-expands-eitc-to-younger-workers/

[30] Center for Budget and Policy Priorities (2019). States Can Adopt or Expand Earned Income Tax Credits to Build a Stronger Future Economy. https://www.cbpp.org/research/state-budget-and-tax/states-can-adopt-or-expand-earned-income-tax-credits-to-build-a

[31] New Jersey Department of the Treasury. Tax Expenditure Reports (Fiscal Years 2012-2015). https://www.state.nj.us/treasury/taxation/taxexpenditurereport.shtml

[32] NJ Division of Taxation. New Gross Income Tax Legislation Makes Changes for Tax Year 2018 (P.L. 2018, c.45)”.  https://www.state.nj.us/treasury/taxation/grossincometax.shtml

[33] Center of Budget and Policy Priorities (2019).). How the Federal Tax Code Can Better Advance Racial Equity. https://www.cbpp.org/research/federal-tax/how-the-federal-tax-code-can-better-advance-racial-equity

[34] ITEP Microsimulation Tax Model Overview (2019). https://itep.org/itep-tax-model-simple/

[35] Arteta, G., Daly, R., Howes, A., Idowu, F., Rosenbaum, W., Sekuler, C. (2019). Closing the Gap: Expanding the Earned Income Tax Credit. https://bloustein.rutgers.edu/wp-content/uploads/2019/10/2019-Closing-the-Gap.pdf

[36] Steven Ruggles, Sarah Flood, Ronald Goeken, Josiah Grover, Erin Meyer, Jose Pacas, and Matthew Sobek. IPUMS USA: Version 9.0 [dataset]. Minneapolis, MN: IPUMS, 2019. https://doi.org/10.18128/D010.V9.0

[37] U.S. Census Bureau. American Community Survey Response Rates: New Jersey. https://www.census.gov/acs/www/methodology/sample-size-and-data-quality/response-rates/index.php