To read a PDF version of this policy brief, click here.
Since the onset of the COVID-19 pandemic, New Jersey workers and businesses alike have faced mounting and unprecedented challenges. Public health precautions meant to contain the spread of the outbreak, like necessary business closures and stay-at-home orders, have disrupted the state’s economy, especially the service sector that relies on server-customer interactions. Immigrant workers, who make up a disproportionate segment of the service sector workforce, will likely be hit hardest by the COVID-19 pandemic. These same workers are excluded from much of the relief provided by the federal government.
The industries most hurt by the necessary social distancing and public health directives include restaurants, bars, hotels, entertainment, non-food retail, passenger transportation, and personal care services. Taken together, these industries accounted for nearly 800,000 jobs in 2018, representing almost a quarter of New Jersey’s private-sector employment at 22.9 percent. These industries also accounted for $25.9 billion in annual payroll, or 11.4% of total private sector income.
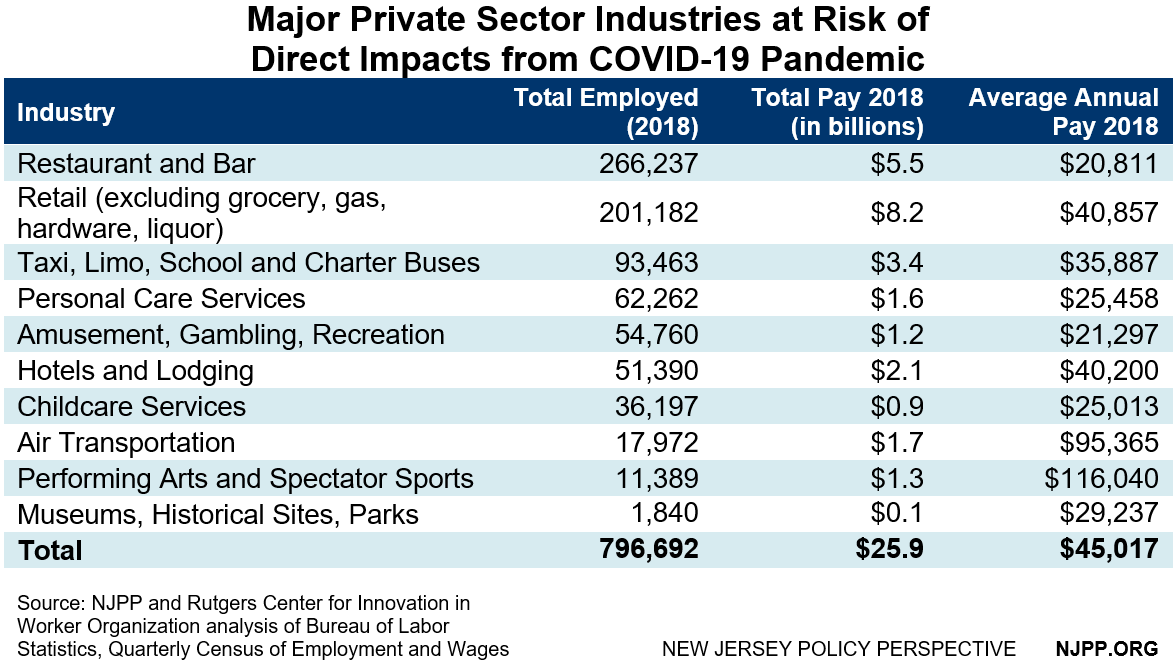
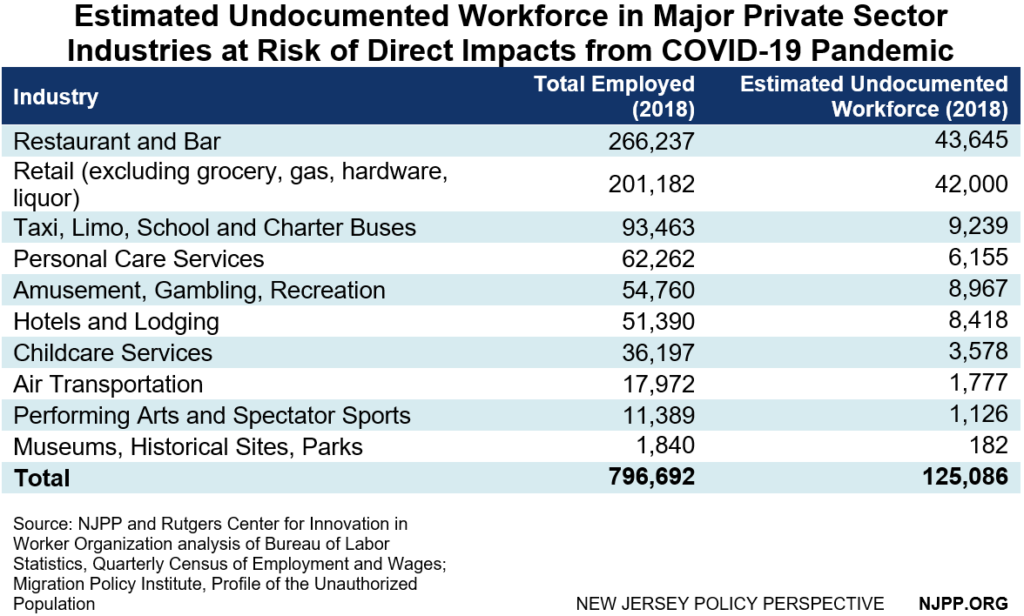
The majority of these jobs are low-paid, with annual earnings significantly lower than the state average. Due to decades of racial and ethnic discrimination, these industries are a key source of employment for low-income workers, immigrants, and communities of color. Undocumented immigrants, who make up approximately 6 percent of New Jersey’s population, account for a disproportionate 15.7 percent of the workforce in these service sector industries.[1] In total, there are approximately 125,000 undocumented workers employed in the service sector industries that are most likely to be harmed by the pandemic.
To contextualize the high percentage of immigrant workers in service sector industries, a 2017 report by Janice Fine, Director of Research and Strategy at the Center for Innovation in Worker Organization (CIWO) at Rutgers, finds:
“[The] de-unionization and erosion of labor markets preceded the arrival of immigrants. The shift to non-union subcontracting is what led native workers to leave those jobs. The industries then shifted to immigrant labor, but labor standards in the industries had dramatically diminished. This deterioration of labor markets and working conditions, however, cannot be understood as an inevitable product of market forces. Much of the change has been shaped by a combination of firm management practices, outdated employment laws, and the lack of effective labor standards enforcement.”
As the COVID-19 pandemic and resulting economic downturn rage on, it will be critical for New Jersey policymakers to implement policies that improve working conditions across all sectors, especially the industries that contain a larger share of the low-paid workforce. Past recessions have worsened inequality as governments responded with austerity policies that cut taxes for wealthy families and corporations and failed to support low- and middle-income families with vital relief. This approach has led to major negative impacts on the health and general well-being of low-income and middle-class families, especially for immigrants. If the state’s policy response doesn’t prioritize these families throughout its recovery, they are sure to fall even further behind.
End Notes
[1] NJPP analysis of total unauthorized population in New Jersey and total state population. Migration Policy Institute, Profile of the Unauthorized Population: New Jersey. https://www.migrationpolicy.org/data/unauthorized-immigrant-population/state/NJ; U.S. Census Bureau, Population Division, Table 1. Annual Estimates of the Resident Population for the United States, Regions, States, and Puerto Rico: April 1, 2010 to July 1, 2019. https://www.census.gov/data/tables/time-series/demo/popest/2010s-state-total.html#par_textimage_1574439295