Freedom from Want: An Economic Guarantee for New Jersey’s Kids

All children in New Jersey deserve the freedom to grow up safe, healthy, and free from poverty. Childhood poverty hurts school performance and growth today, while damaging mental and physical health and earning power for a lifetime. Research is clear: childhood poverty causes lasting harm. Yet 1 in 8 New Jersey children still live in poverty ($32,000 for a family of four).[1] This level of deprivation should not be tolerated in one of the wealthiest states in the wealthiest nation in the history of the world.

This report plots a bold way forward for New Jersey to lead the nation in ending child poverty and ensuring all families have what they need. The report outlines two paths forward:

  • Expanding and improving existing anti-poverty programs, and
  • Creating a new child allowance program for children in low-income families.


This vision is not new. For generations, leaders across the globe have argued that true freedom requires freedom from poverty. In his Four Freedoms speech from more than 80 years ago, President Franklin Roosevelt said that free nations should provide “freedom from want” for their people, to secure a “healthy peacetime life” for all.[2] The United Nations Declaration of Human Rights echoes this, promising an adequate standard of living for all people to have food, clothing, housing, medical care, and social services.[3] While the United States lags behind, almost all wealthy countries provide a child allowance as a basic income floor for households with children.[4]

The federal government has pulled back from helping low-income and working families.[5] Now states like New Jersey must step up and show how economic growth can coexist with economic security for those who need it most.

Key Findings

New Jersey has the resources to dramatically cut child poverty. It has one of the nation’s highest median household incomes at nearly $100,000 annually.[6] Its economic engine generates enormous wealth, with its gross domestic product rivaling global powers.[7] And New Jersey has a base of existing anti-poverty programs to build from, such as the state Child Tax Credit and state Earned Income Tax Credit.[8]

The latest lessons in anti-poverty programs come from “guaranteed income” pilot programs, which have provided unrestricted cash to families and individuals seeking economic stability. These programs stand out for their simplicity: by removing red tape and government paperwork, guaranteed income pilots trust individuals and families to make their own choices about how to spend assistance. The results of these pilots have been impressive: lower poverty, higher academic achievement, and greater food and housing security.[9]

Building on these lessons, this report offers two paths forward for New Jersey to move closer to a world without want for its children and families:

Path 1

Expand New Jersey’s existing family affordability programs to provide more cash to more families with less red tape. Currently, New Jersey operates four main anti-poverty programs with cash or cash-like assistance:

  • Earned Income Tax Credit
  • Child Tax Credit
  • Work First New Jersey
  • Supplemental Nutrition Assistance Program (SNAP)


This plan would double the benefit amounts for the tax credit programs and Work First New Jersey to bring them in line with the standard of living in New Jersey. An additional monthly payment would be added to SNAP using state funds.

Path 2

Create a new program, the New Jersey Family Guarantee, which would provide $5,000 annual payments to families of Medicaid-eligible children. Rather than work through existing programs, this more ambitious proposal would lay the groundwork for a more robust child allowance program in New Jersey, allowing all children eligible for Medicaid (or whose births were covered by Medicaid in New Jersey) to receive annual payments of $5,000 to help support their upbringing and well-being.

The two proposals would require significant investment by the state, but would be well within the scope of other state cash assistance programs. The expansion proposal would cost around $1.84 billion, while the New Jersey Family Guarantee program would cost around $3.21 billion at full funding. By comparison, the ANCHOR property tax relief program costs the state $2.43 billion annually, while the state’s wide array of property tax relief programs costs $4.88 billion.[10] As these annual payments demonstrate, the state’s political leaders have shown a willingness to invest substantial state resources into direct payments for households.

The Problem: Child Poverty’s Lasting Harm

Child poverty is not inevitable, but the result of public policy decisions that have spent too little on families. Growing research shows that child poverty leaves lifelong scars on child development and holds back children and adults from reaching their full potential. Meanwhile, other studies prove that providing cash assistance to reduce poverty also reduces these harms and improves lifelong success for these children and their families.

The Damage Child Poverty Causes

Poverty hurts how children grow and learn. No doubt focusing on learning in school is more challenging if a child goes to bed hungry or lacks clean clothes to wear. But beyond these basics, exposure to childhood poverty leads to worse mental and physical health in adulthood.[11] The stress of poverty has been shown to rewire children’s brains, raising levels of stress hormones and disrupting development.[12]

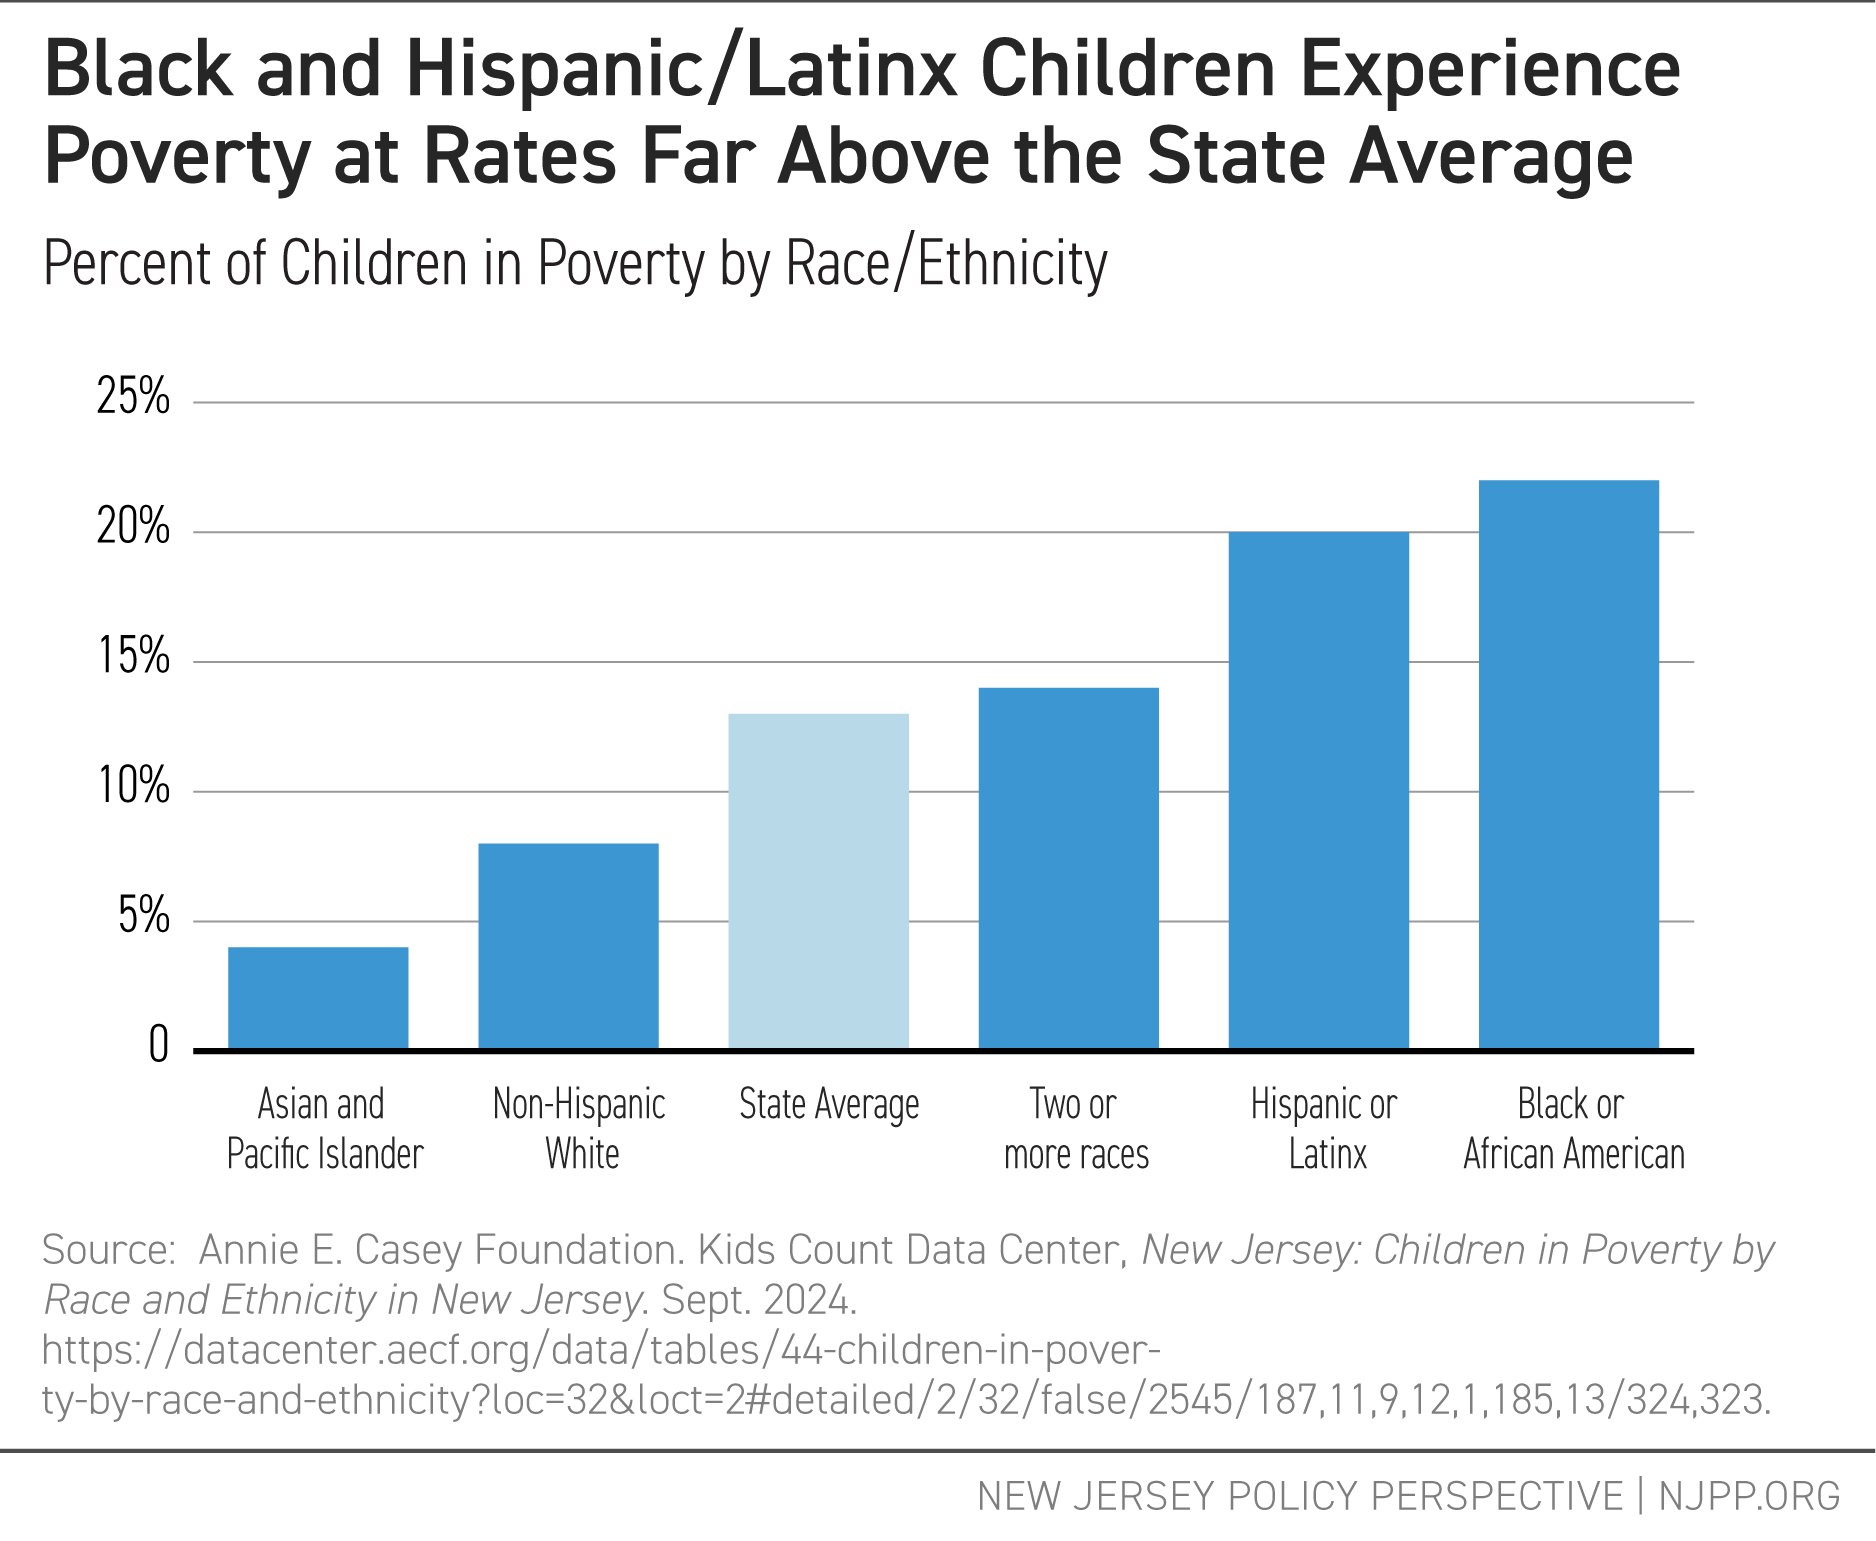
Poverty also widens and deepens gaps between Black and Hispanic/Latinx families who have been historically economically disadvantaged and their white counterparts. In New Jersey, the child poverty rate for Black and Hispanic/Latinx families is more than twice that of non-Hispanic white families.[13]

Black and Hispanic/Latinx Children Experience Poverty at Rates Far Above the State Average. Percent of Children in Poverty by Race/Ethnicity

The National Academies of Sciences said it clearly in their 2019 report: poverty itself hurts children, especially when it begins in early childhood and lasts through much of childhood.[14]

New Jersey’s high cost of living compounds these harms. The official poverty rate understates the deprivation that New Jersey’s families with lower incomes experience, because the cost of housing, food, child care, and other necessities is higher than in other states.[15] Raising two children with two adults can easily cost upwards of $135,000, even as incomes fail to keep pace with those costs.[16]

The Solution to Poverty: Money

Good news: research shows the most effective way to fix poverty is simple: give people money. Cash gives people the power to make their own financial decisions and meet their needs without burdensome restrictions.

Examples include:

  • The expanded Child Tax Credit as part of the American Rescue Plan provided payments of $300 per month to families across the country, reducing poverty by nearly half.[17]
  • The two rounds of pandemic stimulus checks sent in 2020 during the pandemic reduced child poverty by roughly one-third.[18]
  • Guaranteed income pilot programs in dozens of states and hundreds of communities, including in Newark and Paterson, have shown reductions in financial need and improvements in housing and health care.[19]
  • Long-term effects from prior cash transfer programs showed not only positive academic and educational outcomes and better health outcomes, but also improvements in the next generation’s educational outcomes.[20]


Given the broad results from the research around cash programs big and small, there has never been more evidence for the effectiveness of these programs in reducing poverty. Yet in the past, programs have placed restrictions on anti-poverty programs based on racist or controlling policies, such as bans on using SNAP for prepared foods[21] or allowing only “deserving” families to receive assistance.[22]

What does cash assistance actually do? A broader cash assistance program is not a substitute for other critical supports such as health insurance, affordable housing, or public schools. Instead, research shows that cash programs help families cover basic needs, such as rent, utilities, groceries, and unexpected expenses like car repairs or medical bills.[23] The research also addresses common concerns: guaranteed income pilots have shown nearly no increase in spending on alcohol, tobacco, or gambling,[24] and little to no effect on employment, meaning people are not leaving the workforce when receiving these funds.[25]

Where New Jersey Stands Now

New Jersey already operates a series of programs that provide cash or cash-like benefits to households with children: the Child Tax Credit, Earned Income Tax Credit, Work First New Jersey (TANF), and SNAP. These programs each have differing benefit amounts, eligibility, and regularity (lump-sum vs. periodic payments). Nonetheless, they each help reduce the burden of economic hardship on households below or near the federal poverty line, with some key limitations.

Current Cash and Cash-Like Assistance Programs

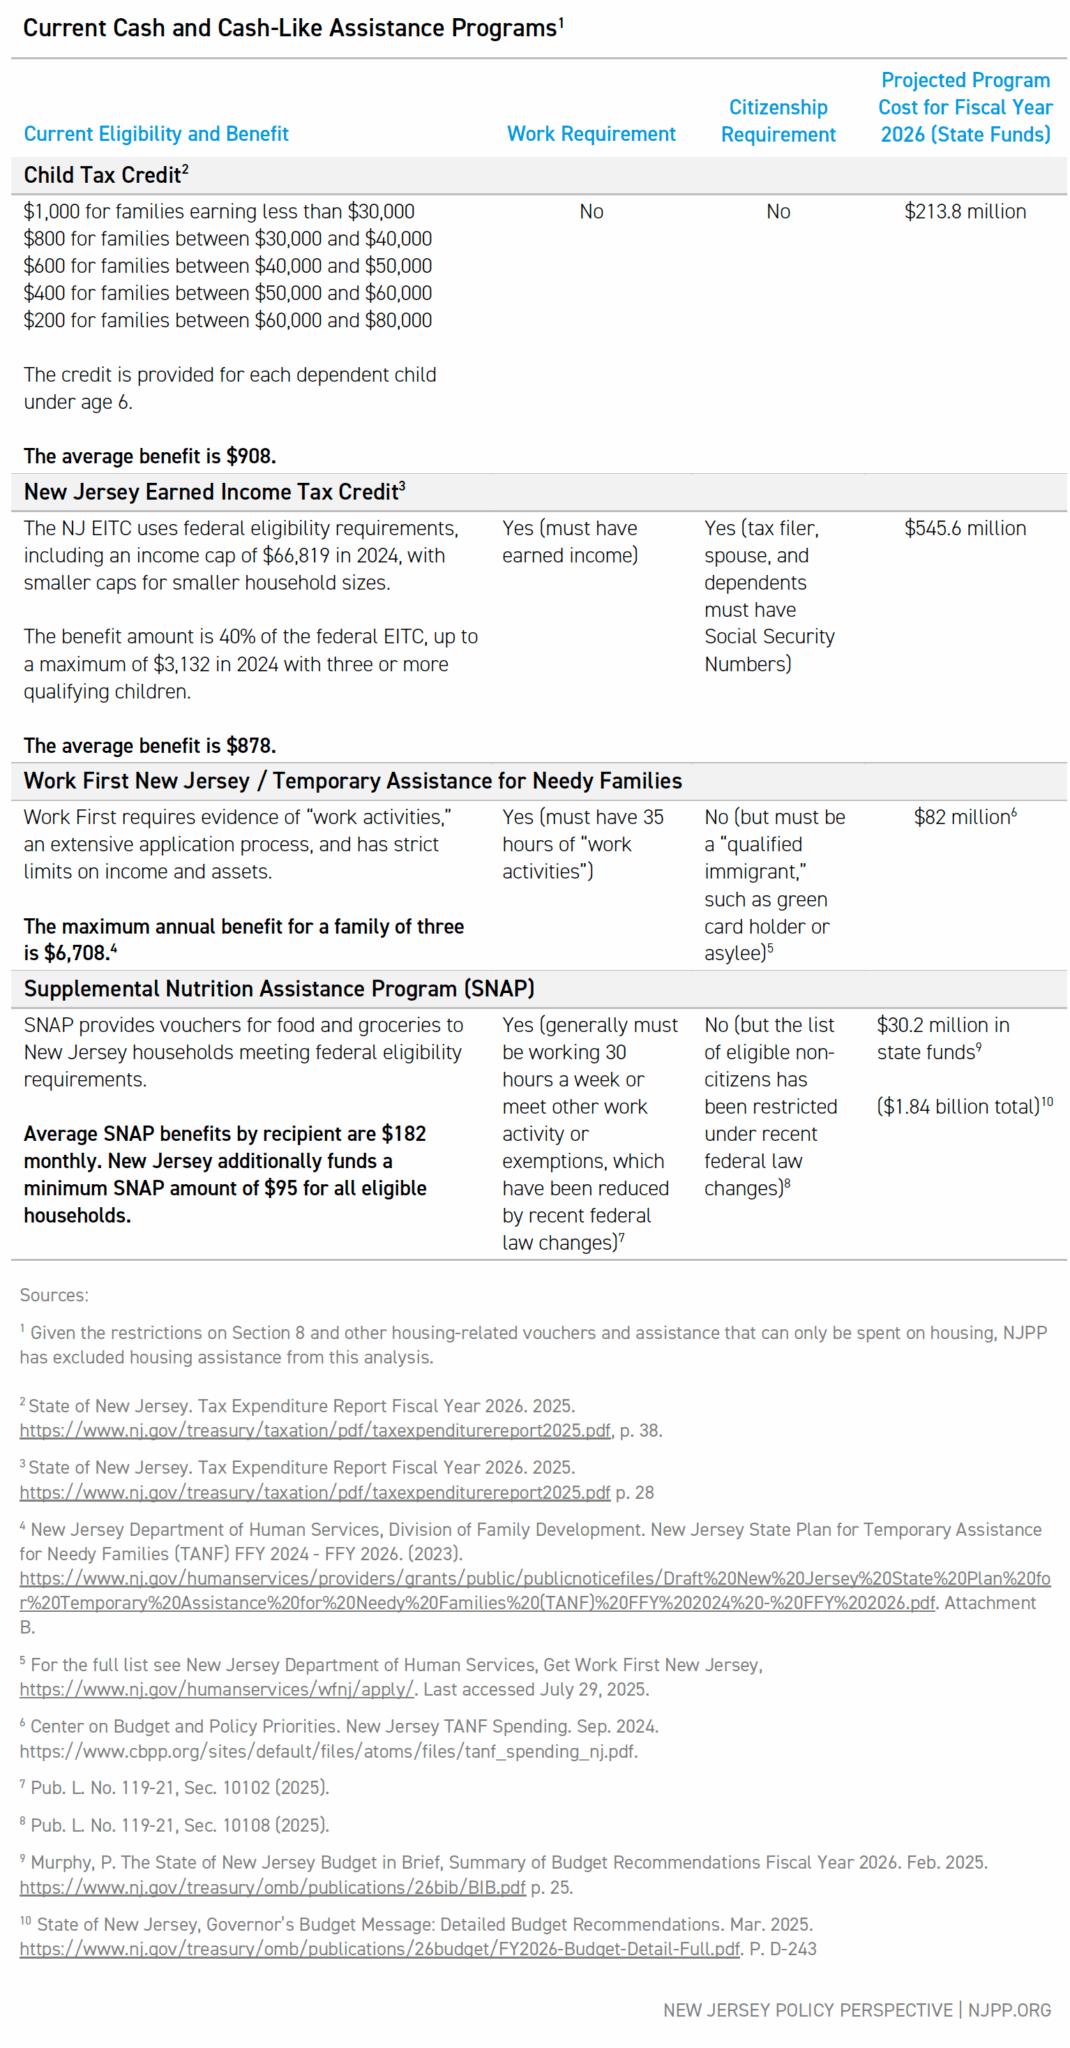
Each of these programs has limitations that prevent some eligible residents from accessing them. For example, people must file state taxes in order to receive the Earned Income or Child Tax Credits, but filing is not required for households earning less than $10,000 annually ($20,000 if married filing jointly).[26] Other restrictions, such as work requirements and citizenship restrictions in both Work First New Jersey and SNAP, make the programs less accessible for households.[27] Each extra layer of bureaucratic red tape makes it harder for families to navigate a complex web of government systems.[28]

Despite these limitations, each program puts money (or, in the case of SNAP and Work First New Jersey, cash-like debit cards) directly into the hands of families, resulting in lower poverty and improved outcomes.[29] The Earned Income Tax Credit, for example, has shown dramatic reductions in poverty for people receiving the credit while increasing employment rates.[30]

In combination, these programs provide New Jersey with an existing program structure and proven record that can serve as the basis for a more ambitious proposal to reduce poverty for all children.

Two Pathways Towards Economic Security

New Jersey has the opportunity to be a national leader in improving family affordability and reducing poverty. By learning from the lessons of the expanded Child Tax Credit and the guaranteed income pilots, New Jersey can supercharge the cash it provides to families and cut red tape, giving families the freedom and flexibility to choose how best to spend their money.

New Jersey Policy Perspective proposes two pathways to dramatically cut child poverty and expand economic freedom for families.

One pathway builds on New Jersey’s existing programs that address family affordability through cash or cash-like benefits, such as the Child and Earned Income Tax Credits, the Work First New Jersey program, and the Supplemental Nutrition Assistance Program (SNAP). This pathway would increase benefit amounts and simplify program access, though federal program changes may limit how much a state can improve access.

The second pathway aims to redefine what a guarantee of family affordability could look like in New Jersey by guaranteeing that the family of any Medicaid-eligible child receives an annual child allowance of $5,000 to help address the costs of raising a child. Based on prior research, such a change would dramatically reduce child poverty and would make the concept of “freedom from want” a reality for New Jersey children.

Both programs would help to advance racial equity, as children in lower-income households are disproportionately Black and Hispanic/Latinx.[31] Research around the pandemic-era Child Tax Credit expansion showed that it lowered Black-white and Hispanic-white income inequality, especially in the lowest-income ranges.[32] A 2025 report on reparations for New Jersey’s history of slavery and racial injustice included guaranteed income as one of its key recommendations, in addition to cash reparations to compensate for past injustices and baby bonds programs to reduce wealth inequality.[33]

Pathway 1: Building on Success

As noted above, New Jersey’s cash and cash-like assistance programs have made great progress towards their goals of reducing poverty, but gaps remain in their effectiveness due to the size of the benefits and state-based restrictions on the programs. Addressing each of these two issues can supercharge the poverty-fighting effects of these programs.

Increasing benefit amounts and eligibility

One of the lessons of the research around unrestricted cash is simple — increasing the amount of money given increases the poverty-fighting effects.[34] To that end, New Jersey can substantially increase the effectiveness of its existing programs by simply increasing the amount of money it spends.

Proposed Changes in Benefit Amount and Eligibility

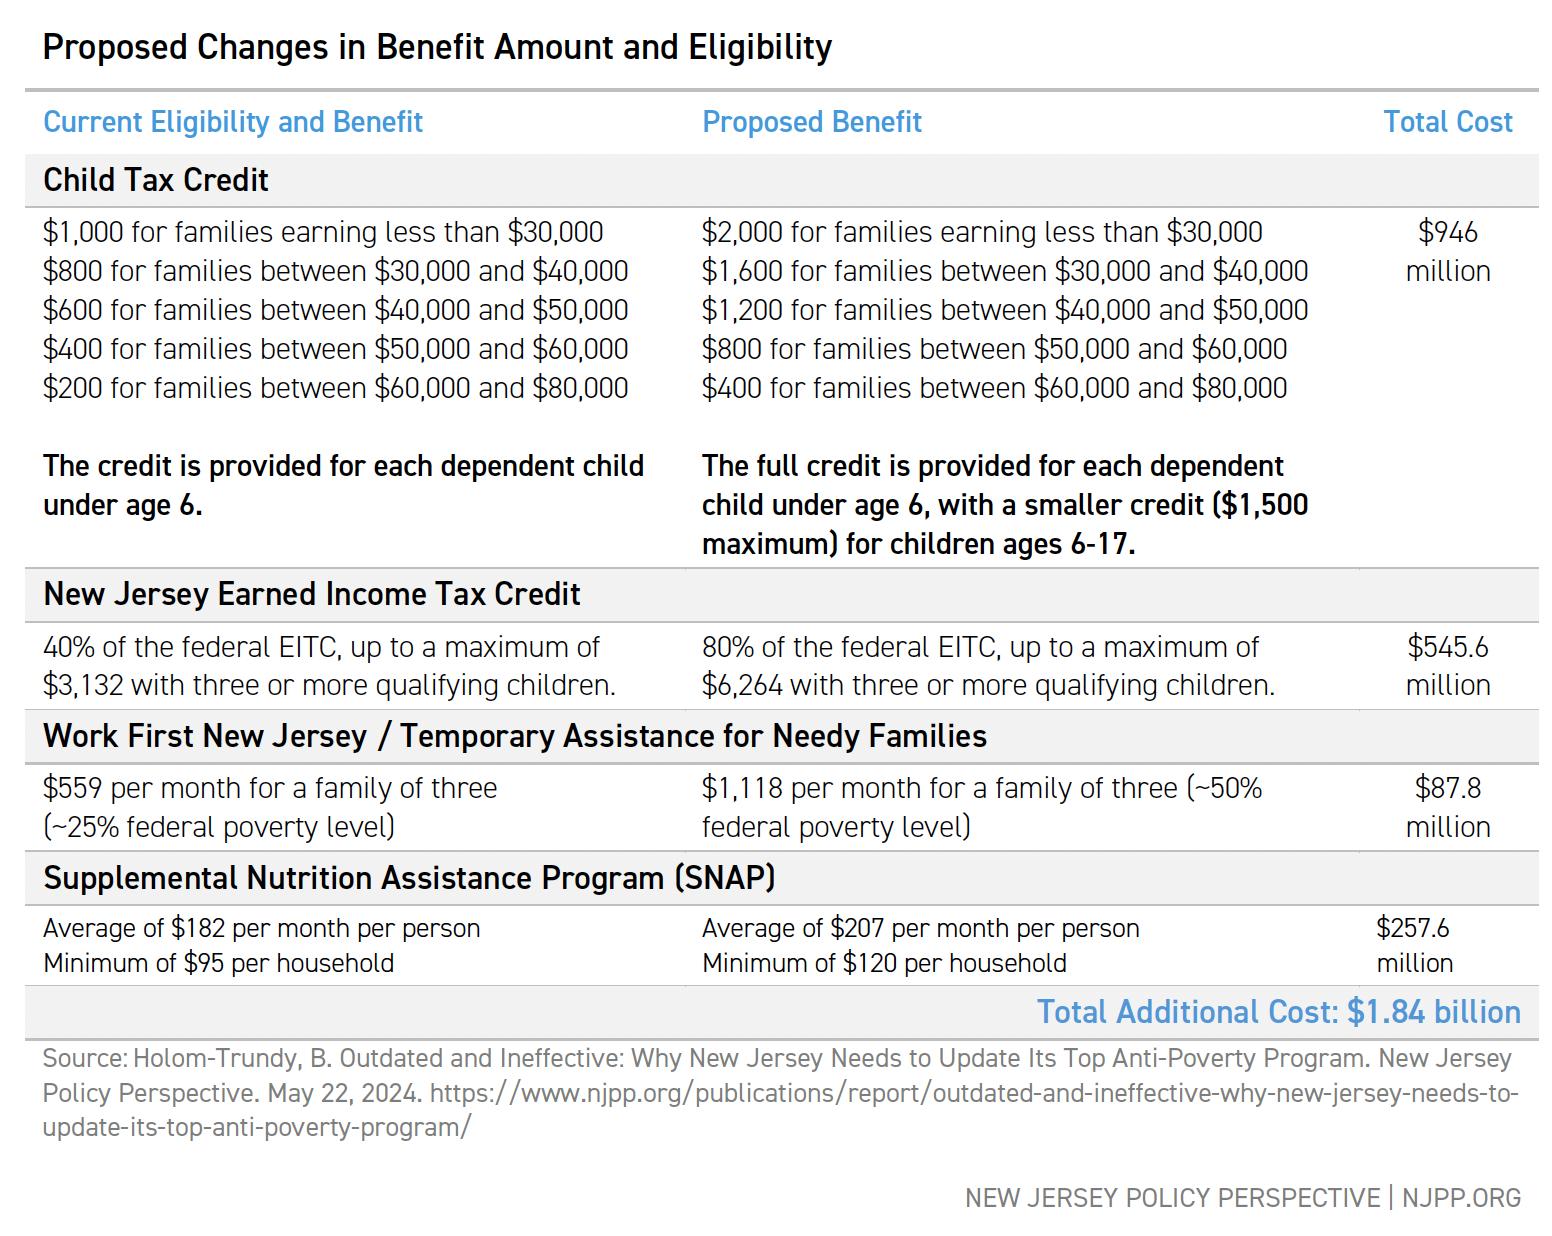
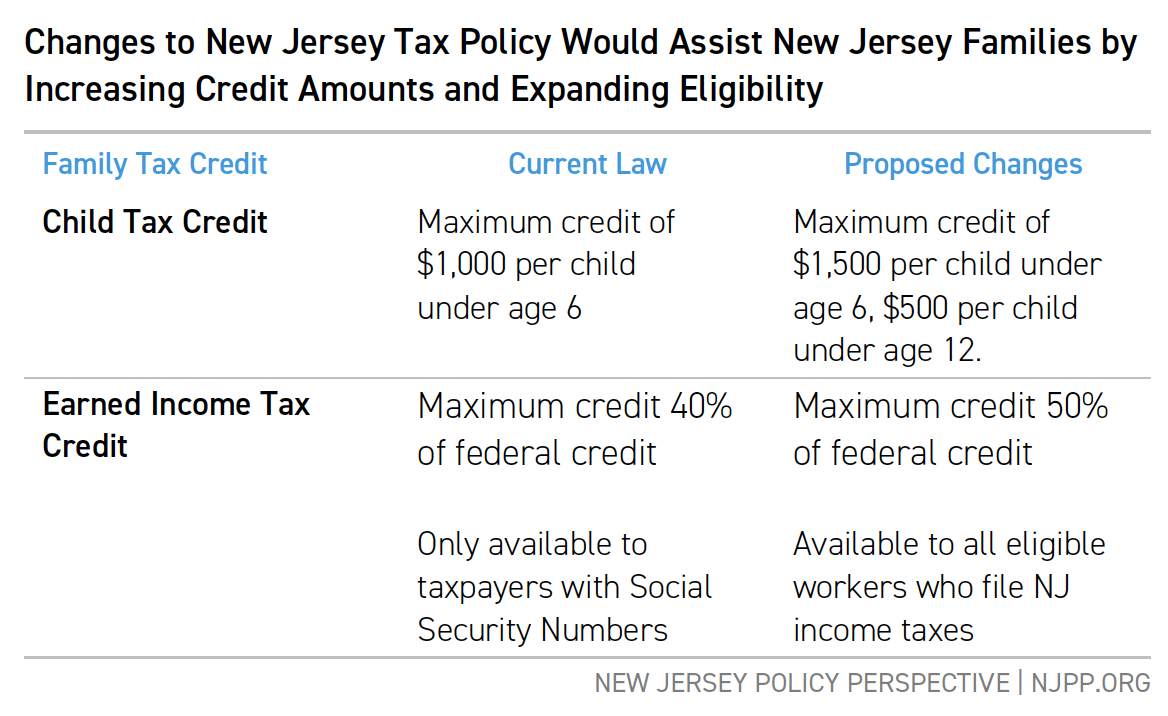
Each of these changes takes a program with an existing track record of distributing cash or cash-like benefits directly to households and increases the benefit amount to more accurately reflect the cost of living in the state. Direct cash programs (Child Tax Credit, Earned Income Tax Credit, and Work First New Jersey) would see a doubling of their benefit amounts, with the Child Tax Credit extending up to ages 6 through 17 at a slightly lower credit amount, with a maximum of $1,500.

For SNAP, this proposal recommends an extra payment of $25 per person per month, including an increase in the minimum household SNAP payment. This would more than double the state investment in food and nutrition assistance programs, currently set at $154.7 million.[35]

These increases would put substantially more money into family pockets and budgets, without creating new programs or administrative barriers.

Reducing red tape
Another important lesson is the damage caused by the administrative burdens of applying for programs. In New Jersey, these obstacles fall into two categories:

  • Eligibility restrictions that exclude people from the program due to work, education, citizenship, or other requirements.
  • Application and paperwork hurdles that make it difficult for people to apply and receive support, even if they are eligible.[36]


Eligibility restrictions.
The work requirements of Work First New Jersey and SNAP are perhaps the most prominent, limiting access to benefits only if strict employment hours are maintained. But these are not the only restrictions. Due to changes in federal law, SNAP, for instance, will now exclude refugees, people seeking or granted asylum, trafficking victims, and many other legally present immigrants.[37] Many of these restrictions are federally based and cannot easily be changed by the state.

At the state level, New Jersey has made some policy decisions that make these restrictions more difficult. The Work First New Jersey program retains a legacy of prior program decisions that cut off the program from access. NJPP has long pushed for fixes to some of these restrictions, such as:

  • Eliminating barriers to participation for individuals taking college classes
  • Smoothing the “off-ramp” for families to reduce the cliff effect when benefits suddenly end, putting families back into economic insecurity
  • Aligning asset rules with other social safety net programs.[38]


Application and reporting hurdles.
New Jersey has taken strides to try to simplify the process, using a more streamlined online application. For SNAP, New Jersey has already used most of the flexibility available from the federal government to make the application easier for applicants, by extending eligibility certification windows and time limits, simplifying reporting, and enacting simplified eligibility.[39]

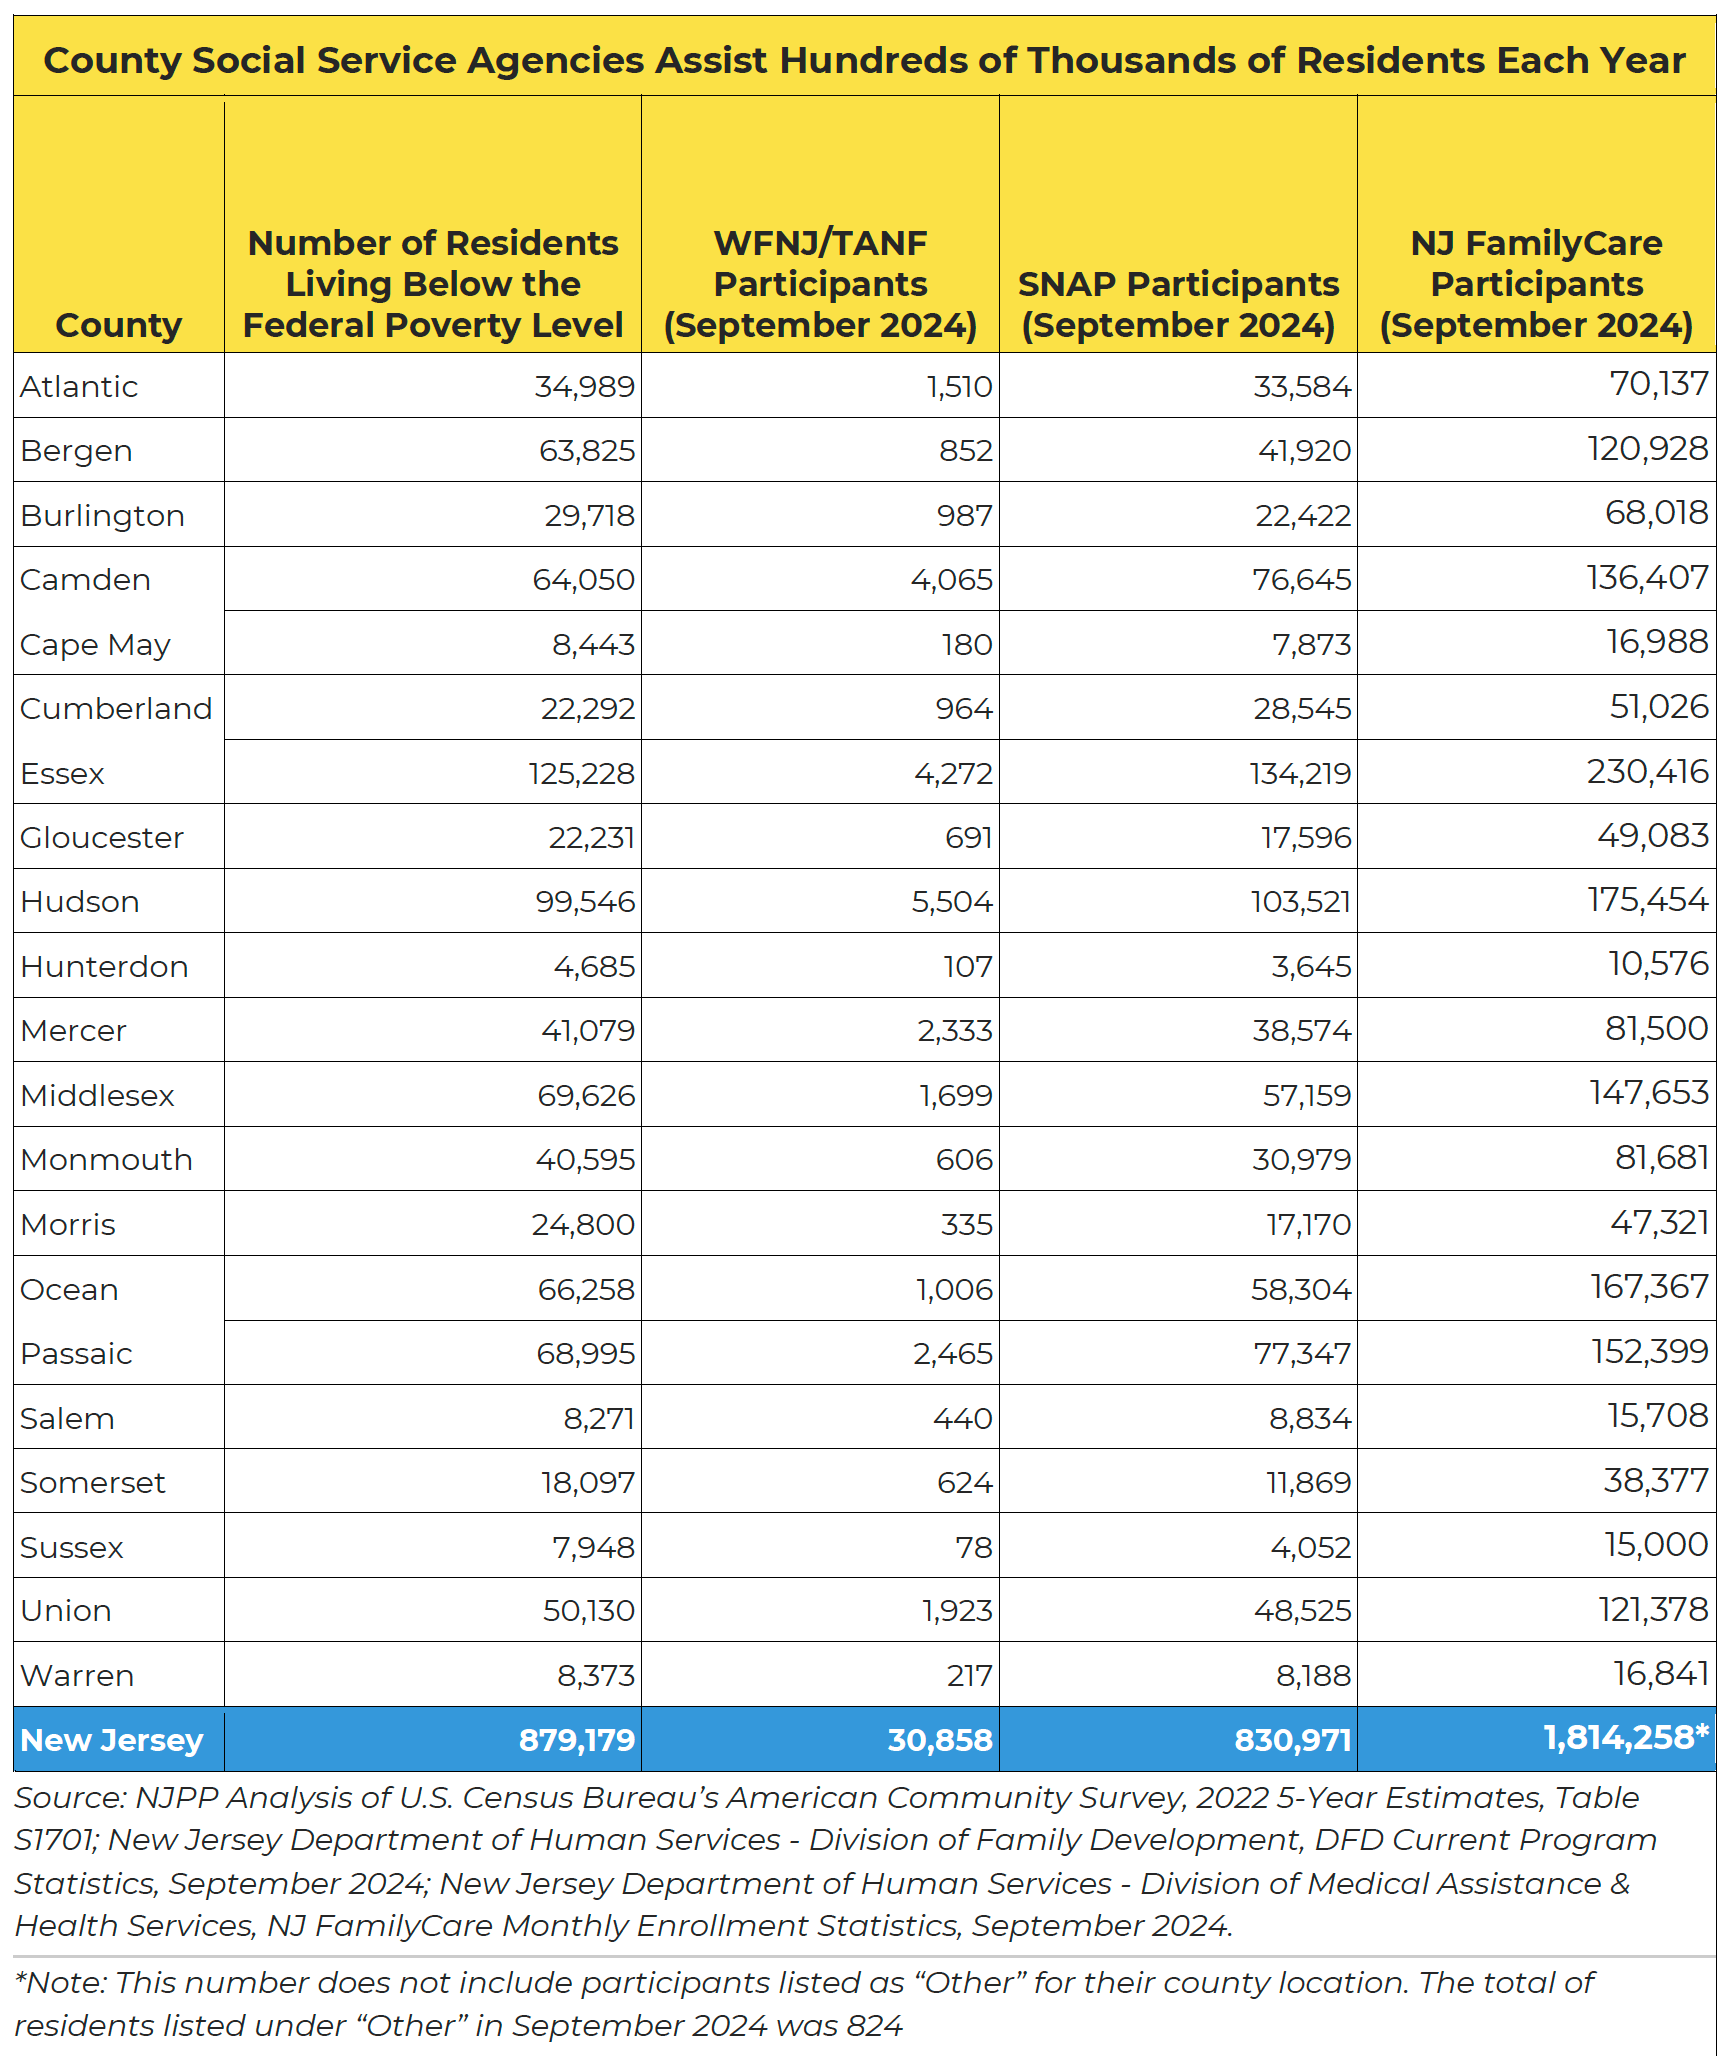
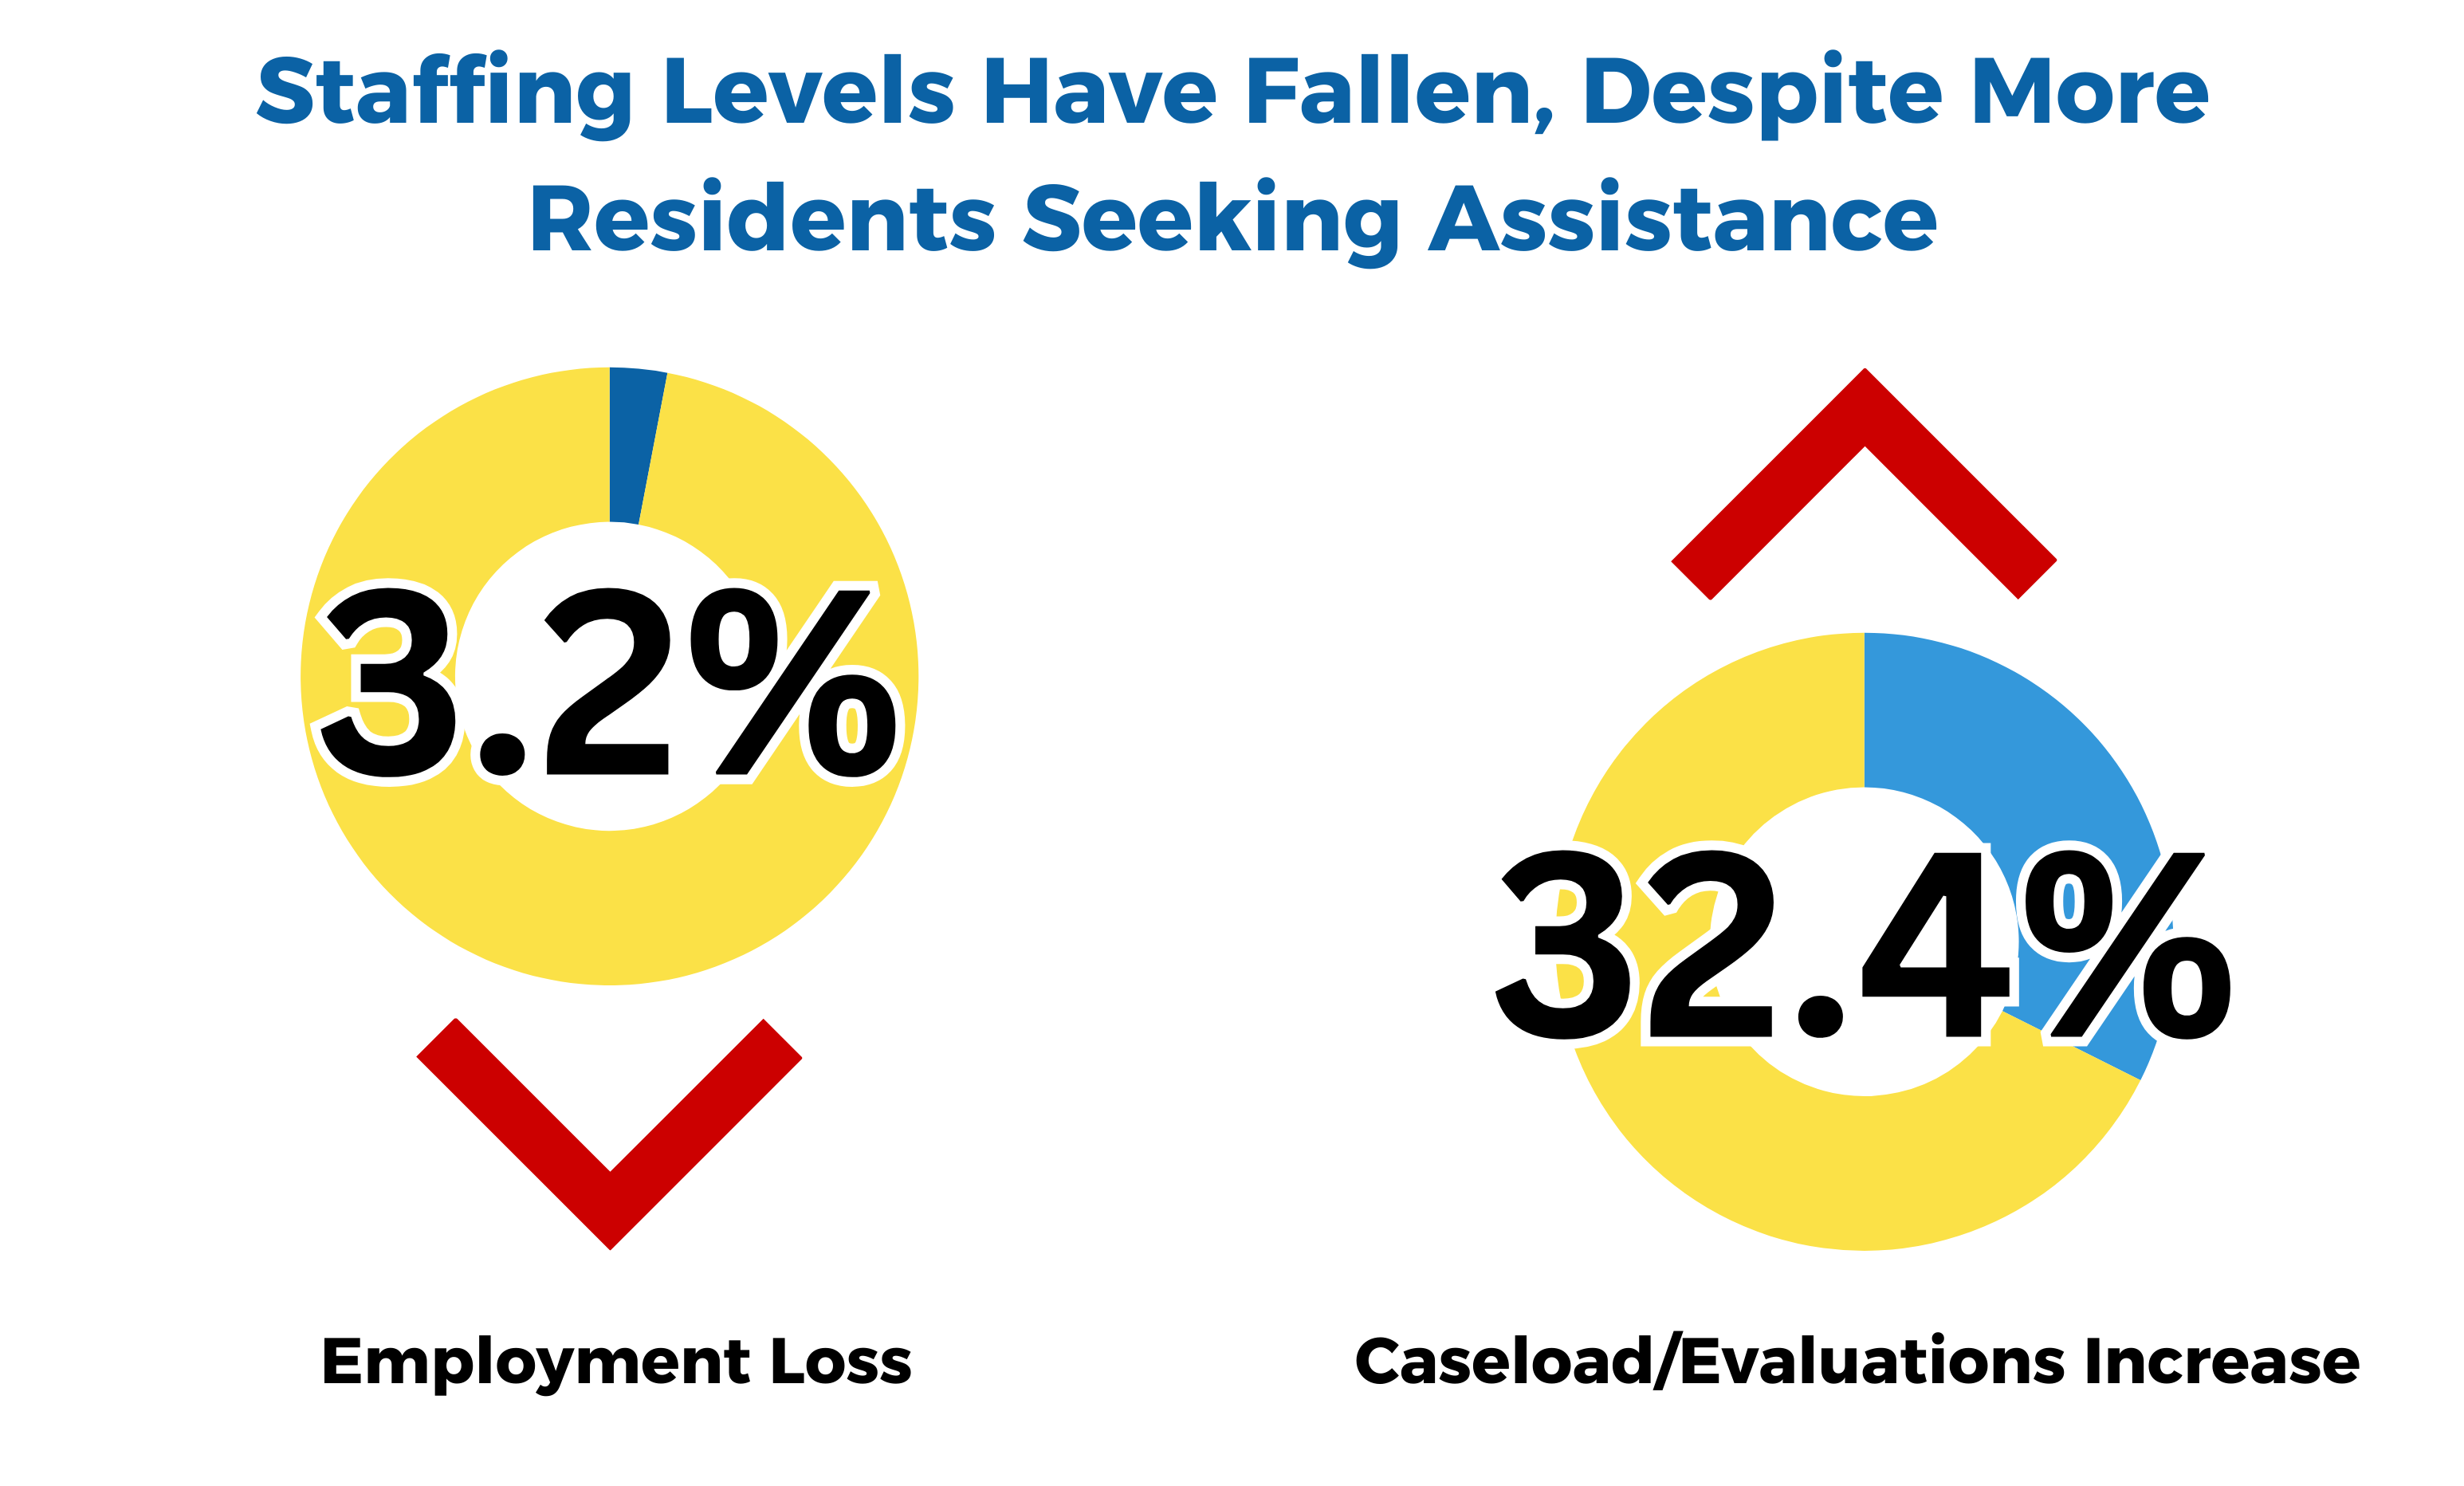
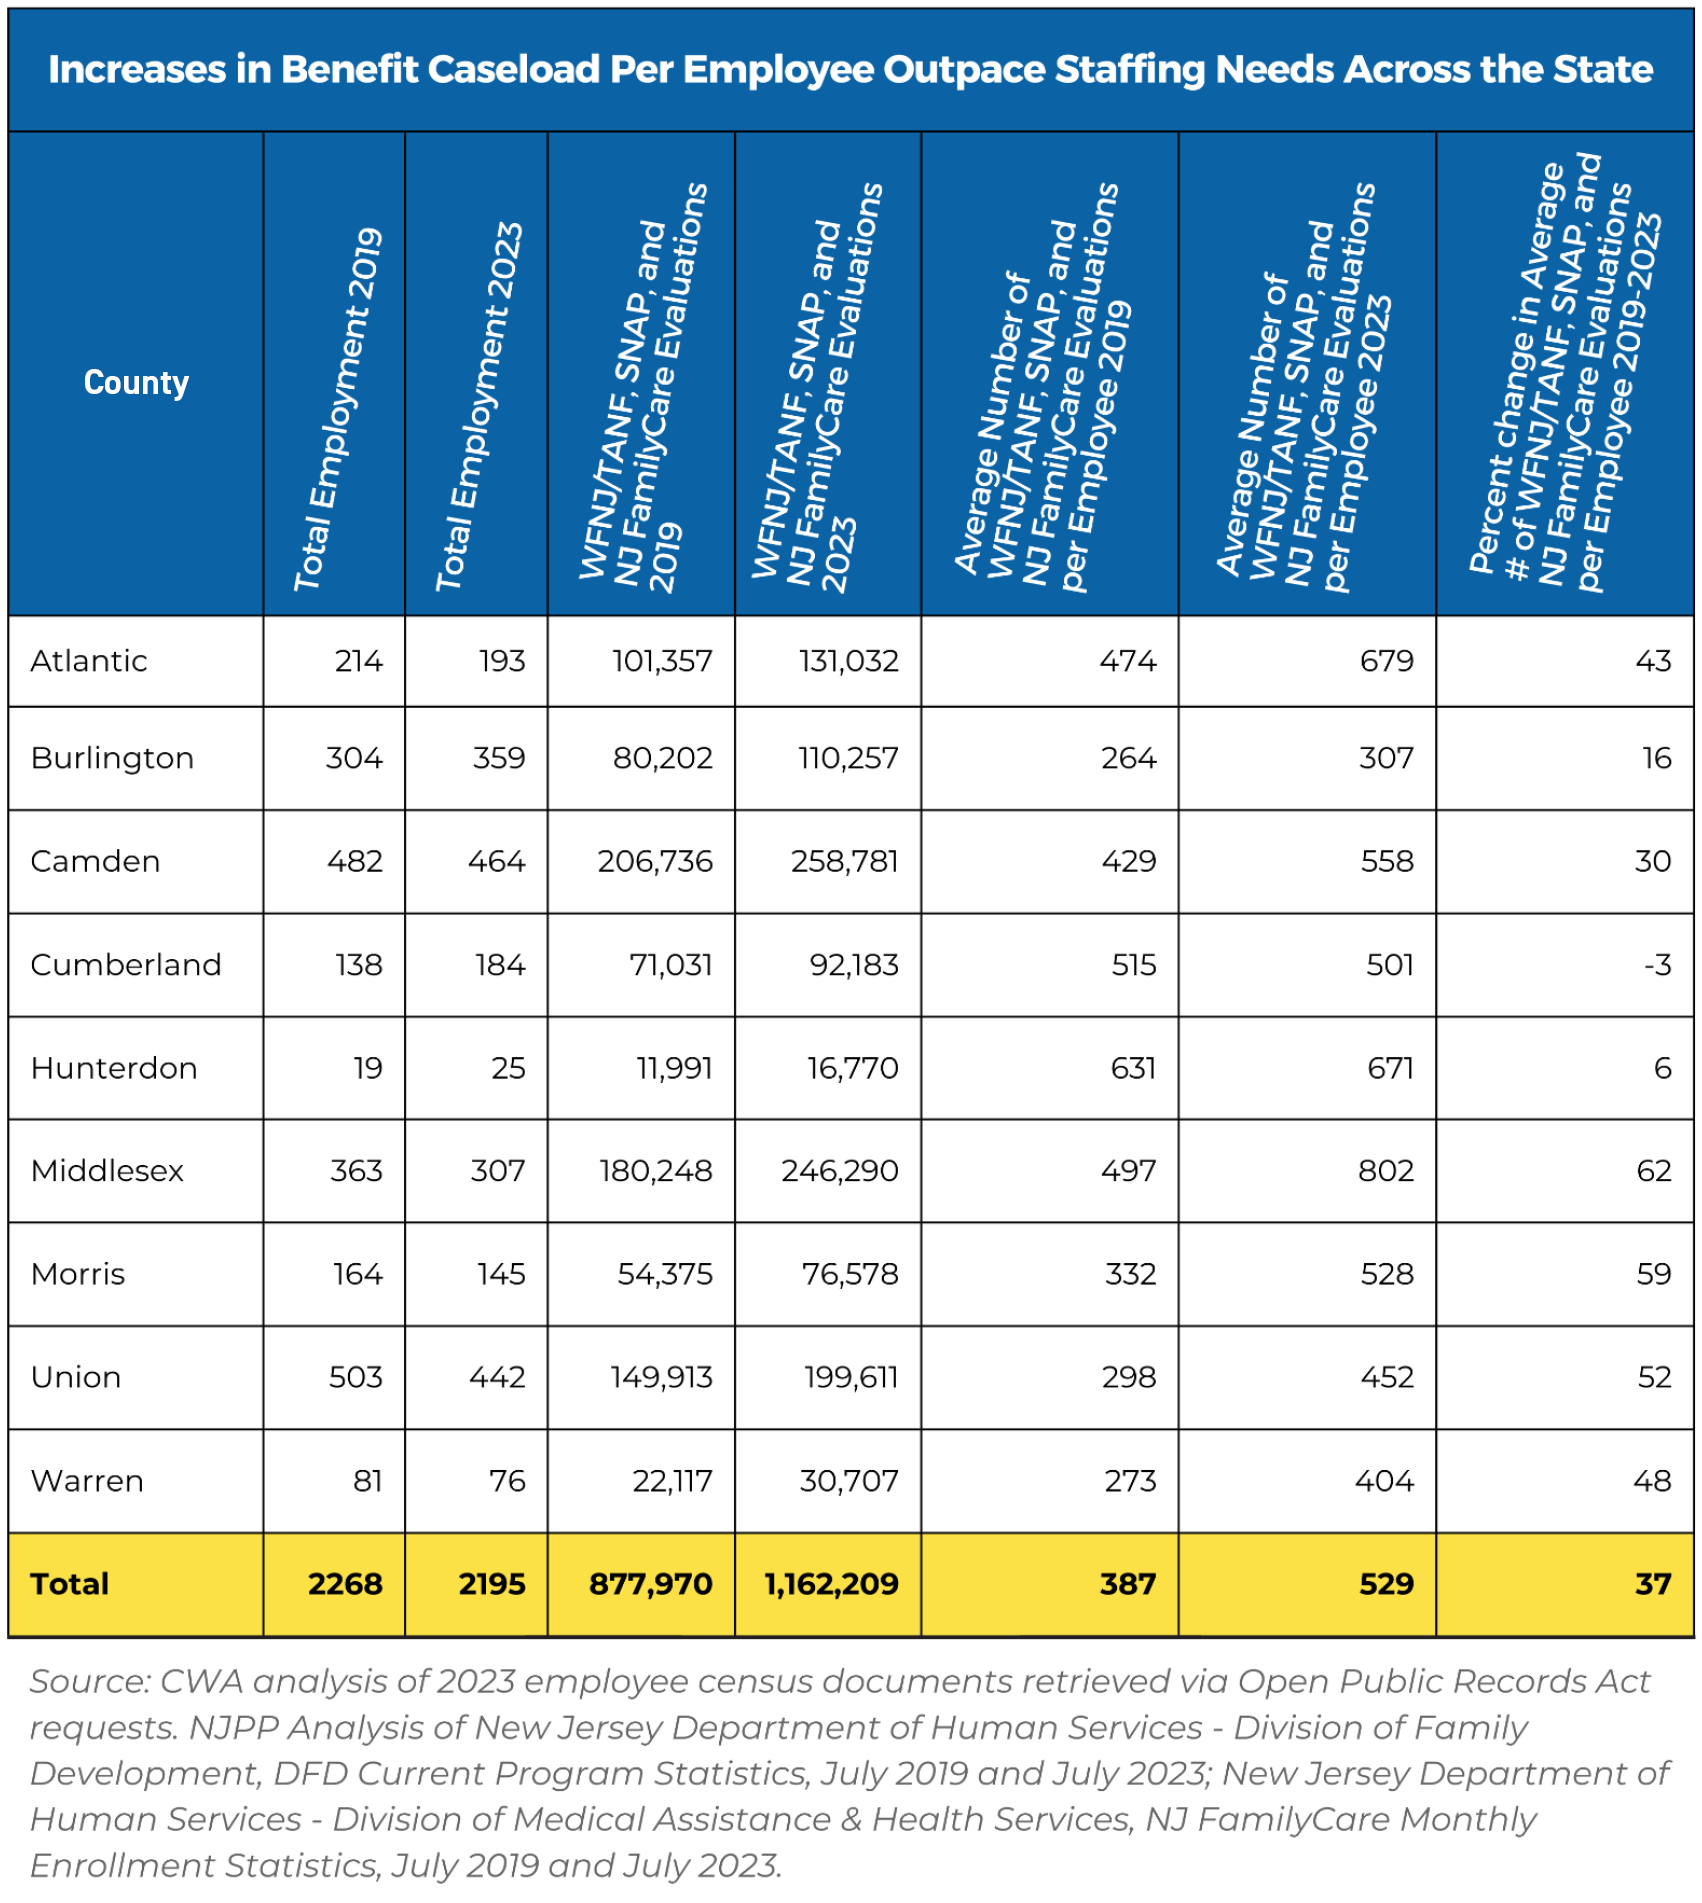
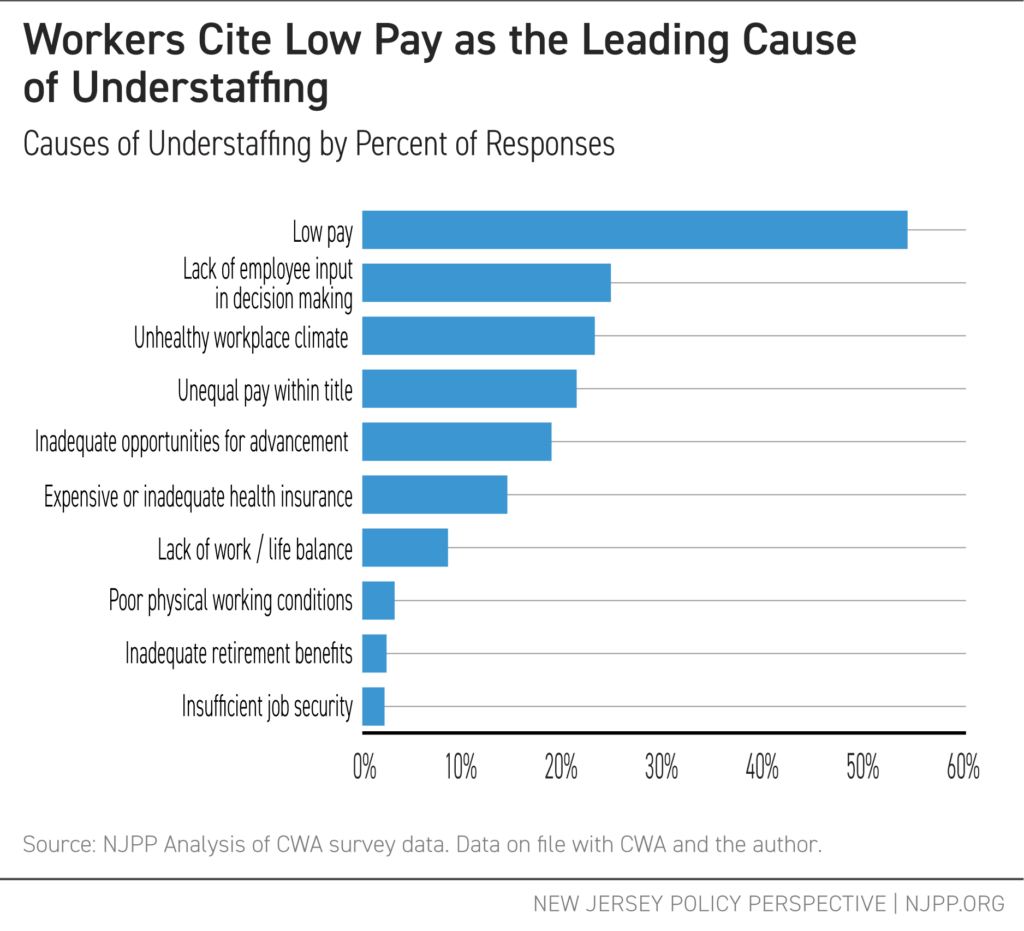
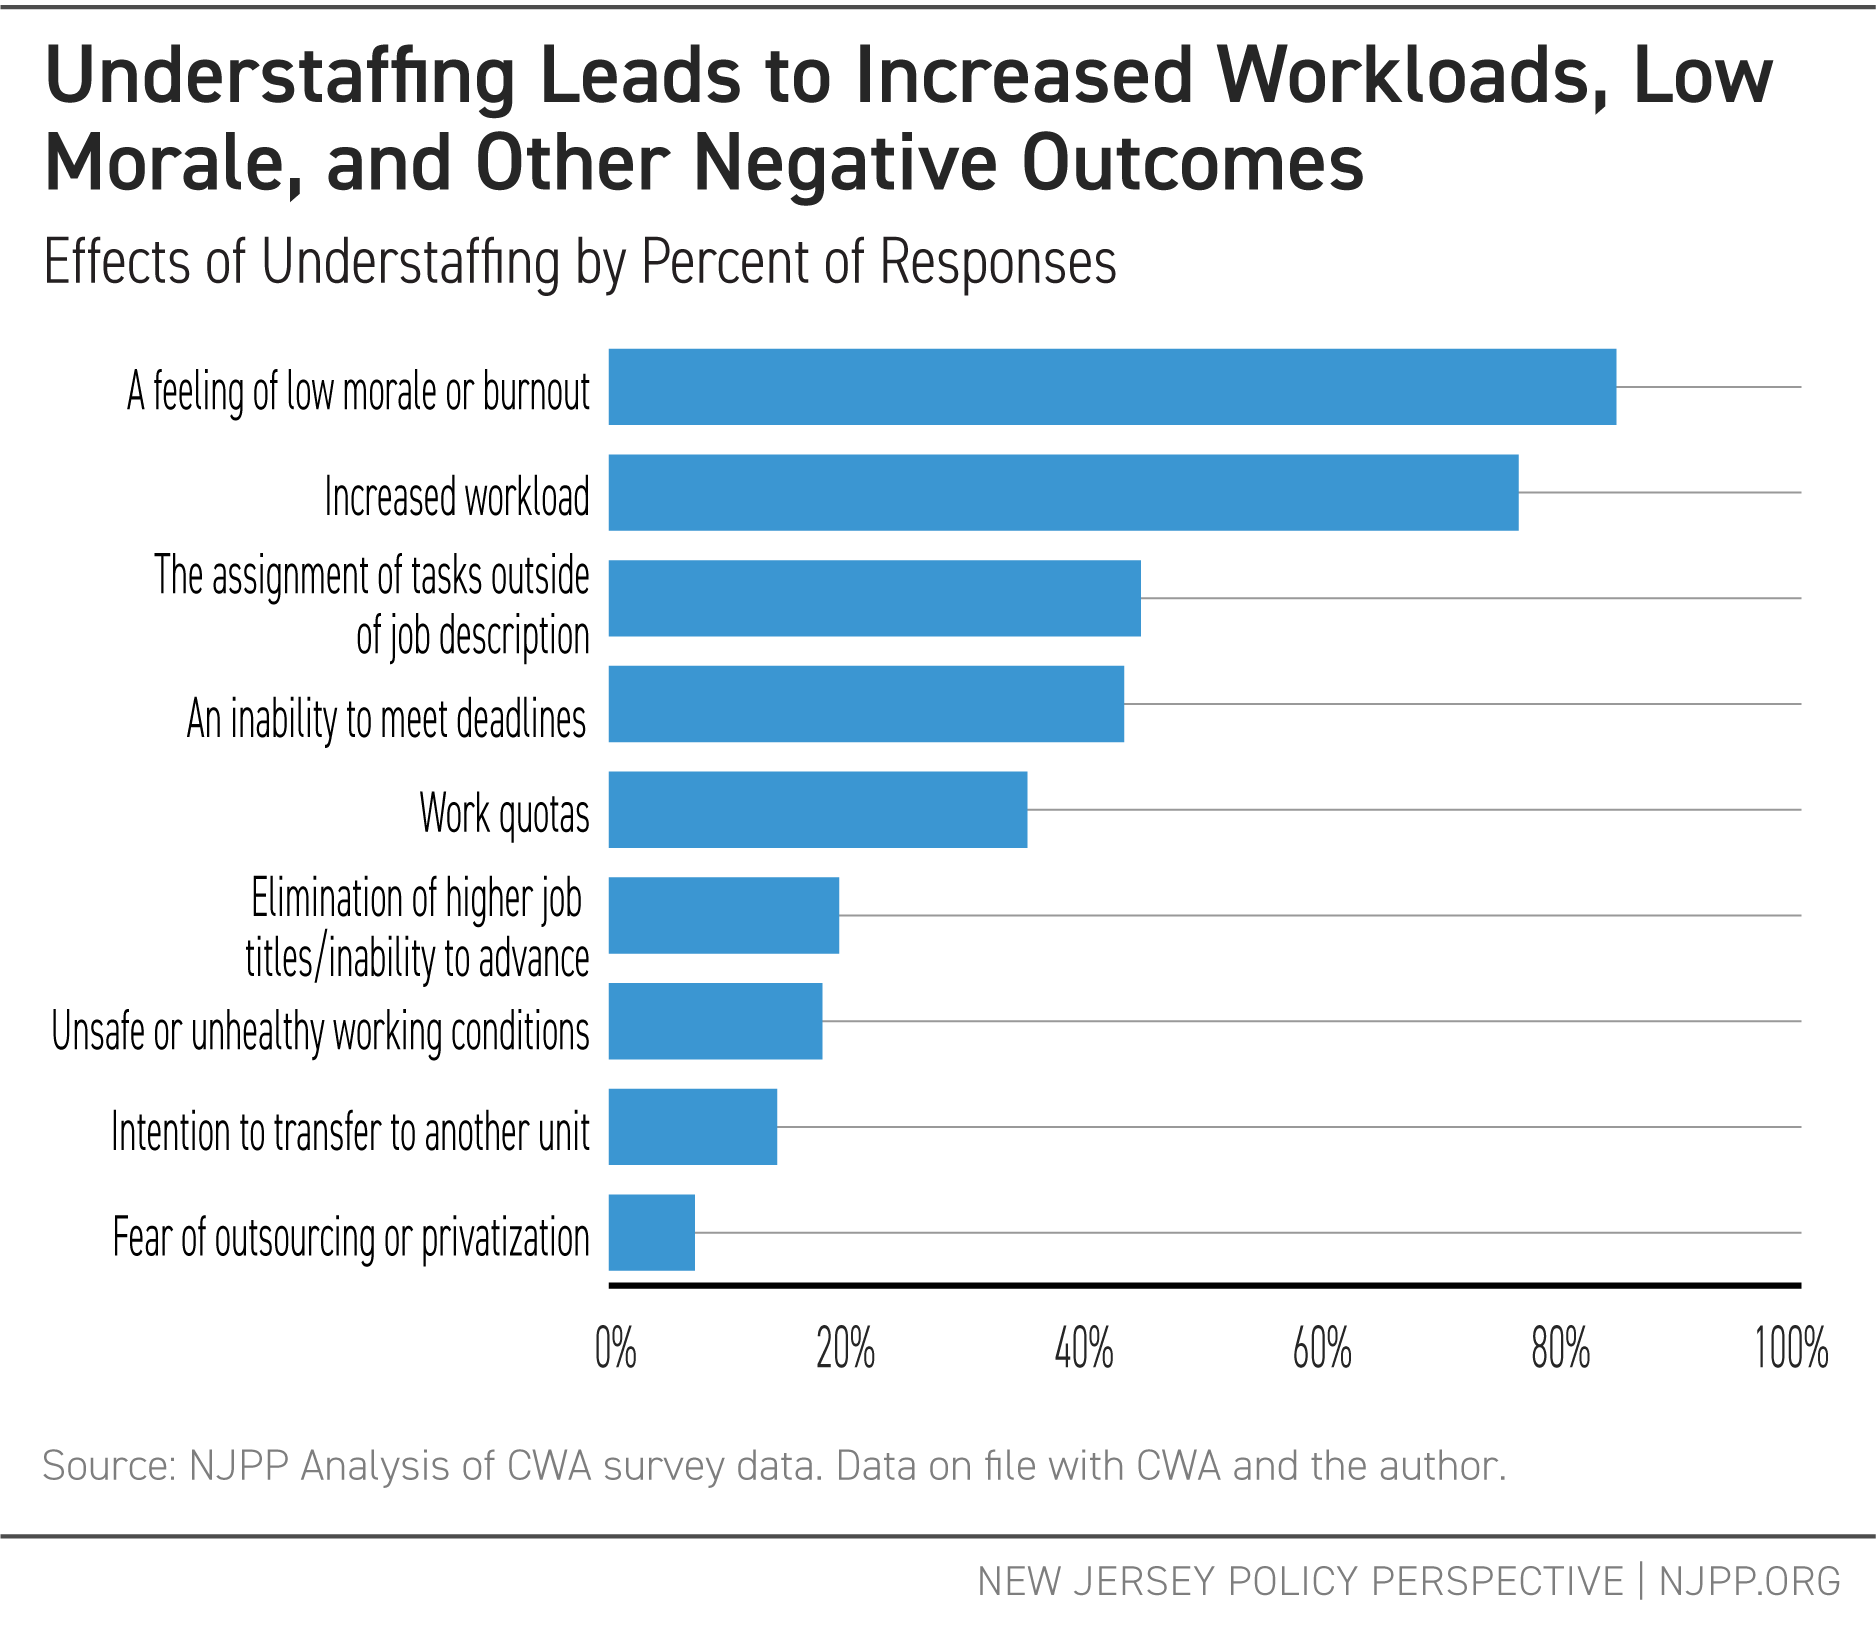
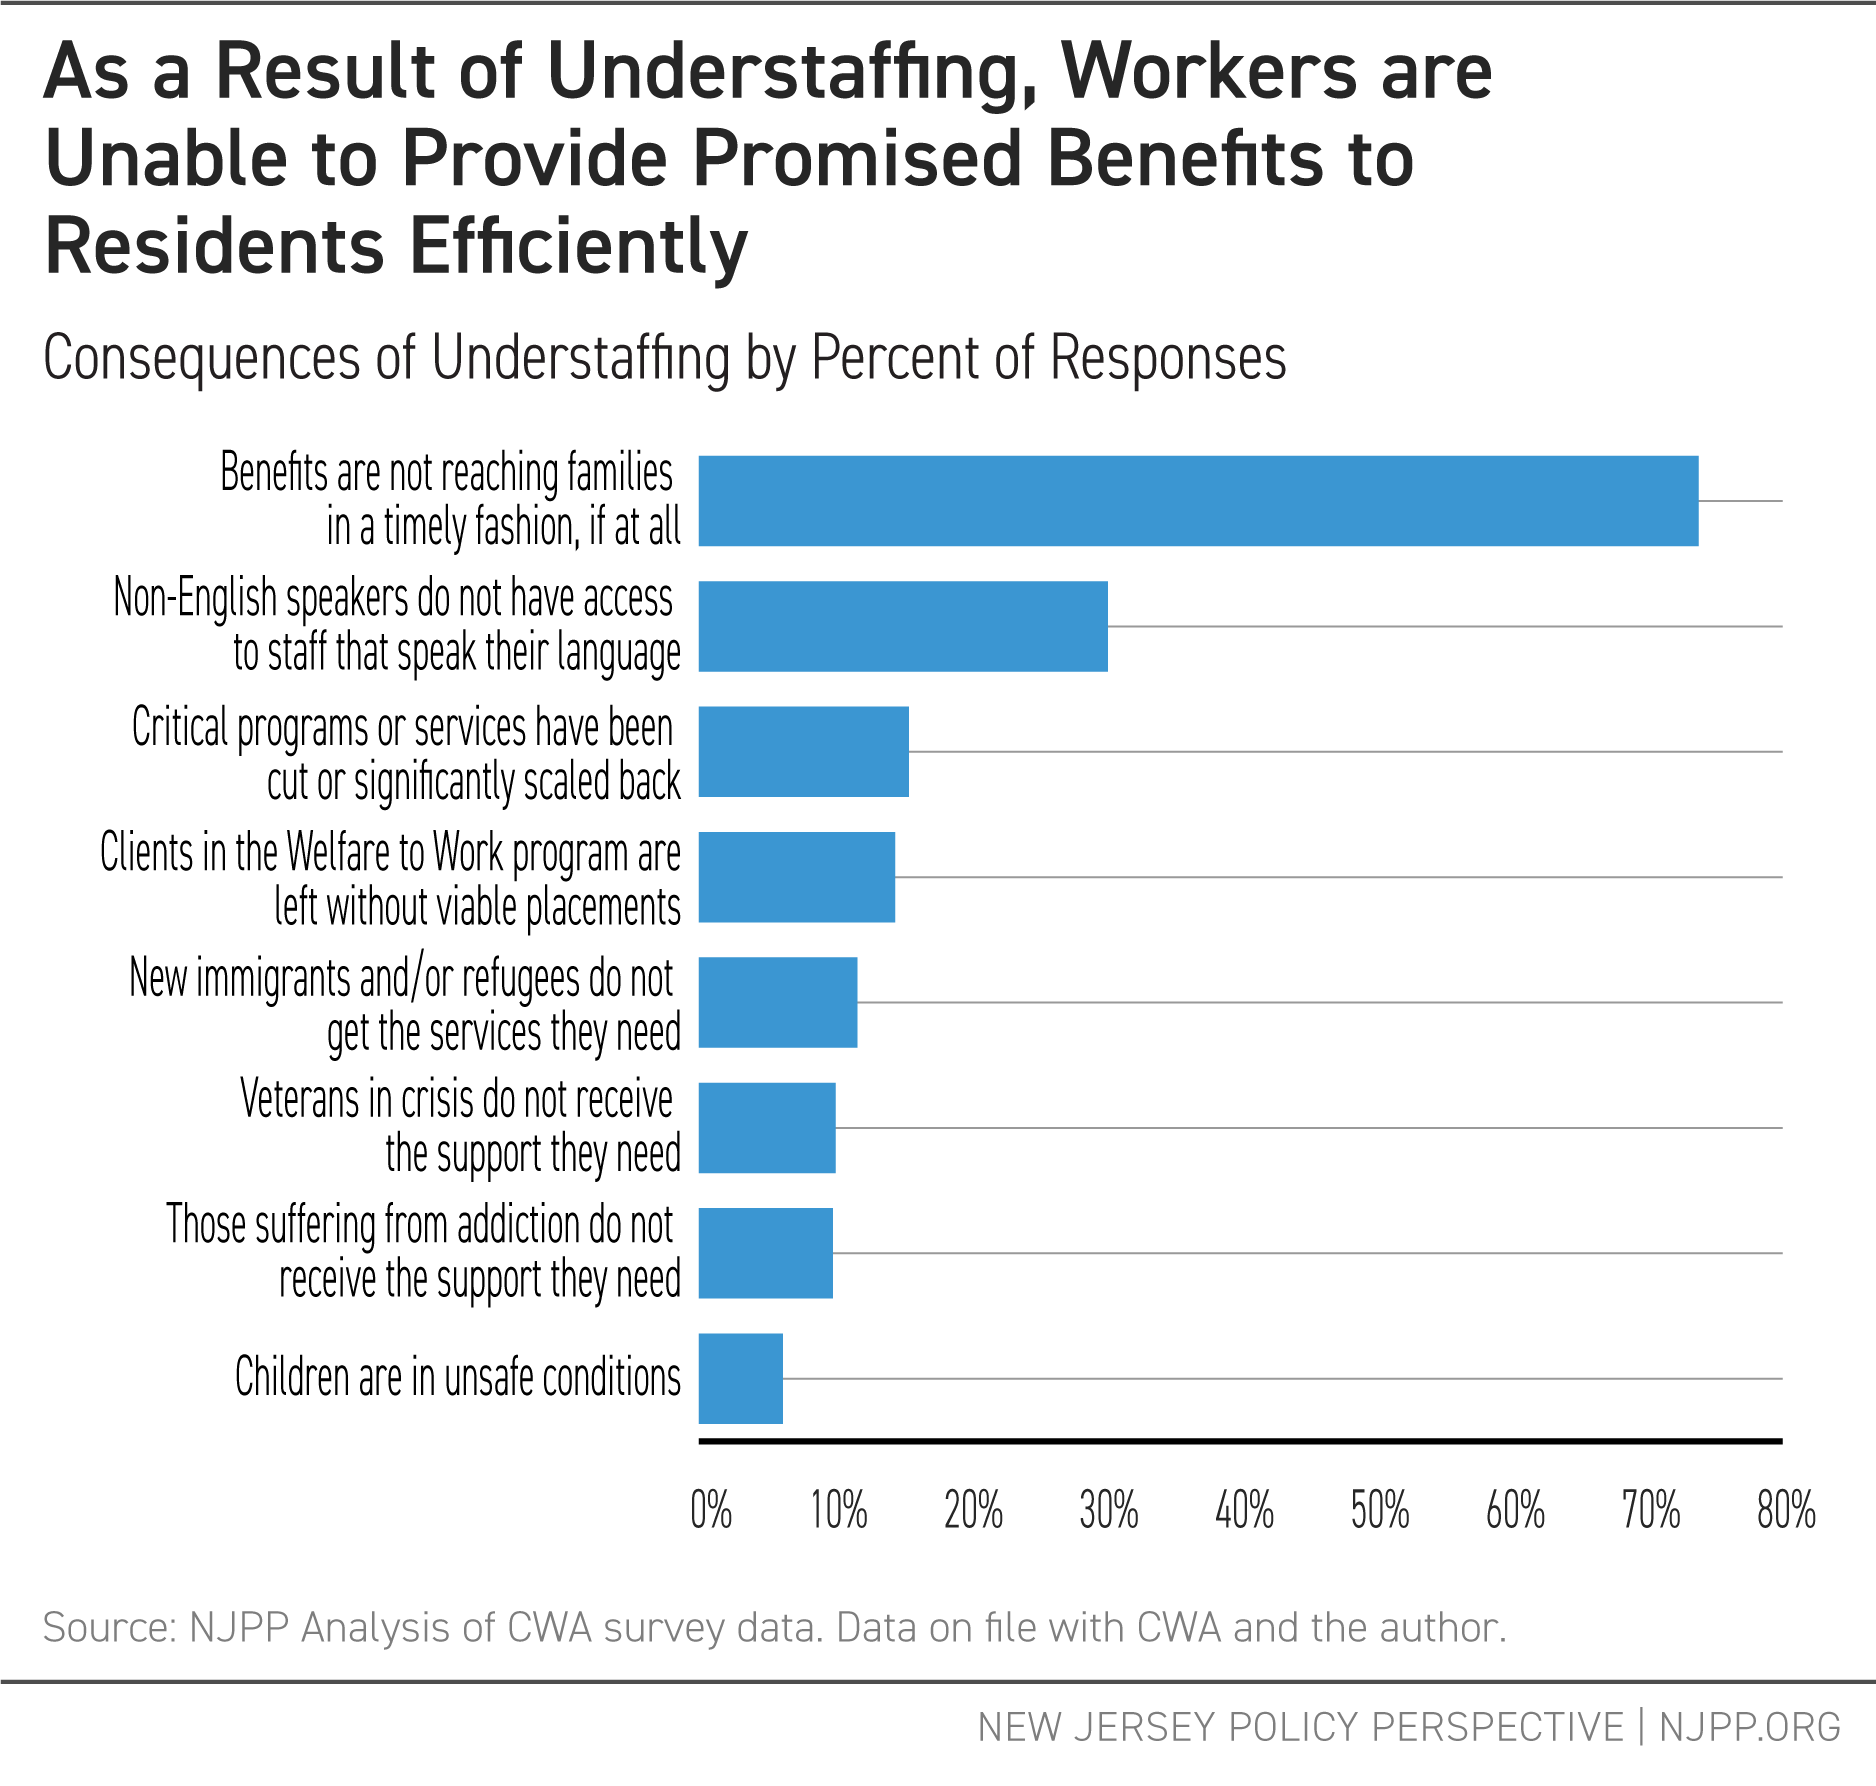
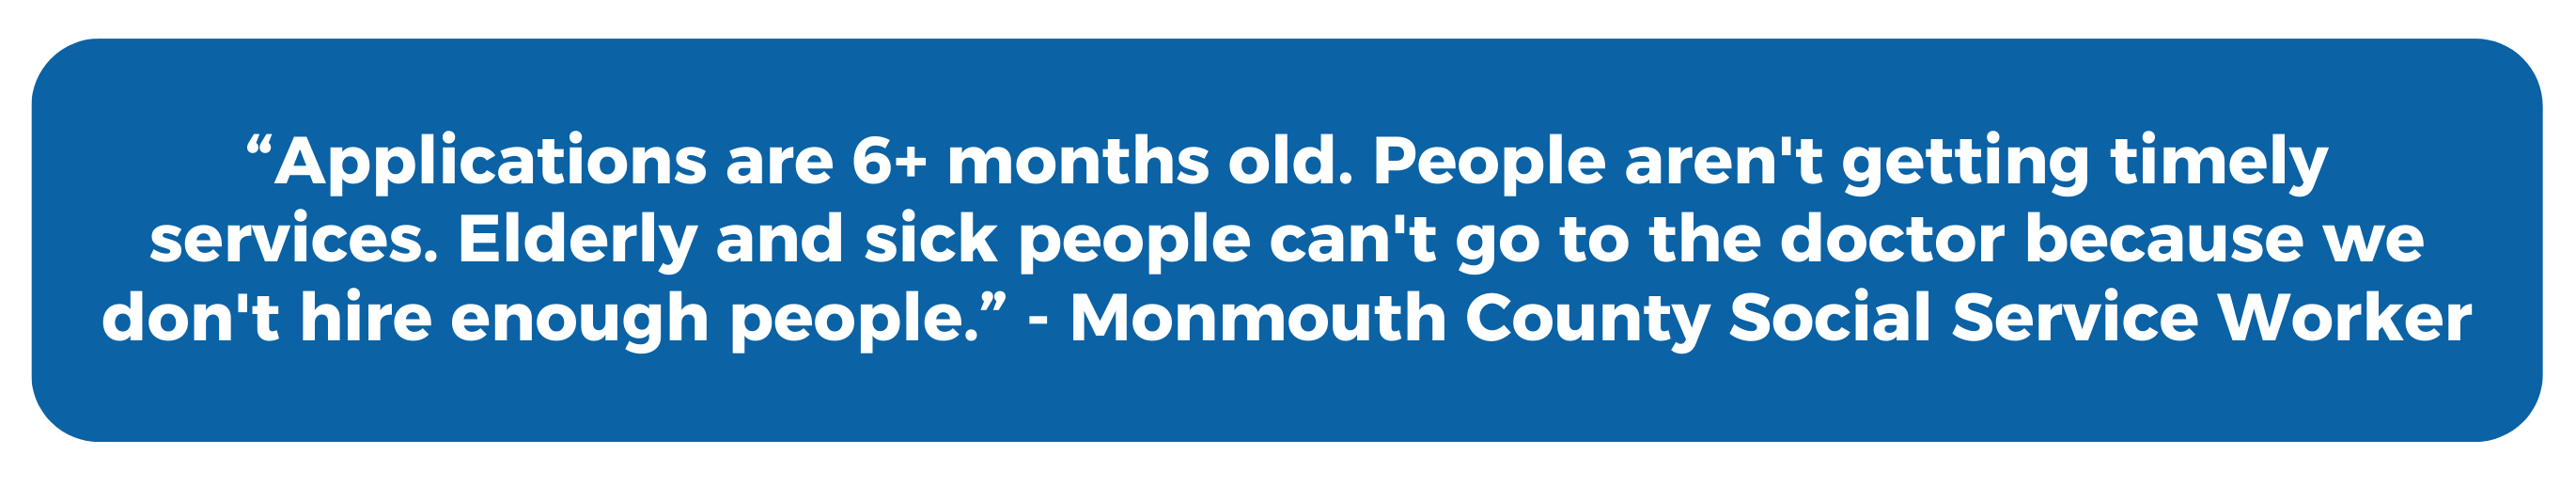
Nonetheless, one major obstacle to use of both programs is the uneven staffing levels and training at county social service agencies. County social service agencies are the main point of contact for applicants for programs such as SNAP or Work First New Jersey. As prior NJPP research has shown, low staffing levels at these agencies have led to higher caseloads, while low pay makes it difficult to retain staff.[40]

Application and paperwork challenges also remain for tax filing, which is required to obtain the Child and Earned Income Tax Credits. People and families who do not file state taxes end up missing out on critical payments, including people who live in poverty, who are Hispanic or Black, who are single parents, or who live in rural areas.[41] Even among people who do file, tax credit provision is not automatic, instead requiring additional work on the part of the tax filer to apply for the credit. As a result, nearly 1 in 5 New Jersey EITC-eligible households who filed federal taxes did not claim the credit.[42] A recent cut to the free federal tax filing program Direct File will make tax filing even more burdensome for low-income families.

Making the application process less difficult and more automatic will improve the effectiveness of the programs in getting money to households who need it most. It is perhaps unsurprising that people with the least money have the hardest time filling out government forms.[43]

Reducing red tape, combined with higher benefit amount, would ease life substantially for lower-income families trying to get by in New Jersey.

Pathway 2: The New Jersey Family Guarantee

The second pathway for New Jersey would be more life changing — to put the state on a path to provide a real child allowance and cut child poverty by half. Rather than simply expanding existing programs, this would set forth a new basic standard for all children in the state.

Put simply, the program would guarantee a $5,000 annual payment to all Medicaid-eligible children in New Jersey (roughly 150 percent of the federal poverty level) or whose births were covered by New Jersey’s Medicaid program for pregnant mothers (roughly 200 percent of the federal poverty level).[44] This would reach the more than 640,000 New Jersey children who receive Medicaid, roughly 1 in 3 children, including those eligible through the state-funded Cover All Kids program.[45]

The program would have a modest start, focused on a smaller age range (ages 0-3) and a lump-sum payment, laying the groundwork for a world where New Jersey children don’t face the economic chaos of deep poverty.

The $5,000 benefit amount is in line with prior efforts to determine the benefit needed to cut child poverty in half in New Jersey. In 2022, the Institute on Taxation and Economic Policy estimated a $4,400 Child Tax Credit would reduce poverty by 50 percent, which adjusted for inflation, would now be worth more than $4,760.[46] The $3,600 expanded Child Tax Credit from 2021, which dramatically slashed child poverty nationally, would also be worth more than $4,250 in 2025 dollars.[47]

The program would start with a focus on the first three years of life — enrolling families during pregnancy and making them eligible for the $5,000 annual payment as a tax credit, building on the Child Tax Credit. This shares some similarities with the Rx Kids program in Michigan, which uses state TANF funds to provide a lump sum payment and subsequent monthly $500 payments to pregnant and new mothers.[48]

The program would also likely need a phase-out at higher income levels to avoid a “cliff effect,” when a raise in salary or income makes a family ineligible for benefits, leaving them with fewer resources despite gaining income.[49] For the purposes of this cost estimate, however, no phase-out was modeled to make the estimate as conservative as possible.

With each following year of the New Jersey Family Guarantee rollout, an additional year of life would be added to the eligibility range. This gradual increase would help control the cost and allow relevant departments to iron out challenges and address management concerns early on. Eligibility based on Medicaid-covered births would last through age 6, after which benefits would only go out if the child remained Medicaid-eligible.

Such a program would require government staff and systems to stand up. The program would require coordination between the state’s Department of Human Services, which runs the Medicaid program, and the Department of the Treasury, which administers the tax code. To make the process as seamless as possible, the departments would need to create new rules and agreements to protect people’s privacy when sharing information between agencies.

But at its core, the New Jersey Family Guarantee provides a framework for the state to stand as a leader in poverty reduction. No child born in New Jersey would need to go hungry or without the most basic needs if this proposal were fully funded.

Comparing the Proposals

Proposal 1 vs Proposal 2

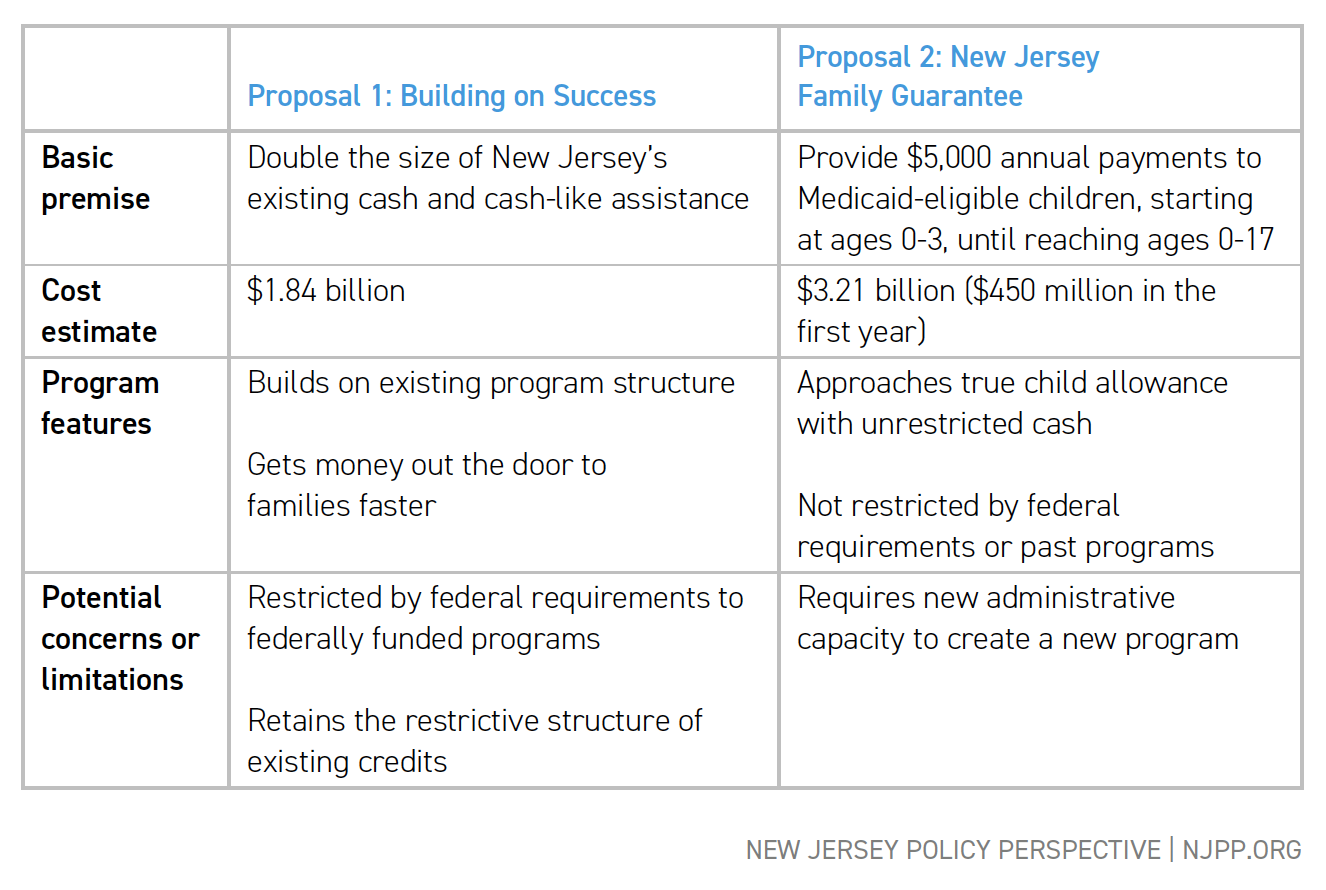
The ramp-up to Path 1 would be substantially faster, with preexisting programs that can simply be increased in size. Path 2 would require more lead time to ensure seamless delivery of the benefit while limiting the administrative burden for applicants and state departments. Importantly, the New Jersey Family Guarantee would be free of federal application and eligibility restrictions that affect the Earned Income Tax Credit, Work First New Jersey, and SNAP, such as work or citizenship requirements.

Both programs also leave open the possibility of shifting to periodic payments more in line with monthly child allowances and guaranteed income pilots. Depending on whether a payment is received as a lump sum or monthly payment, families often change their spending behavior to reflect larger costs like car repairs or smaller recurring ones like groceries.[50] However, at the moment, recurring payments rather than lump-sum tax credit payments often trigger eligibility rules for other safety net programs such as Medicaid or housing assistance.[51]

As to the question of cost, these proposals are necessarily substantial investments. In order for these programs to make a real dent in poverty and hardship affecting as much as one-third to one-half of residents, the state must commit resources.

NJPP has previously proposed a list of revenue-raising policy changes that would generate sufficient revenue primarily from wealthy individuals and corporations to fund the larger of the two proposals.[52]

Although the price tags of $1.84 to $3.21 billion may seem high, state policymakers have seen fit in the past five years to send cash through tax credits for other kinds of recipients:

  • $4.88 billion in annual property tax credits, including $1.2 billion in Stay NJ credits and $2.43 billion in ANCHOR credits[53]
  • $249 million annually on film and digital media tax credits[54]
  • $500 million in artificial intelligence business tax credits[55]


Economic analysis has shown that for every $1 invested in a universal child allowance, society would see $10 in benefits in the long run due to higher future earnings, improved health, and reduced costs.[56] New Jersey’s investment in child poverty reduction would pay substantial dividends for residents now and in the future.

For policymakers looking to make New Jersey truly affordable for families trying to raise children in the state, both proposals offer pathways towards economic security and simply having enough to thrive.

Conclusion

From the Old Age Relief Act of 1931[57] to today’s modern tax credits, New Jersey has long led the nation in fighting poverty. We can lead again.

The federal government has abandoned working families.[58] As politicians and policymakers voice concerns about the affordability of raising a family in New Jersey,[59] these proposals offer a real solution — putting cash directly in families’ pockets to cover high living costs and help hundreds of thousands of children get healthy food, safe housing, and other basic needs.

As Dr. Martin Luther King Jr. said in 1967, “[t]he curse of poverty has no justification in our age.”[60] The sentiment was as true then as it is now. Wealth has only continued to grow while poverty remains stubbornly high.[61] In one of America’s wealthiest states, these plans could end the curse of child poverty, if policymakers are willing to make families a priority.


New Jersey Policy Perspective acknowledges the contributions of NJPP’s Crotty Fellow Kimberly Thomson, who researched and analyzed basic income proposals to model potential scenarios for New Jersey in 2021. New Jersey Policy Perspective also thanks the Institute on Taxation and Economic Policy and the Center on Budget and Policy Priorities for their feedback and partnership in writing this report, as well as the Economic Security Project for its extensive background information on guaranteed income pilots and policy changes across the country.


End Notes

[1] U.S. Census Bureau, U.S. Department of Commerce. “Poverty Status in the Past 12 Months.” American Community Survey, ACS 1-Year Estimates Subject Tables, Table S1701, https://data.census.gov/table/ACSST1Y2023.S1701?q=child+poverty&g=040XX00US34. Accessed on 29 Jul 2025; U.S. Department of Health and Human Services, Office of the Assistant Secretary for Planning and Evaluation, 2025 Poverty Guidelines: 48 Contiguous States (all states except Alaska and Hawaii) (2024),
https://aspe.hhs.gov/sites/default/files/documents/dd73d4f00d8a819d10b2fdb70d254f7b/detailed-guidelines-2025.pdf.

[2] Roosevelt, F. Annual Message (Four Freedoms) to Congress, Jan. 1941, available at https://www.archives.gov/milestone-documents/president-franklin-roosevelts-annual-message-to-congress.

[3] United Nations, Universal Declaration of Human Rights, 1948, art. 25, https://www.un.org/en/about-us/universal-declaration-of-human-rights.

[4] Koebel, K. and Stabile, M., Child Benefits in an International Comparative Context, VoxEU.org, Jul. 17, 2024, https://cepr.org/voxeu/columns/child-benefits-international-comparative-context

[5] Center on Budget and Policy Priorities, By the Numbers: Harmful Republican Megabill Favors the Wealthy and Leaves Millions of Working Families Behind. Aug. 1, 2025. https://www.cbpp.org/sites/default/files/6-18-25health-policybrief.pdf

[6] Engel, K. and Posey, K., Household Income in States and Metropolitan Areas: 2023, U.S. Census Bureau American Community Survey Briefs, ACSBR-023, Sept. 2024. https://www2.census.gov/library/publications/2024/demo/acsbr-023.pdf

[7] Compare U.S. Bureau of Economic Analysis, Gross Domestic Product: All Industry Total in New Jersey [NJNGSP], retrieved from FRED, Federal Reserve Bank of St. Louis; https://fred.stlouisfed.org/series/NJNGSP, July 29, 2025 with World Bank Group, GDP (current US$), https://data.worldbank.org/indicator/NY.GDP.MKTP.CD?most_recent_value_desc=true, July 29, 2025.

[8] Prenatal-to-3 Policy Impact Center. Evidence Review: State Earned Income Tax Credit, Oct. 2024, https://pn3policy.org/wp-content/uploads/2024/10/PN3PIC_StateEITC_EvidenceReview_1024.pdf; Prenatal-to-3 Policy Impact Center. State Child Tax Credits: A Promising Policy To Improve Child Outcomes (2025). https://pn3policy.org/wp-content/uploads/2025/04/CTC-brief-3-31-25.pdf

[9] DeYoung, E., Castro, A., Tandon, N., & West, S., Guaranteed Income and Reconstructing Home: Housing, Parenting, and Educational Outcomes in Newark, New Jersey, University of Pennsylvania, Center for Guaranteed Income Research, Jun. 2025, https://upenn.app.box.com/v/CGIR-Report-Newark-NJ-2.

[10] Murphy, P., The State of New Jersey Budget in Brief, Summary of Budget Recommendations Fiscal Year 2026, Feb. 2025, https://www.nj.gov/treasury/omb/publications/26bib/BIB.pdf at 12. The $4.88 billion figure reflects the $4.28 billion budgeted for fiscal year 2026, along with another $600 million for a full year’s Stay NJ payment, as the fiscal year 2026 payment only reflects two quarters of payments.

[11] Duncan GJ, Ziol-Guest KM, Kalil A. Early-childhood poverty and adult attainment, behavior, and health. Child Dev. 2010 Jan-Feb;81(1):306-25. https://pubmed.ncbi.nlm.nih.gov/20331669/

[12] Schmidt, K. et al., Society to cell: How child poverty gets “Under the Skin” to influence child development and lifelong health, Developmental Review vol. 61, Sep. 2021, 100983, https://www.sciencedirect.com/science/article/pii/S0273229721000381

[13] Annie E. Casey Kids Count Data Center. Children in Poverty by Race and Ethnicity in United States: New Jersey. Sept. 2024. https://datacenter.aecf.org/data/tables/44-children-in-poverty-by-race-and-ethnicity?loc=1&loct=2#detailed/2/32/false/2545,1095,2048,1729,37,871,870,573,869,36/187,11,9,12,1,185,13/324,323

[14] National Academies of Sciences, Engineering, and Medicine. (2019). A Roadmap to Reducing Child Poverty. Washington, DC: The National Academies Press. doi: https://doi.org/10.17226/25246. P. 4

[15] Legal Services of New Jersey Policy Research Institute, True Poverty: What It Takes to Avoid Poverty and Deprivation in the Garden State. Jul. 2021. https://proxy.lsnj.org/rcenter/GetPublicDocument/00b5ccde-9b51-48de-abe3-55dd767a685a

[16] Economic Policy Institute. Family Budget Calculator. Accessed July 29, 2025. https://www.epi.org/resources/budget/ (based on Middlesex County, NJ).

[17] Burns, K., Fox, L., and Wilson, D. Expansions to Child Tax Credit Contributed to 46% Decline in Child Poverty Since 2020. U.S. Census Bureau. Sep. 2022. https://www.census.gov/library/stories/2022/09/record-drop-in-child-poverty.html.

[18] Burns, K., Wilson, D., and Fox, L. Two Rounds of Stimulus Payments Lifted 11.7 Million People Out of Poverty During the Pandemic in 2020. U.S. Census Bureau. Sept. 14, 2021. https://www.census.gov/library/stories/2021/09/who-was-lifted-out-of-poverty-by-stimulus-payments.html

[19] DeYoung, E., Castro, A., Tandon, N., & West, S., Guaranteed Income and Reconstructing Home: Housing, Parenting, and Educational Outcomes in Newark, New Jersey, University of Pennsylvania, Center for Guaranteed Income Research, Jun. 2025, https://upenn.app.box.com/v/CGIR-Report-Newark-NJ-2. DeYoung, E., Tandon, N., Neves, C., Castro, A., & West, S. (2023, December). The American Guaranteed Income Studies: Paterson, New Jersey. University of Pennsylvania Center for Guaranteed Income Research. https://static1.squarespace.com/static/5fdc101bc3cfda2dcf0a2244/t/664dea70834dfc74bc8643b6/1716382324073/CGIR%2BFinal%2BReport_Paterson%2BNJ_12.2023.pdf

[20] Akee, R. et al., Parents’ Incomes and Children’s Outcomes: A Quasi-experiment Using Transfer Payments from Casino Profits. American Econ. Journal: Applied Economics 2(1). Jan. 2010. https://www.aeaweb.org/articles?id=10.1257/app.2.1.86; Bruckner, T.A., Bustos, B., Dodge, K.A. et al. Intergenerational effects of a casino-funded family transfer program on educational outcomes in an American Indian community. Nat Commun 15, 8168 (2024). https://doi.org/10.1038/s41467-024-52428-w.

[21] Burnside, A., The SNAP Hot Foods Ban Is Inequitable and Should Be Removed. Center for Law and Social Policy. May 2023. https://www.clasp.org/blog/the-snap-hot-foods-ban-is-inequitable-and-should-be-removed/.

[22] Floyd, I., et al. TANF Policies Reflect Racist Legacy of Cash Assistance. Center on Budget and Policy Priorities. Aug. 2021. https://www.cbpp.org/research/income-security/tanf-policies-reflect-racist-legacy-of-cash-assistance

[23] Tandon, N., West, S., DeYoung, E., Patel, H., Thompson, A., & Castro, A. (2025, June). The

American Guaranteed Income Studies: Newark, New Jersey, Lump-Sum vs. Recurring Cash

Transfers. University of Pennsylvania, Center for Guaranteed Income, https://upenn.app.box.com/v/CGIR-Report-Newark-NJ.


[24] Landry, J. Guaranteed Income In The Wild: Summarizing Evidence From Pilot Studies and

Implications for Policy. Jain Family Institute. Dec. 2024. https://jainfamilyinstitute.org/wp-content/uploads/2024/12/Guaranteed-Income-Pilot-Report-Jack-Landry-12.9.24.pdf pp. 16-17.

[25] Landry, J. Guaranteed Income In The Wild: Summarizing Evidence From Pilot Studies and

Implications for Policy. Jain Family Institute. Dec. 2024. https://jainfamilyinstitute.org/wp-content/uploads/2024/12/Guaranteed-Income-Pilot-Report-Jack-Landry-12.9.24.pdf pp. 12-14.

[26] New Jersey Treasury. Who Must File. May 2025. https://www.nj.gov/treasury/taxation/njit23.shtml

[27] Bergh, K., Nchako, C. and Nuñez, L. Worsening SNAP’s Harsh Work Requirement Would Take Food Assistance Away From Millions of Low-Income People. Center on Budget and Policy Priorities. Apr. 2025. https://www.cbpp.org/research/food-assistance/worsening-snaps-harsh-work-requirement-would-take-food-assistance-away; LaCarte, V., Hinkle, L., and Broberg, B. SNAP Access and Participation in

U.S.-Born and Immigrant Households: A Data Profile. Migration Policy Institute. Mar. 2023. https://www.migrationpolicy.org/research/snap-us-immigrant-households. Castro, R. Promoting Equal Opportunities for Children Living in Poverty. New Jersey Policy Perspective. Apr. 2020. https://www.njpp.org/publications/report/promoting-equal-opportunities-for-children-living-in-poverty/.

[28] Schweitzer, J. How To Address the Administrative Burdens of Accessing the Safety Net. Center for American Progress. May 2022. https://www.americanprogress.org/article/how-to-address-the-administrative-burdens-of-accessing-the-safety-net/.

[29] New Jersey Department of Human Services. Work First New Jersey: Using Your Benefits. Accessed July 29, 2025. https://www.nj.gov/humanservices/wfnj/recipients/benefits/

[30] Tax Policy Center. Briefing Book: How does the earned income tax credit affect poor families? Jan. 2024. https://taxpolicycenter.org/briefing-book/how-does-earned-income-tax-credit-affect-poor-families

[31] New Jersey State Health Assessment Data. Poverty among Children Under Five Years of Age by Race/Ethnicity, New Jersey, 2019-2023. Dec. 2024. https://www-doh.nj.gov/doh-shad/indicator/view/EPHT_LT5_pov.RE.html

[32] Hardy, B., & Hokayem, C. (2024). The Effects of the 2021 Child Tax Credit on Racial and Ethnic Inequalities in Well-Being. The ANNALS of the American Academy of Political and Social Science, 710(1), 157-171. https://doi.org/10.1177/00027162241265791 (Original work published 2023).

[33] New Jersey Reparations Council. For Such A Time As This: The Nowness of Reparations for Black People in New Jersey. Jun. 2025. https://www.njisj.org/print/njrcreport.pdf. Pp. 170-172.

[34] Lee, J., et al., Effects of the Expansion of the Earned Income Tax Credit for Childless Young Adults on Material Wellbeing. NBER Working Paper No. 32571. Jun. 2024. https://www.nber.org/papers/w32571

[35] Murphy, P. The State of New Jersey Budget in Brief, Summary of Budget Recommendations Fiscal Year 2026. Feb. 2025. https://www.nj.gov/treasury/omb/publications/26bib/BIB.pdf pp. 25-26.

[36] Moynihan D., Herd, P., Harvey, H. Administrative Burden: Learning, Psychological, and Compliance Costs of Citizen-State Interactions. Journal of Public Administration Research and Theory, Volume 25, Issue 1, January 2015, Pages 43-69, https://doi.org/10.1093/jopart/muu009. p. 51.

[37] Pub. L. No. 119-21, Sec. 10108 (2025).

[38] Castro, R. Promoting Equal Opportunities for Children Living in Poverty. New Jersey Policy Perspective. Apr. 2020. https://www.njpp.org/publications/report/promoting-equal-opportunities-for-children-living-in-poverty/

[39] U.S. Department of Agriculture, Food and Nutrition Service, Supplemental Nutrition Assistance Program, Program Development Division. State Operations Report 15th Edition. 2023. https://fns-prod.azureedge.us/sites/default/files/resource-files/snap-15th-state-options-report-october23.pdf

[40] Holom-Trundy, B., Understaffed and Underfunded: Barriers to Effective Anti-Poverty Assistance. New Jersey Policy Perspective and Communication Workers of America. Nov. 2024. https://www.njpp.org/wp-content/uploads/2024/11/NJPP-CWA_-Understaffed-and-Underfunded_-Barriers-to-Effective-Anti-Poverty-Assistance-2.pdf

[41] Nguyễn, N. Who Gets Credit? Understanding Family Barriers in Tax Credit Access. New America Foundation New Practice Lab. May 20, 2025. https://www.newamerica.org/new-practice-lab/blog/easier-tax-credits-improves-family-well-being/

[42] Internal Revenue Service. EITC Participation Rate By States: Tax Years 2014 Through 2022. Apr. 9, 2025. https://www.eitc.irs.gov/eitc-central/participation-rate-by-state/eitc-participation-rate-by-states

[43] Herd, Pamela, and Donald Moynihan. 2025. “Administrative Burdens in the Social Safety Net.” Journal of Economic Perspectives 39 (1): 129–50. https://pubs.aeaweb.org/doi/pdf/10.1257/jep.20231394 at 133.

[44] New Jersey Department of Human Services. Medicaid Communication No. 25-03. Feb. 28, 2025. https://www.nj.gov/humanservices/dmahs/info/resources/medicaid/2025/25-03%20Income%20Eligibility%20Standards%20Effective%20January%201,%202025.pdf

[45] New Jersey Department of Human Services. New Jersey FamilyCare Monthly Enrollment Report. Jun. 2025. https://www.nj.gov/humanservices/dmahs/news/reports/enrollment_2025_06.pdf p. 2. Kaiser Family Foundation. Medicaid in New Jersey. May 2025. https://files.kff.org/attachment/fact-sheet-medicaid-state-NJ

[46] Davis, A. State Child Tax Credits and Child Poverty: A 50-State Analysis. Institute on Taxation and Economic Policy. Nov. 16, 2022. https://itep.org/state-child-tax-credits-and-child-poverty-50-state-analysis/. Bureau of Labor Statistics, CPI Inflation Calculator. Accessed July 29, 2025. https://data.bls.gov/cgi-bin/cpicalc.pl?cost1=4400&year1=202211&year2=202506

[47] Bureau of Labor Statistics, CPI Inflation Calculator. Accessed July 29, 2025. https://data.bls.gov/cgi-bin/cpicalc.pl?cost1=3600&year1=202107&year2=202506

[48] Hanna, M. and Shaefer, L. Results from the Maternal Wellbeing Research Study. Rx Kids. https://rxkids.org/impact/research-brief/

[49] National Conference of State Legislatures. Introduction to Benefits Cliffs and Public Assistance Programs. Dec. 27, 2024. https://www.ncsl.org/human-services/introduction-to-benefits-cliffs-and-public-assistance-programs

[50] Parolin, Zachary, Elizabeth Ananat, Sophie Collyer, Megan Curran, and Christopher Wimer. 2023. The effects of the monthly and lump-sum Child Tax Credit Payments on food and housing hardship. American Economic Association Papers and Proceedings, vol. 113: 406-412. doi: 10.1257/pandp.20231088

[51] Economic Security Project & Shriver Center on Poverty Law. Guaranteed Income: States Lead the Way in Reimagining the Social Safety Net. April 2022. https://economicsecurityproject.org/wp-content/uploads/2022/10/States_Lead_the_Way.pdf

[52] Chen, P. Fair and Square: Changing New Jersey’s Tax Code to Promote Equity and Fiscal Responsibility. New Jersey Policy Perspective. Nov. 14, 2024. https://www.njpp.org/publications/report/fair-and-square-changing-new-jerseys-tax-code-to-promote-equity-and-fiscal-responsibility/

[53] Murphy, P., The State of New Jersey Budget in Brief, Summary of Budget Recommendations Fiscal Year 2026, Feb. 2025, https://www.nj.gov/treasury/omb/publications/26bib/BIB.pdf at 12.

[54] State of New Jersey. Tax Expenditure Report Fiscal Year 2026. 2025. https://www.nj.gov/treasury/taxation/pdf/taxexpenditurereport2025.pdf, p. 10.

[55] New Jersey P.L. 2024, c. 49. https://pub.njleg.gov/Bills/2024/PL24/49_.HTM

[56] Ananat, E., and Garfinkel, I. The Potential Long-Run Implications of a Permanently-Expanded Child Tax Credit. NBER Working Paper No. 32870. Aug. 2024. https://www.nber.org/papers/w32870.

[57] New Jersey Laws of 1931, c. 219. Text available at https://njlaw.rutgers.edu/cgi-bin/diglib.cgi?collect=njleg&file=155&page=0530&zoom=120

[58] Hanauer, A. GOP Megabill Breaks America’s Promise to Future Generations. Institute on Taxation and Economic Policy. Jul. 10, 2025. https://itep.org/gop-megabill-breaks-americas-promise-future-generations/

[59] Nikita Biryukov. Here’s how the Democrats running to be governor say they’ll make New Jersey more affordable. New Jersey Monitor. May 29, 2025. https://newjerseymonitor.com/2025/05/29/heres-how-the-democrats-running-to-be-governor-say-theyll-make-new-jersey-more-affordable/; Economic Policy Institute. Family Budget Calculator. Accessed July 29, 2025. https://www.epi.org/resources/budget/ (based on Middlesex County, NJ)

[60] King, M. Where Do We Go From Here: Chaos or Community? 1967. P. 175. https://archive.org/details/82818file/page/n3/mode/1up

[61] Columbia Population Research Center and Center on Poverty and Social Policy at Columbia University. New Jersey: Anchored SPM Poverty Trends 1967-2014. https://povertycenter.columbia.edu/sites/povertycenter.columbia.edu/files/content/Publications/Poverty%20in%20the%2050%20states/New-Jersey-Anchored-SPM-Trends.pdf

Sleepwalking into Catastrophe

Throughout the budget process — from Governor Murphy's proposal to the public hearings to the revenue projections — one major threat loomed over state lawmakers: the federal reconciliation bill’s cuts to Medicaid, food assistance, and other critical programs. Given their public statements opposing these cuts, the state budget should have been an opportunity to build defenses against these cuts, begin raising revenues from wealthy individuals and corporations, and avoid short-term giveaways.

Instead, the budget process went on autopilot. Leaders cut back revenue increases and dipped deeper into the state's cash reserves, as though there would be no federal cuts at all. As has happened in prior years, new expansions in corporate tax credits sailed through committee hearings while the expensive Stay NJ senior homeowner subsidy was preserved without even modest changes to reduce its overall cost to the state. The budget also continued the unfortunate tradition of using dedicated funds to patch one-year budget gaps, including an expanded raid of the Clean Energy Fund to fund both New Jersey Transit’s general operating expenses and the General Fund.

This budget could and should have been a moment of courage — a governor’s final budget, a legislature that has stated its desire to protect the state’s residents from devastating cuts. But instead, the state’s leaders delayed any preparation for federal cuts until after they had already become law. The difficult decisions will not be easier later.

Below is a short summary of NJPP’s budget priorities and their final status in the Appropriations Act.

NJPP FY26 Budget Priority

Was it included in the Governor’s Budget?

Protect the surplus and close the deficit  Partially Included. The projected annual budget shortfall has been reduced from $2.1 billion in the FY 2025 budget bill to $1.5 billion through some tax increases and budget cuts. The budget bill retains cash reserves of nearly $6.8 billion, but still cuts deeper into the reserves to pay basic expenses.
Fully fund pensions
and schools
 Yes. The governor and legislature continued the state’s commitment to fully funding pensions and the K-12 school funding formula.
Raise revenues to balance
the budget
 Partially Included. The final state budget does include increases in revenue, including the increase in fees on property sales over $2 million and increased taxes on online gambling. However, these increases raise less money than the governor’s original proposals, leading to the budget drawing more heavily on cash reserves.
Maintain StayNJ’s guardrails, specifically the original spending rules that require a healthy budget surplus  No. StayNJ, an expensive subsidy program that disproportionately benefits wealthy senior homeowners, requires a 12 percent surplus target before payments can go out. This budget continues to fund StayNJ and assumes payments will go out in 2026, even though the surplus is now well below 12 percent.
Maintain funding for services for immigrants  Yes. Thankfully, the proposal preserves funding levels for programs such as Cover All Kids, which provides health insurance for children regardless of immigration status, and legal services for immigrant adults and children. The budget also doubles funding for the Office of New Americans, which connects immigrants to services for which they or their families may be eligible.
Expand and improve
tax credits for working
families
 No. Unfortunately, the final budget included no expansion of the Child Tax Credit or Earned Income Tax Credit to help working families afford the increasing cost of living in the state.
Increase benefits in WorkFirst NJ to reduce poverty  No. Similarly, there was no expansion of the benefit amount for WorkFirst NJ, which provides cash assistance to low-income households.
Expand affordable health insurance options  Partially Included. As noted above, the budget continued to fund Cover All Kids, dedicating $165 million to the program to keep pace with enrollment. However, there were no other proposals to expand access or eligibility to state-funded health insurance programs.
Keep the Corporate Transit
Fee funding transit
 Yes. Corporate Transit Fee funds were directed only to New Jersey Transit and not to the general fund or footing the bill for other programs.
Use the Clean Energy Fund
only for clean energy projects
 No. In fact, lawmakers expanded the raids on the Clean Energy Fund to over $190m to be used for basic New Jersey Transit operations and to the General Fund.
End predatory prison communication fees  No. The budget did not include any funding to reduce or eliminate the cost of prison communication fees, leaving families to bear the $15 million burden of communicating with their incarcerated loved ones.

All citations to the Appropriations Act (A-5800/S-2026) and Scoresheet unless otherwise indicated.

To learn more about policy solutions that NJPP recommends to build a more equitable state, read Blueprint for a Strong and Resilient New Jersey.


Course Correction: Preserving Senior Housing Affordability While Cutting Costs

Every New Jerseyan deserves to age with dignity, stability, and the ability to remain in their community — no matter their income or housing status. The state has a responsibility to ensure that people aged 65 and over on fixed incomes aren’t pushed out of their homes simply because they can’t afford their housing costs. At the same time, New Jersey must steward its public dollars wisely, prioritizing investments that advance equity and support those most in need.

Unfortunately, the much-discussed Stay NJ proposal to subsidize senior homeowners disproportionately benefits wealthy homeowners, fails to assist senior renters, and costs the state more than a billion dollars annually, with no new revenue source.[1]

This report offers a course correction for policymakers to preserve the intent of Stay NJ to keep senior residents in their homes by focusing resources on those who need help the most and improving the sustainability of the program. The report models the following proposed changes to the program:

  1. Lower income limits and maximum benefit amounts to focus the program on low- and moderate-income senior households.
  2. Double the existing senior renter tax credit for seniors from $700 to $1,400.

By refocusing the program on those most likely to experience housing insecurity and adjusting benefit levels for wealthier households, New Jersey can deliver targeted relief without exceeding its budget capacity. The state can also correct for the exclusion of senior renters from Stay NJ, who are much more likely to suffer from housing insecurity and high housing cost burdens than homeowners.[2]

Untangling NJ’s Property Tax Credits

New Jersey has multiple, often-overlapping, property tax benefit programs, but this report focuses on two:

  • Affordable New Jersey Communities for Homeowners and Renters (ANCHOR) provides homeowners and renters with set property tax credits, ranging from $450 to $1,500, depending on age and an income cap of $150,000.
  • Stay NJ is a new program that will provide homeowners aged 65 and above with a property tax credit worth 50 percent of their property tax bill up to $6,500, with an income cap of $500,000. Stay NJ is scheduled to begin paying out benefits in February 2026.[3]

For more information on these programs, see the New Jersey Division of Taxation website: https://www.nj.gov/treasury/taxation/relief.shtml.

Congress seems poised to provide significant tax breaks to the wealthiest in the country, which could substantially decrease revenue in New Jersey.[4] Meanwhile, many of the proposed federal budget cuts will harm our low-income neighbors in the state. For New Jersey to be a place where everyone can thrive, policymakers must make budget decisions that support households most in need and reduce spending on the already-wealthy, many of whom will likely benefit from the federal tax cuts.

Accordingly, New Jersey Policy Perspective recommends two targeted reforms to better align Stay NJ with the state’s fiscal and equity goals.

Proposal 1: Lower income limits and maximum benefit amounts, focusing on low- and moderate-income senior households

Two modest adjustments to the program’s design would substantially reduce its cost while ensuring that benefits reach low- and middle-income households:

  • Reduce the maximum eligible income to $150,000 from $500,000, consistent with the ANCHOR property tax relief program.[5] This prevents the government from subsidizing the top 20 percent of household incomes with hundreds of millions of dollars.
  • Lower the maximum benefit from $6,500 to $5,000.[6] This puts the benefit more in line with the state’s average property tax bill and prevents the state from subsidizing higher-value homes, which tend to have higher property tax bills.


These two changes would cut the cost of Stay NJ by $520 million, nearly half its
projected cost.[7]

Importantly, by focusing on reducing the subsidy for wealthier homeowners, this proposal achieves 70 percent of its cost savings by reducing state subsidies going to residents in the top 20 percent of incomes.

Changes to Stay NJ Can Lower State Costs

These reforms would preserve most of the benefits for moderate-income households while phasing out subsidies for higher-income homeowners. However, because benefits are based on a percentage of property tax amounts, which correlate with home values, benefits would still skew toward those with higher property wealth.[8]

These examples illustrate how this proposal would affect different households.

Proposed Stay NJ Changes Focus Benefit on Middle- and Low-Income Households

Under the proposal, Henrietta, a low-income senior with modest property taxes, would see no change in her final tax bill. Isaiah and Jonas, with a higher income and above-average property taxes, would receive a reduced but still substantial benefit. Meanwhile, Kevin and Liza, who have a high income and substantial property wealth, would no longer qualify for a Stay NJ benefit.

Proposal 2: Double the ANCHOR renter benefit for seniors from $700 to $1,400

The current Stay NJ program only benefits people aged 65 and over who own their homes. This restriction of benefits to homeowners is not necessary. Other state property tax benefit programs do provide senior renters benefits: for example, renters aged 65 and older can receive enhanced ANCHOR benefits of $700, a modest increase from the $450 benefit available to renters under age 65.

Senior renters face serious housing insecurity challenges, putting them at higher risk of housing insecurity than senior homeowners. More than 1 in 4 seniors in New Jersey rent but would receive no new benefit from Stay NJ, including over half of Hispanic/Latinx and Black seniors.[10] Nationally, the poverty rate is twice as high for senior renters as for senior homeowners.[11] Renters also have significantly less wealth than their home-owning peers,[12] and nearly 1 in 4 senior renters in New Jersey report it is “very likely” they will lose their home to eviction.[13] However, because StayNJ excludes renters, who represent a substantial percentage of New Jersey’s senior population facing housing insecurity, the proposal fails to support the very people most at risk of losing their homes.

Despite this financial pressure and housing insecurity, Stay NJ limits renters to the $700 ANCHOR benefit, compared to the $6,500 maximum benefit available to homeowners.

At a cost of roughly one-tenth of the entire program ($149 million), doubling the ANCHOR benefit would provide targeted support to low- and moderate-income renters, with nearly 70 percent of the benefits going to households with an annual income of less than $62,000.

Conclusion: A Responsible Path Forward

With the state still facing a $1 billion structural deficit and a shrinking surplus,[14] state policymakers should exercise prudence regarding new spending programs. As New Jersey contends with the possibility of a recession and cuts in federal funding, it must ensure that state funding is directed toward residents who need it most — not to already-wealthy households.

These recommendations offer policymakers a way to refine Stay NJ without abandoning its core intent. While they don’t fix the program’s underlying design flaws, they make it more equitable and fiscally responsible by reducing costs and targeting relief to the seniors most at risk of losing their homes — especially renters, who currently receive the least support. In a challenging fiscal environment, this is a practical and balanced way to preserve the program’s goals.


End Notes

[1] Testimony of Peter Chen, Senior Policy Analyst, New Jersey Policy Perspective, Before Stay NJ Task Force, March 13, 2024, https://www.njpp.org/wp-content/uploads/2024/05/NJPP-StayNJ-Committee-Testimony-03-13-24.pdf

[2] Joint Center for Housing Studies of Harvard University, Housing America’s Older Adults 2023 (2023), p. 16, https://www.jchs.harvard.edu/sites/default/files/reports/files/Harvard_JCHS_Housing_Americas_Older_Adults_2023_Revised_040424.pdf

[3] N.J. Stat. Sec. 54:4-8.75e5.a.(1) (2025).

[4] Lilo H. Stainton, What GOP’s Medicaid Cuts Could Cost NJ, New Jersey Spotlight News, May 20, 2025, https://www.njspotlightnews.org/2025/05/nj-calculates-massive-cost-of-republican-led-medicaid-cuts/

[5] N.J. Stat. Sec. 54:4-8.75b2. For the ANCHOR eligibility threshold, see N.J. Stat. Sec. 54:4-8.61a.

[6] N.J. Stat. Sec. 54:4-8.75c.

[7] NJPP analysis of tax modeling from Institute on Taxation and Economic Policy, 2025.

[8] Testimony of Peter Chen, Senior Policy Analyst, New Jersey Policy Perspective, Before Stay NJ Task Force, March 13, 2024, https://www.njpp.org/wp-content/uploads/2024/05/NJPP-StayNJ-Committee-Testimony-03-13-24.pdf

[9] New Jersey Department of Community Affairs, 2024 Property Tax Information: Municipal Tax Summary (2025) https://www.nj.gov/dca/dlgs/resources/Property_Tax/24_data/24taxes.xls.

[10] U.S. Census Bureau, U.S. Department of Commerce. “Tenure by Age of Householder.” American Community Survey, ACS 1-Year Estimates Detailed Tables, Table B25007, 2023, https://data.census.gov/table/ACSDT1Y2023.B25007?q=age+tenure&g=040XX00US34. Accessed on May 15, 2025.

[11] Diane Elliott, More Than Shelter: How Housing Affordability Is Linked to Older Americans’ Health, Population Reference Bureau, April 9, 2024, https://www.prb.org/articles/more-than-shelter-how-housing-affordability-is-linked-to-older-americans-health/

[12] Jung Hyun Choi, Amalie Zinn, The Wealth Gap Between Homeowners and Renters Has Reached a Historic High, Urban Institute, April 29, 2024, https://www.urban.org/urban-wire/wealth-gap-between-homeowners-and-renters-has-reached-historic-high

[13] U.S. Census Bureau, Household Pulse Survey, Cycle 09, Housing Table 3b. Likelihood of Having to Leave this House in Next Two Months Due to Eviction, by Select Characteristics: New Jersey, Oct. 3, 2024, https://www2.census.gov/programs-surveys/demo/tables/hhp/2024/cycle09/housing3b_cycle09.xlsx.

[14] Nikita Biryukov, Budget experts tell lawmakers revenue projections are up, but there’s no windfall, New Jersey Monitor, May 14, 2025, https://newjerseymonitor.com/2025/05/14/budget-experts-tell-lawmakers-revenue-projections-are-up-but-theres-no-windfall/

The Economic and Fiscal Impacts of Mass Deportation: What’s at Risk in New Jersey

This report was co-authored by David Dyssegaard Kallick, Director of the Immigration Research Initiative and Shamier Settle, Senior Policy Analyst at the Immigration Research Initiative.

The Trump Administration has intensified efforts to deport immigrants, seeking to remove them from their communities across the country. In addition to causing serious social and humanitarian harm, these deportation efforts pose significant and quantifiable economic risks to New Jersey. 

Deporting Immigrants Will Cost New Jersey State and Local Governments

New Jersey is home to approximately 2.3 million immigrants, nearly one in four residents, who contribute significantly to the state’s economic vitality and community life. Of these residents, about 993,000 are non-citizens,[1] including an estimated 475,000 who are undocumented.[2] Despite their integral roles in society and the economy, these residents face increasing threats from intensified immigration enforcement. The potential economic and humanitarian costs of mass deportations are profound.

  • In 2022, people who are undocumented paid an estimated $1.3 billion in New Jersey state and local taxes.[3]
  • Deporting 475,000 people who are undocumented from New Jersey poses enormous logistical challenges. Even if just one in ten undocumented individuals were deported or placed into detention, it would lead to a loss of $133 million in state and local tax revenue each year. This is the cost of 295,000 free school meals in New Jersey public schools.[4]
  • These projected impacts underestimate the actual loss since they do not include the disruption to businesses and communities from conducting raids, the harm to families who lose a breadwinner, and the costs to the foster care system when children lose their parents.
  • Since people who are undocumented are excluded from many public benefits, there will be minimal state and local cost savings from deportation. However, there will be new costs to state and local governments associated with deportation and detention.


Rescinding Status and Restricting Immigration Will Hurt the New Jersey Economy

New Jersey stands to face significant losses as the Trump Administration revokes temporary status for immigrants, drastically alters asylum policies, and shuts down refugee resettlement. These changes threaten to destabilize communities, shrink the workforce, and weaken key sectors of the state’s economy.

  • An estimated 13,000 active DACA (Deferred Action for Childhood Arrivals) recipients are at risk in New Jersey.[5] These individuals arrived in the U.S. as children and have lived their entire lives here. While DACA allows them to work legally, they live in limbo — contributing to the economy without a path to permanent status and now in fear of deportation.
  • Temporary work visa programs are also threatened, including H-1B visas for highly skilled workers and H-2A visas for seasonal agricultural labor. Eliminating these programs without reforms or alternatives would leave many New Jersey employers — especially in agriculture, tech, and health care — struggling to fill essential roles.


Where New Jersey’s Economy and Daily Life Are Most at Risk

Mass deportation generates widespread fear and presents unpredictable threats to the New Jersey economy. In New Jersey, the deportation of 475,000 undocumented immigrants would result in the loss of approximately 42,000 jobs held by U.S.-born workers.[6]

  • A loss of large numbers of workers from the labor force would mean an increase in the cost of living for New Jerseyans who will pay more for restaurants, child care, home health aides, construction, and more. Because immigrants are often underpaid, there will be a significant shortage of workers and costs will rise.
  • A labor supply shortage will force businesses to shrink an already tight labor market. In March 2025, the unemployment rate was relatively low at 4.7 percent, meaning employers are already struggling to find workers.[7] Removing workers from the labor force will worsen this problem.
  • Deporting undocumented workers would result in a decline in the number of jobs for U.S.-born workers.[8] This happens for several reasons:
    • Lower consumer demand: When immigrants leave, their spending disappears, reducing demand for local goods and services.
    • Fewer complementary workers: Fewer cooks and dishwashers mean fewer waiter jobs and fewer construction laborers mean fewer construction managers.
    • Decline in care workers: With fewer caregivers available, young parents may struggle to work, leading to lower overall labor force participation.


Several sectors of New Jersey’s economy are particularly vulnerable to immigration rollbacks and mass deportation policies, including:

Restaurants: Restaurants heavily depend on immigrant labor, particularly in critical roles like food preparation and sanitation. In New Jersey, 48 percent of the cooks are immigrants. The loss of these workers would create severe staffing shortages, force closures or reduce operations in restaurants, and negatively impact other roles, such as servers and managers. Central to local economies and community social life, the restaurant industry would experience rising costs and diminished service capacity.

Personal, home, and office: Personal service roles — including janitors, landscapers, nail technicians, and housekeeping staff —are predominantly filled by immigrant workers.[9] In New Jersey, immigrants represent 46 percent of janitorial staff and 74 percent of housekeeping personnel. Mass deportations would lead to acute labor shortages in these often underrecognized positions, affecting both households and commercial establishments. Consequently, costs for such services would increase, impacting family budgets and businesses statewide.

Construction: The construction sector employs approximately 112,000 immigrants in New Jersey, representing 36 percent of the industry’s workforce.[10] A significant reduction of immigrant workers in construction would exacerbate labor shortages, raise construction costs, and dramatically increase costs at a time when New Jersey faces a crisis in housing availability and affordability.

Farming: Immigrants make up over half of all U.S. crop workers, with most either undocumented or seasonal H-2A workers,[11] both groups now at risk under the new administration’s policies. New Jersey’s agricultural sector — known for its nursery stock, cranberries, vegetables, and other exports—plays a key role in rural economies and agritourism. Even a 5 to 10 percent reduction in immigrant labor would lead to food shortages, higher food prices for families, and unsustainable labor costs for farmers.

New Jersey’s Economy Needs Our Immigrant Friends and Neighbors

Immigrant workers are a vital part of our workforce and a valuable part of New Jersey’s culture and community. They support our daily lives, provide jobs, and strengthen our state economy. There are policies that can make their lives better and enhance their contribution to our communities.

  • Make it possible for people who are undocumented to gain legal status, which would increase state and local tax revenues by $332.5 million.[12]
  • Improve the visa programs since they leave workers vulnerable to exploitation and can have adverse impacts on other workers.
  • Implement stronger labor protections and increase wages for domestic and farm workers.


The presidential administration might try to deceive the public by claiming that deporting immigrants will benefit the economy, but the facts speak louder: immigrants are vital to the prosperity, stability, and success of New Jersey and its residents.

Citation: David Kallick, Shamier Settle, and Marleina Ubel, May 2025, The Economic and Fiscal Impacts of Mass Deportation: What’s at Risk in New Jersey

About the Authors

David Dyssegaard Kallick is the Director of Immigration Research Initiative.

Shamier Settle is a Senior Policy Analyst at Immigration Research Initiative.

Marleina Ubel is a Senior Policy Analyst at New Jersey Policy Perspective.

The authors would like to thank Emily Eisner, Andrew Perry, and Nathan Gusdorf of the Fiscal Policy Institute, who, with David Dyssegaard Kallick, co-authored a similar report in New York State that was jointly published by the Fiscal Policy Institute and the Immigration Research Initiative.


End Notes 

[1] Non-citizens refer to individuals who are not U.S. citizens, including green card holders, undocumented people, and those at risk of losing their immigration status. This group also includes individuals eligible for Temporary Protected Status (TPS), DACA recipients, H1-B and H2-A visa holders, asylum seekers, and others facing potential deportation or status removal.

[2] For the number of immigrants, non-citizen immigrants, and the estimate of immigrants who are undocumented, see the Immigration Research Initiative fact sheet, “50 States: Immigrants by Number and Share.” The number of immigrants and non-citizen immigrants is an IRI analysis of the 2023 ACS. The number of immigrants who are undocumented is estimated by the Pew Research Center based on the 2022 ACS. The fact sheet gives parallel estimates from the Center for Migration Studies (2022 ACS) and the Migration Policy Institute (2019 5-year data).

[3] Davis, et al. “Tax Payments by Undocumented Immigrants,” Institute on Taxation and Economic Policy, July 30, 2024. https://itep.org/undocumented-immigrants-taxes-2024/

[4] Using high rate and total federal and state reimbursement rates, which estimate $4.52 per lunch. https://www-agr.state.nj.us/AG_SNEARS2/api/resourcesManagement/download?id=2863

[5] “Deferred Action for Childhood Arrivals (DACA) Data Tools,” Migration Policy Institute. https://www.migrationptpstolicy.org/programs/data-hub/deferred-action-childhood-arrivals-daca-profiles

[6] East, et al. “The Labor Market Effects of Immigration Enforcement,” Journal of Labor Economics, vol 41, number 4. This work is summarized in an accessible fashion by Chloe N. East in “The Labor Market Impact of Deportations,” The Hamilton Project, Sept. 18, 2024. The study finds that for every 500,000 people deported, 44,000 U.S.-born people lose their jobs. We are rounding to the nearest thousand.

[7] U.S. Bureau of Labor Statistics, Unemployment Rates for States, https://www.bls.gov/web/laus/laumstrk.htm

[8] East, et al. “The Labor Market Effects of Immigration Enforcement,” Journal of Labor Economics, vol 41, number 4. This work is summarized in an accessible fashion by Chloe N. East in “The Labor Market Impact of Deportations,” The Hamilton Project, Sept. 18, 2024. The study finds that for every 500,000 people deported, 44,000 U.S.-born people lose their jobs. We are rounding to the nearest thousand.

[9] Nail technicians include manicurists and pedicurists.

[10] The occupation “painters” also includes paperhangers.

[11] Gutiérrez-Li, Alejandro. “Feeding America: How Immigrants Sustain US Agriculture,” Baker Institute for Public Policy, July 19, 2024. https://www.bakerinstitute.org/research/feeding-america-how-immigrants-sustain-us-agriculture

[12] Davis, et al. “Tax Payments by Undocumented Immigrants,” Institute on Taxation and Economic Policy, July 30, 2024. https://itep.org/undocumented-immigrants-taxes-2024/

New Jersey Pensions Are the Least Generous in the U.S. For New Teachers

Every child deserves a high-quality education, and every teacher who dedicates their career to this mission deserves financial security in retirement. Yet, in New Jersey, new teachers are getting a raw deal. As the state struggles with a growing teacher shortage, one major barrier to recruitment and retention is compensation — not just salaries, but also retirement benefits.

Compared to states with similar pension programs, New Jersey’s retirement benefits for newly hired teachers are the least generous in the nation. Among the 38 states with defined benefit pension plans for public school teachers, New Jersey ranks dead last. This is largely due to a combination of policy choices: a low “benefit factor” (the percentage of salary that accrues toward a pension each year), a high retirement age, a long vesting period, a lengthy average salary calculation period, and the absence of cost-of-living adjustments.

These shortfalls stem from policy changes made in 2011 through Chapter 78, which created a new pension tier (Tier 5) for teachers hired after that year. These changes raised contribution rates, increased the retirement age, and cut the value of benefits — leaving today’s teachers with the weakest defined benefit pension plans in the country.

If New Jersey wants to attract and retain the highly qualified, diverse educator workforce that students deserve, the state must reform its pension system. Eliminating Tier 5 and restoring fairer benefits would bring the state closer in line with national standards and help ensure that the teachers shaping our future can retire with dignity.

Background

Like many other states, New Jersey is facing a teacher shortage.[1] As the New Jersey Policy Perspective (NJPP) has reported, the state now enrolls significantly fewer teacher candidates in preparation programs than it did a decade ago, signaling an alarming trend in the educator pipeline.[2] Compensation remains a major obstacle to attracting and retaining teachers, with research consistently showing that lower pay and weaker benefits reduce recruitment and retention.[3]

Teacher Retirement Plan Types

·    Defined Benefit: Employees contribute a percentage of their income throughout their careers and receive a guaranteed benefit upon retirement. Defined benefit plans are what are typically thought of as “pensions.”

·    Defined Contribution: Both employees and employers contribute to the plan, but the retirement benefit is not predetermined. Instead, the final amount depends on contributions and investment performance. These plans function similarly to 401(k)s in the private sector.

·    Hybrid: Plans that combine elements of both defined benefit and defined contribution plans. Hybrid plans often have a defined benefit component that requires relatively smaller contributions than full defined benefit plans, but also have a smaller benefit factor.

Strong retirement benefits can help offset lower salaries by increasing overall compensation; however, New Jersey’s pension system has moved in the opposite direction. Over the last decade, teachers have paid more into their pensions while receiving less in return.

Chapter 78, passed in 2011, not only increased employee contribution rates to record highs but also created a new pension tier, “Tier 5,” for teachers hired after June 2011. [4] Compared to earlier tiers, Tier 5 raised the normal retirement age and lowered the benefit factor — the amount a pension grows with each year of service as a percentage of a teacher’s final salary. As a result, Chapter 78 hits new teachers the hardest, just as the state needs more qualified workers to consider entering and staying in the profession.

In 2017, NJPP published a report quantifying the damage caused by Chapter 78, finding that New Jersey’s pensions were already among the least generous in the country. [5]  This updated analysis, using refined methods and the most recent data, finds that little has changed. Without action to address the state’s inadequate retirement benefits for new teachers, New Jersey will continue to struggle to attract and retain the high-quality educators its students deserve.

Ranking Pension Generosity

Retirement programs for teachers vary widely between states, making direct comparisons complex. However, there are various factors many plans have in common. This report compares these factors and ranks their relative value for plan members. It then weighs each factor and averages a state’s rank to arrive at a final grade. Further details can be found in the Appendix.

There are three main types of teacher pensions: defined benefit, defined contribution, and hybrid (see box above). Figure 1 shows that most teacher retirement plans for recent members are defined benefit plans, although several states have moved to hybrid plans. Since defined contribution plans introduce market variables that complicate direct comparisons, this analysis focuses exclusively on the 38 states with defined benefit plans, including New Jersey.

New Jersey Has a "Defined Benefit" Pension Plan For Teachers Like Most States

Defined benefit plans have six major factors in common that affect their generosity:

  1. Benefit Factor: The percentage of a salary accrued annually toward the pension and the key factor of a pension’s payout (see below).
  2. Contribution Rate: The percentage of a salary that must be contributed.
  3. Average Salary Determination: The salary used to calculate benefits.
  4. Vesting Period: The number of years required before pension benefits are guaranteed.
  5. Normal Retirement Age: The earliest age at which a teacher can receive benefits without penalty.
  6. Cost of Living Allowance (COLA): The increases to the benefit to account for inflation.


Since the benefit factor and contribution rate directly affect a teacher’s benefits, they are weighted twice as heavily as the other four factors when determining a final grade.

Findings

Benefit Factor

Pension benefits follow a basic formula to determine a benefit:

Benefit Factor x Years Employed x Average Salary Determination = Benefit[6]

The benefit factor — sometimes called the retirement multiplier — is the percentage of an employee’s average salary they receive as a pension benefit for every year employed. For example, a teacher who works for 30 years and has a final average salary of $100,000 would receive a pension plan of $30,000 with a benefit factor of 1.0:

1.0 (benefit factor, divided by 100) x 30 (years) x $100,000 (salary) = $30,000

With a benefit factor of 2.0, their pension benefit would double:

2.0 (benefit factor, divided by 100) x 30 (years) x $100,000 (salary) = $60,000

A higher benefit factor means a larger pension benefit. Relative to other states, New Jersey’s benefit factor for new teachers is quite small — ranking sixth lowest among the 38 states with a 1.67 benefit factor.[7]

New Jersey's Pension Benefit Factor is Among the Lowest in the Nation

Contribution Rate

Teachers’ pensions have two funding sources: employer contributions from state or local revenues and employee contributions from teachers’ paychecks. Higher contribution rates mean that teachers pay more for their pensions. At 7.5 percent, New Jersey’s contribution rate ranks in the middle at 18th out of 38.

New Jersey's Teacher Pension Contribution Rate is Typical

Average Salary Determination

Pension benefits are calculated as a percentage of a teacher’s average salary. The average is based on some number of years when the teacher’s salary was highest. Because most teachers earn more at the end of their careers, and because their salary goes up each year, an average salary determination based on fewer years leads to a higher benefit than a salary based on more years.

As an example: A teacher in 2020 makes $80,000, and her salary increases by 2 percent each year. The average of her last five years is $83,265; however, the average of her last three years is $84,908. A pension based on a three-year average is, therefore, larger than a pension based on a five-year average. In other words, more generous pensions have average salary determinations based on smaller numbers of years.

Average Salary Determinations based on fewers years lead to better pensions: An example.

Currently, New Jersey uses five years to determine the average salary, which puts our state tied with 20 other states in terms of average salary determination. Fifteen states use a lower number of years, and two use a higher number of years.

New Jersey Has a Longer Than Average Salary Determination Period Than Most States

Vesting Period

The vesting period is the length of time a member must work before being guaranteed a pension benefit. New Jersey, like eight other states, requires ten years of service to become vested.

New Jersey's Teachers Take the Longest to Vest in Their Pension Than Other States

Normal Retirement Age

While pension systems can offer options for early retirement, there is usually a penalty for doing so. Normal retirement age is when a member can receive their full pension benefit. While some states have simple age and work years requirements, others use more complex formulas that change the normal retirement age based on when a member started work. For simplicity’s sake, this report gives the normal retirement age for each state, assuming that a teacher entered the state’s retirement plan at age 25.

In this report’s sample of 38 states, the normal retirement age for new teachers ranges from 53 to 67. At 65, novice teachers in New Jersey have one of the highest normal retirement ages in the country.

New Jersey Has One of the Highest Average Retirement Ages

Cost of Living Allowance

Most states offer some increase in benefits for retirees to offset the effects of inflation. The terms of these cost-of-living allowances (COLAs) vary widely. To simplify things, this report examined two factors: 1) whether or not there is a COLA and 2) whether the COLA is automatic or “ad hoc,” meaning it is only granted when some governing body allows it. New Jersey is only one of four states that has no COLA.

New Jersey is One of Four States Where Defined Benefit Teachers Pensions Have No Cost of Living Allowances

Overall Grade

New Jersey Among the Least Generous Pensions in the Nation For New Teachers

Compared to states with similar retirement plans, New Jersey has the least generous pensions for new teachers in the nation, earning an overall grade of “F.” The state’s low benefit factor, lengthy vesting period, high normal retirement age, lack of a COLA, and high average salary determination period all combine to make New Jersey’s pension for new teachers the stingiest in the nation. See Appendix for more information on the methodology for scoring and letter grades.

In some states, Social Security benefits are not available to teachers; in these cases, teachers do not pay FICA taxes, which is a U.S. federal payroll tax. While the overall grade in this report is not affected by a state’s Social Security status, the information is included in the Appendix. Even if all states that did not participate in Social Security for teachers were excluded from this analysis, New Jersey would still rank last in pension generosity. The role of Social Security in teacher retirement is discussed further in the Supplement.

Recommendations and Conclusion

In 2016, then-Governor Chris Christie claimed that New Jersey teachers had “gold-plated pensions.”[8] However, as NJPP pointed out in 2017,[9] that was simply not true when compared to other states. Teachers’ pensions in New Jersey were some of the least generous in the nation.

Today, new teachers in New Jersey’s pension system continue to face significant disadvantages. They suffer from a low benefit factor, a mediocre contribution rate, a high salary determination and retirement age, and no COLA. By any standard, New Jersey’s newest teachers get a worse deal on their retirement benefits than their colleagues in other states. This inequity is particularly concerning considering that three-quarters of teachers in the state are women — further exacerbating the gender pay gap.[10] A fair pension system is not just about financial security in retirement; it is about recognizing and respecting educators for their service.

To fix this, policymakers must act now to restore fairness in New Jersey’s teacher pension system. The most effective solution is to eliminate Tier 5 and extend more equitable benefits to all teachers. This change would bring New Jersey’s pension system closer to national standards, making the profession more attractive to new educators while ensuring that long-serving teachers can retire with dignity. However, simply eliminating Tier 5 and transitioning all teachers to Tier 1 would not fully align New Jersey with more generous pension systems in other states. While it would mark significant progress, many states would still provide more generous benefits than New Jersey. (See supplement for methodology.)

Governor Murphy’s administration has helped New Jersey make great strides toward meeting its long overdue pension obligations.[11] But if the state wants to recruit and retain well-educated workers into its schools, it must stop using the excuse of previous underfunding to justify inadequate teacher pension benefits. Eliminating Tier 5 is a reasonable step toward pension fairness for the people who educate our children and shape New Jersey’s future.

Appendix: Data and Methods

Data

Data for this report come from the National Association of State Retirement Administrators (NASRA), the foremost authority on public pensions. Data were extracted from these documents:


As a data check, NASRA’s data was compared to a report recently issued by the Wisconsin Legislative Council in 2024.[12] When the two data sources conflicted, the author went to the state in question’s website and used the information provided.

Methodology

The sample used is restricted to states with defined benefit retirement plans for teachers. States were ranked in all six metrics (ties were ranked at the mean of the states’ ranks). The final score is the average (mean) of the ranks, with the benefit factor and contribution rate ranks weighted twice as much as the others.

New Jersey Has the Least Generous Teacher Pensions for New hires in the Nation

For the letter grades, the author converted the rank means into standard deviations and assigned grades based on this distribution.

Standard deviations table

Supplement: Modeling Pension Generosity

While retirement age, COLAs, vesting periods, and average salary determination are important measures of a pension’s generosity, arguably the two most important factors are the benefit factor and the contribution rate. The first directly affects the value of the pension benefit, and the second determines how much an employee pays to get that benefit.

Logically, members would expect that the more they pay into a pension, the more they would get out of it. In other words, states with higher contribution rates should have, on average, higher benefit factors. The figure below shows a significant correlation (r-sq = 0.38) between the benefit factor and contribution rate.

But the correlation is hardly perfect. Some states have higher benefit factors than their contribution rates would predict, and some have lower. New Jersey, for example, has a slightly higher contribution rate (7.5%) than Arkansas (7.0%). However, Arkansas’s benefit factor (2.15) is much higher than New Jersey’s (1.67). Arkansas teachers enjoy a more generous pension multiplier than New Jersey teachers, even though they contribute a smaller portion of their income.

The amount that the benefit factor is above or below what the contribution rate predicts is the “value-added” of that state’s pension: the amount more or less than predicted, based on other states’ pensions, that a member receives in benefits based on what they contributed. Teachers in states with a higher value-added amount enjoy more generous pensions as evaluated by these two critical factors; teachers in lower value-added states have less generous pensions.

Benefit Factor Vs. Contribution Rate for Teacher Pensions

The figure above also shows that states that do not offer Social Security benefits for their teachers (the green markers) tend to have higher value-added amounts. They sit higher above the trendline, which is the model’s prediction of the benefit factor given the contribution rate. To put it more simply, states do not have to pay the employer’s share of Social Security taxes on behalf of their teachers and may use those funds to increase the benefit factor.

To account for this, the author runs a regression model with Social Security as a factor variable. The estimates are below; the model allows us to calculate the predicted benefit factor for each state and compare it to the actual benefit factor (resulting in the residual).

Dependent Variable: Benefit Factor, New Hires

Using this model, New Jersey’s predicted benefit factor is 1.88. Its actual benefit factor for Tier 5, as discussed above, is 1.67, and its benefit factor for Tier 1 is 1.82. While the Tier 1 benefit factor is still below the prediction, it is much closer than Tier 5. Raising the Tier 5 benefit factor to Tier 1’s would go a long way toward making New Jersey’s pension benefits for new teachers more like those in other states.

Disclosure

Mark Weber is the Special Analyst for Education Policy at the New Jersey Policy Perspective, and a Lecturer in education policy and law at Rutgers University, New Brunswick. Weber is also a teacher in the Warren Township Schools, Somerset Country; as such, he is a member of the New Jersey Teachers’ Pension and Annuity Fund (TPAF). Weber is in Tier 1; the recommendations in this report would not affect his retirement benefits.


End Notes

[1] Nikita Biryukov (September 3, 2024). “New Jersey districts still face teacher shortages as new school year begins.” New Jersey Monitor. https://newjerseymonitor.com/2024/09/03/new-jersey-districts-still-face-teacher-shortages-as-new-school-year-begins/

[2] Weber, M. (2022). New Jersey’s Teacher Pipeline: The Decline in Teacher Candidates Continues. https://www.njpp.org/publications/report/new-jerseys-teacher-pipeline-the-decline-in-teacher-candidates-continues/

[3] Allegretto, S. (September 12, 2024). Teacher pay rises in 2023—but not enough to shrink pay gap with other college graduates. Economic Policy Institute. https://www.epi.org/publication/teacher-pay-in-2023/
Weber, M. (September, 2019). In Brief: New Jersey’s Teacher Workforce, 2019; Diversity Lags, Wage Gap Persists. New Jersey Policy Perspective. https://www.njpp.org/wp-content/uploads/2019/09/NJPP-In-Brief-Teacher-Workforce-Report-Final.pdf

Kemper Patrick, S. & Carver-Thomas, D. (2022). Teacher Salaries: A Key Factor in Recruitment and Retention.  Learning Policy Institute. https://learningpolicyinstitute.org/blog/teacher-salaries-key-factor-recruitment-and-retention

Steiner, E., Woo, A., Doan, S. (November 20, 2024). Larger Pay Increases and Adequate Benefits Could Improve Teacher Retention. RAND Corporation. https://www.rand.org/pubs/research_reports/RRA1108-13.html

[4] New Jersey Treasury. “Pension and Health Benefits Reform Under Chapter 78, P.L. 2011.” https://www.nj.gov/treasury/pensions/reform-2011.shtml

[5] Herzenberg, S. and White, J. (December 13, 2017). New Jersey Public Pensions Rank Among Least Generous in the Nation. New Jersey Policy Perspective. http://www.njpp.org/wp-content/uploads/2017/12/NJ-Pension-Brief-12-13-17-Final.pdf

[6] National Association of State Retirement Administrators. “Defined Benefit.” https://www.nasra.org/db

[7] In some states, benefit factors are based on variables such as years of service and age of retirement. To standardize these figures for comparison, we use the benefit factor for a teacher who begins work at age 25 and retires at the state’s “normal” retirement age. We also elect not to use the NASRA’s reported benefit factor for Massachusetts, which does not align with figures reported by the state; instead, we assume a retirement at 60 and a start age of 25 (see: https://mtrs.state.ma.us/members/#retiring-from-mtrs). We also use the “RetirementPlus” formula, as new members are automatically enrolled (see: https://mtrs.state.ma.us/wp-content/uploads/2018/03/retirementpercentagechart-tier2.pdf)

[8] Star-Ledger Editorial Board (January 17, 2016). “Stop demonizing teachers, governor; Editorial.” The Star-Ledger. https://www.nj.com/opinion/2016/01/christie_has_no_right_to_demonize_teachers_editori.html

[9] Herzenberg, S. and White, J. (December 13, 2017). New Jersey Public Pensions Rank Among Least Generous in the Nation. New Jersey Policy Perspective. http://www.njpp.org/wp-content/uploads/2017/12/NJ-Pension-Brief-12-13-17-Final.pdf

[10] Gould, E. (March 8, 2024) Gender wage gap persists in 2023; Women are paid roughly 22% less than men on average. Economic Policy Institute.https://www.epi.org/blog/gender-wage-gap-persists-in-2023-women-are-paid-roughly-22-less-than-men-on-average/

[11] New Jersey Treasury (October 31, 2024). “New Jersey’s Pension Fund Reports 10.74% Returns for FY2024.” https://www.nj.gov/treasury/news/2024/10312024.shtml

[12] Wisconsin Legislative Council. 2023-24 Comparative Study Of Major Public Employee Retirement Systems, October 2024. https://docs.legis.wisconsin.gov/misc/lc/comparative_retirement_study/2023_retirement.pdf

How the Governor’s Fiscal Year 2026 Budget Measures Up

Before the Governor’s budget address for Fiscal Year 2026, New Jersey Policy Perspective produced a preview to evaluate whether the budget sufficiently advances economic, social, and racial justice.

With the release of the Governor’s budget in brief, the Governor’s budget met some important key benchmarks but fell short in other areas. (All citations refer to the Fiscal Year 2026 Budget in Brief unless otherwise noted.)

Below is a short summary of how the governor’s budget measured up.

NJPP FY26 Budget Priority

Was it included in the Governor’s Budget?

Protect the surplus and close the deficit  Yes. The projected annual budget shortfall has been reduced from $2.1 billion in the FY 2025 budget bill to $1.2 billion through some tax increases and budget cuts (BIB p. 8). The surplus remains essentially flat at $6.3 billion, although this amount is potentially too small to withstand looming federal cuts to critical programs such as Medicaid or other state-federal partnerships (BIB p. 8).
Fully fund pensions
and schools
 Yes. The governor continued his commitment to fully funding pensions and the K-12 school funding formula (BIB pp. 10, 15-16).
Raise revenues to balance
the budget
 Partially Included. The governor’s budget raises roughly $1 billion in new revenues, including more than $300 million from a new real estate assessment levied on property sales over $1 million (BIB pp. 53, 58). However, the budget still draws on the surplus to balance the books.
Maintain StayNJ’s guardrails, specifically the original spending rules that require a healthy budget surplus  No. StayNJ, an expensive subsidy program disproportionately benefiting wealthy senior homeowners, requires a 12 percent surplus target before payments can go out. Nonetheless, this budget continues to fund StayNJ and assumes payments will go out in 2026, even though the surplus is only 10.9 percent (BIB pp. 13, 8).
Maintain funding for services for immigrants  Yes. Thankfully, the proposal preserves funding levels for programs such as Cover All Kids, which provides health insurance for children regardless of immigration status, and legal services for immigrant adults and children (BIB pp. 27, 31). The proposal also doubles funding for the Office of New Americans, which connects immigrants to services for which they or their families may be eligible (BIB p. 31).
Expand and improve
tax credits for working
families
 No. Unfortunately, the governor’s budget included no expansion of the Child Tax Credit or Earned Income Tax Credit to assist working families in affording the increasing cost of living in the state.
Increase benefits in WorkFirst NJ to reduce poverty  No. Similarly, there was no expansion of the benefit amount for WorkFirst NJ, which provides cash assistance to low-income households.
Expand affordable health insurance options  Partially Included. As noted above, the budget continued to fund Cover All Kids, dedicating $165 million to the program to keep pace with enrollment. However, there were no other proposals to expand access or eligibility to state-funded health insurance programs.
Keep the Corporate Transit
Fee funding transit
 Yes. Corporate Transit Fee funds were directed only to New Jersey Transit and not to the general fund or footing the bill for other programs (BIB p. 6).
Use the Clean Energy Fund
only for clean energy projects
 No. The raid on the Clean Energy Fund remained similar to prior years, with $70 million going from the Clean Energy Fund to pay for basic New Jersey Transit maintenance (BIB p. 88).
End predatory prison communication fees  No. The budget did not include any funding to reduce or eliminate the cost of prison communication fees, leaving families to foot the $15 million bill for communicating with their loved ones who are incarcerated.

With budget negotiations ahead, lawmakers must prioritize solutions that center the experiences of working- and middle-class New Jerseyans by strengthening economic security, protecting public services, and ensuring long-term fiscal stability. NJPP has released a full report outlining additional progressive revenue solutions that would reduce the need for budget cuts that will hurt working-class families, reduce the need to raid other funds to balance the books, and better insulate New Jersey from looming federal budget cuts.

To learn more about policy solutions that NJPP recommends to build a more equitable state, read Blueprint for a Strong and Resilient New Jersey.

What to Look for in the New Jersey Budget for Fiscal Year 2026

Governor Murphy’s final budget proposal will set in place his legacy. Will his administration be able to follow through on its promise of balancing strong investments in schools and pensions with robust revenues that pay for those investments? Or will the budget fall back on cutting critical programs and one-time gimmicks, hurting working families now and the state’s fiscal footing in the future? As NJPP noted last year when the FY 2025 budget passed, the $2.1 billion structural deficit must be closed with new revenues to avoid a return to underinvestment and shortsighted cuts.[i]

In addition to setting the state’s path for the next administration, this budget must prepare our state for an unclear federal future. Congressional and executive dysfunction threatens to jeopardize critical federal funds — ranging from health insurance and food assistance to environmental protection and transportation infrastructure. For context, federal revenues contribute $27.5 billion to state programs, compared to $56.7 billion from state revenues.[ii] Even minor disruptions in federal funding could result in substantial pain for families and people living in New Jersey and the programs they depend on.

While threats from the federal level will make it difficult for New Jersey’s elected officials to meet their goal to make the state more affordable for residents, there are key areas where the state budget can improve affordability by directly assisting working-class and middle-class families, such as improved family tax credits and health insurance. However, these effective affordability measures will be difficult to expand without either increasing revenues or cutting back on tax breaks for wealthy households and big corporations.

Ahead of Governor Murphy’s budget address for Fiscal Year (FY) 2026, NJPP has identified the following key benchmarks and priorities to evaluate whether the next state budget sufficiently advances economic, social, and racial justice:

Protect the Surplus and Close the Deficit

The threat of federal funding volatility adds urgency to ensuring a robust surplus. With only $6.2 billion left in surplus compared to a $56.6 billion appropriation, the state has only enough revenue to sustain 40 days of government operations.[iii] With the state surplus shrinking rapidly due to structural budget deficits, the state must find additional revenue and end wasteful corporate subsidies to retain budget reserves.

Beyond the good practice of having substantial reserves to withstand economic downturns, the state faces threats at the federal level from congressional or executive branch proposals to weaken or cut existing programs, including:

  • Disaster relief funding,[iv]
  • Infrastructure funding for key programs like the Gateway Tunnel,[v] and
  • Potential cuts to key social safety net programs such as Medicaid, food assistance, and Temporary Assistance for Needy Families.[vi]


For example, any reduction in Medicaid funding would result in an enormous shortfall to a program that sends nearly $13 billion in federal funds to the state each year.[vii]

Fully Fund Pensions and Schools

New Jersey has maintained its commitment to funding pensions and schools after years of disinvestment, and doing so has helped to improve the state’s fiscal standing while following through on its obligations to its workers and residents.[viii] However, as the structural deficit makes additional spending on legislative priorities difficult, lawmakers may seek reductions in school and pension funding to help pay for pet projects. This would jeopardize the state’s credit rating, which has been sustained by robust surpluses and full pension payments. New Jersey has already seen the high cost of paying for past mistakes in underfunding the pensions,[ix] and schools need more, not less, funding to meet their goal of high-quality education for all students.[x]

Raise Revenues to Balance the Budget

One straightforward answer to the state budget’s structural budget deficit is to raise sufficient revenues to pay for the state’s investments and infrastructure. NJPP has proposed a package of revenue raisers that would adjust taxation for wealthy individuals and large corporations to raise roughly $4 billion to ensure that the state government has sufficient revenue to pay its bills and maintain its long-term investments.[xi] New Jersey can and should take steps to improve its tax system to take the state on a path toward fiscal responsibility, generate sufficient funds to invest in growth and affordability, reduce income and economic inequity, and ensure the wealthy pay their fair share. The proposal includes:

  • $410 million from expanding the fee on sales of very expensive homes to fund affordable housing
  • $772 million from raising marginal tax rates on people earning more than $2 million a year
  • $888 million from requiring large corporations to pay taxes on all their profits, including profits currently reported in foreign tax havens, and
  • $385 million from funding more auditors to pursue tax avoidance and evasion.


Maintain StayNJ’s Guardrails

The StayNJ proposal, a subsidy program for senior homeowners, is an expensive program providing the bulk of its benefits to wealthier residents while leaving lower-income seniors with limited to no benefit.[xii] Fortunately, lawmakers included guardrails requiring that the state maintain at least a 12 percent surplus before the program can send out its checks.[xiii] The fiscal year 2025 budget failed to reach that benchmark, reaching less than 11 percent of the total budget.[xiv] A healthy surplus is even more critical now due to the volatility in federal funding, so the state should abide by the original statute and avoid spending hundreds of millions of dollars on a new expensive benefit without ensuring the state can pay all its existing bills.

Maintain Funding for Services for Immigrants

Immigrants make up nearly roughly 1 in 4 New Jersey residents, and the state budget has funded programs for immigrants in recent years to fill gaps left by restrictions on federal funding for noncitizens. Given recent attacks on immigrants regardless of status and increases in deportations, New Jersey should maintain or increase funding for:

  • Cover All Kids health insurance coverage for all children regardless of immigration status
  • Detention and deportation defense legal assistance
  • Legal representation for children and youth, and
  • Office of New Americans coordination to connect immigrant residents to services such as child care and job training.


Expand and Improve Tax Credits for Working Families

Despite repeated calls by lawmakers to make the state affordable for all in the last budget, the state did not expand two critical family tax credits to support affordability for working families – the Child Tax Credit and the Earned Income Tax Credit. These credits effectively reduce poverty by giving money back directly to families who need it through their tax refund each year.[xv] Both programs need increased funding and expanded eligibility to reach more families.[xvi] Even in a tight budget year, small increases in benefits or expansions in age eligibility would directly help more families afford life in the state.

Increase Benefits in WorkFirst NJ to Reduce Poverty

With all safety net and cash assistance programs under threat of federal cuts, it is even more urgent for the state to ensure that the lowest-income residents can meet the high cost of living in the state.[xvii] New Jersey’s benefits for WorkFirst New Jersey, its cash assistance program for very-low-income households, remain woefully inadequate, with less than $7,000 annually for a family of three.[xviii] To improve affordability, the budget should start by expanding the WorkFirst New Jersey grant amount to get closer to the state’s actual cost of living.

Expand Affordable Health Insurance Options

New Jersey’s considerable progress in reducing the uninsured rate for children and adults faces serious federal threats, ranging from possible work requirements for Medicaid to expiring subsidies for marketplace plans. To prepare for these threats, the state budget should set money aside to ensure that families can continue to afford care by:

  • Creating a buy-in option for NJ FamilyCare plans
  • Opening the marketplace and its subsidies to all eligible residents, regardless of immigration status, and
  • Fully funding existing coverage expansion programs such as Cover All Kids.[xix]

Keeping all the state’s residents insured helps keep the state healthier and more affordable.


Keep the Corporate Transit Fee Funding Transit

Last year, New Jersey dedicated funding in the state budget for New Jersey Transit for the first time, creating the Corporate Transit Fee on corporations with more than $10 million in profit.[xx] The fee represented an enormous step forward for stable funding of this critical infrastructure. However, just one year later, lawmakers may raid Corporate Transit Fee revenues to help fund their other priorities in a tight budget, as they have with other dedicated funds such as the Clean Energy Fund.[xxi] This would be a mistake for our economy and for riders: New Jersey Transit desperately needs the funds from the fee to pay for essential operations, as riders face long delays, uneven service, and fare hikes.[xxii] New Jersey’s mass transit has dealt with decades of disinvestment due to raids and shortsighted decisions to underinvest; the Corporate Transit Fee must remain with transit.

Use the Clean Energy Fund on Clean Energy

Thanks to the Corporate Transit Fee, this budget also represents an opportunity to ensure that clean energy funds are not diverted to NJ Transit to pay for basic maintenance instead of its intended purpose of promoting the use of clean energy.[xxiii] Rather than go to basic operations, these dollars should be earmarked with specific language in the budget to ensure that they support transitioning the agency’s buses, trains, and buildings to green energy and zero emissions. 

End Predatory Prison Communication Fees

Despite evidence that communication with family and community members can reduce recidivism for people in incarceration, New Jersey still requires the families of people who are incarcerated to pay private contractors for phone and video calls with their loved ones. The state should pay for these services and eliminate the $15 million in fees these families currently pay to contact their loved ones.[xxiv] The cost to the state would amount to roughly 1.4 percent of the overall $1.1 billion state correctional department budget.[xxv]


End Notes

[i] Peter Chen et al., New Jersey Policy Perspective, New Jersey Chooses People Over Profits in the Fiscal Year 2025 State Budget, June 28, 2024, https://www.njpp.org/publications/blog-category/new-jersey-chooses-people-over-profits-in-the-fiscal-year-2025-state-budget/.

[ii] New Jersey Department of the Treasury, Office of Management and Budget, The State of New Jersey Appropriations Handbook Fiscal Year 2025 (2024), p. D-16, C-2, https://nj.gov/treasury/omb/publications/25approp/AppropriationsHandbookFull.pdf

[iii] 42 days calculated by dividing the projected closing balance ($6,197,868) by total appropriations ($56,613,303). See New Jersey Office of Legislative Services, Fiscal Year 2025 Appropriations Bill (P.L.2024, c.22 with Line Item Veto and Revenue Certification) (2024) p. 1. https://pub.njleg.state.nj.us/publications/budget/Scoresheet_FY_2025_Appropriations_Act_(P.L.2024,_c.22).pdf

[iv] Lauren Peller, Speaker Mike Johnson suggests ‘conditions’ needed on disaster aid for LA wildfires, ABC News, Jan. 13, 2025, https://abcnews.go.com/Politics/speaker-mike-johnson-suggests-conditions-needed-disaster-aid/story?id=117636693

[v] Colleen Wilson, Could Trump executive order hold up money for NJ Transit projects, Gateway tunnel?, NorthJersey.com, Jan. 27, 2025, https://www.northjersey.com/story/news/transportation/2025/01/27/could-trump-order-block-money-for-key-nj-transit-projects/77912637007/

[vi] House Ways and Means Committee, Untitled memo on list of possible cuts to the federal tax reconciliation bill, Jan. 23, 2025, available at Read: Draft Options for G.O.P. Cost Cuts for Tax Bill, N.Y. Times, Jan. 23, 2025, https://www.nytimes.com/interactive/2025/01/23/us/politics/republican-tax-spending-cuts-options.html.

[vii] New Jersey Department of the Treasury, Office of Management and Budget, The State of New Jersey Appropriations Handbook Fiscal Year 2025 (2024), p. D-6, https://nj.gov/treasury/omb/publications/25approp/AppropriationsHandbookFull.pdf.

[viii] Peter Chen et al., New Jersey Policy Perspective, Evaluating Governor Murphy’s Budget Proposal for Fiscal Year 2025, Mar. 8, 2024, https://www.njpp.org/publications/report/evaluating-governor-murphys-budget-proposal-for-fiscal-year-2025/

[ix] Gordon MacInnes & Sheila Reynertson, New Jersey Policy Perspective, The Notorious Nine: How Key Decisions Sent New Jersey’s Financial Health Spiraling Down Over Two Decades, Sept. 2016, https://www.njpp.org/wp-content/uploads/2016/09/NJPPNotorious9Sept2016.pdf.

[x] Bruce Baker & Mark Weber, New Jersey Policy Perspective, Unlocking Academic Success: Revitalizing New Jersey’s School Funding Formula for Student Achievement, Sept. 14, 2023, https://www.njpp.org/publications/report/unlocking-academic-success-revitalizing-new-jerseys-school-funding-formula-for-student-achievement/

[xi] Peter Chen, New Jersey Policy Perspective, Fair and Square: Changing New Jersey’s Tax Code to Promote Equity and Fiscal Responsibility, Nov. 14, 2024, https://www.njpp.org/publications/report/fair-and-square-changing-new-jerseys-tax-code-to-promote-equity-and-fiscal-responsibility/.

[xii] Peter Chen, New Jersey Policy Perspective, How StayNJ is Even More Regressive Than at First Glance, Jun. 24, 2024, https://www.njpp.org/publications/blog-category/how-staynj-is-even-more-regressive-than-at-first-glance/.

[xiii] P.L. 2023, c.75, at C.54:4-8.75m.17.e. https://njleg.state.nj.us/bill-search/2022/A1/bill-text?f=PL23&n=75_

[xiv] The fiscal year 2025 $6.198 billion unreserved balance is roughly 10.9 percent of the state budget’s overall appropriations of $56.613 billion. New Jersey Office of Legislative Services, Fiscal Year 2025 Appropriations Bill (P.L.2024, c.22 with Line Item Veto and Revenue Certification) (2024) p. 1. https://pub.njleg.state.nj.us/publications/budget/Scoresheet_FY_2025_Appropriations_Act_(P.L.2024,_c.22).pdf

[xv] Center on Budget and Policy Priorities, Chart Book: The Earned Income Tax Credit and Child Tax Credit, May 24, 2016, https://www.cbpp.org/research/chart-book-the-earned-income-tax-credit-and-child-tax-credit.

[xvi] Peter Chen, New Jersey Policy Perspective, Boost Family Tax Credits to Boost Affordability, Feb. 25, 2025, https://www.njpp.org/publications/blog-category/boost-family-tax-credits-to-boost-affordability/

[xvii] Brittany Holom-Trundy, New Jersey Policy Perspective, Expand Anti-Poverty Programs to Help Families in Crisis, Jan. 22, 2025, https://www.njpp.org/publications/blog-category/expand-anti-poverty-programs-to-help-families-in-crisis/

[xviii] Brittany Holom-Trundy, New Jersey Policy Perspective, Outdated and Ineffective: Why New Jersey Needs to Update Its Top Anti-Poverty Program, May 22, 2024, https://www.njpp.org/publications/report/outdated-and-ineffective-why-new-jersey-needs-to-update-its-top-anti-poverty-program/

[xix] New Jersey Department of Human Services, Cover All Kids, accessed on Feb. 7, 2024, https://nj.gov/coverallkids/

[xx] Alex Ambrose, New Jersey Policy Perspective, Corporate Transit Fee Should Only Go to NJ Transit, Jan. 28, 2025, https://www.njpp.org/publications/blog-category/corporate-transit-fee-should-only-go-to-nj-transit/

[xxi] Alex Ambrose, New Jersey Policy Perspective, Stop the Raids: The Clean Energy Fund Should Fund Clean Energy, Jan. 12, 2023, https://www.njpp.org/publications/report/stop-the-raids-the-clean-energy-fund-should-fund-clean-energy/

[xxii] For more on the challenges facing New Jersey Transit’s reliability, see Larry Higgs, It will take years to fix the problems that led to the summer of hell for N.J. rail commuters, officials say, NJ.com, Nov. 21, 2024, https://www.nj.com/news/2024/11/it-will-take-years-to-fix-the-problems-that-led-to-the-summer-of-hell-for-nj-rail-commuters-officials-say.html

[xxiii] Alex Ambrose, New Jersey Policy Perspective, Stop the Raids: The Clean Energy Fund Should Fund Clean Energy, Jan. 12, 2023, https://www.njpp.org/publications/report/stop-the-raids-the-clean-energy-fund-should-fund-clean-energy/

[xxiv] Marleina Ubel, New Jersey Policy Perspective, End Predatory Prison Communication Fees, Jan. 15, 2025, https://www.njpp.org/publications/blog-category/end-predatory-prison-communication-fees/.

[xxv] Marleina Ubel, New Jersey Policy Perspective, Prison Profiteers: How Private Companies Profit From Prison Phone Calls and Harm New Jersey Residents, Aug. 19, 2024, https://www.njpp.org/publications/report/prison-profiteers-how-private-companies-profit-from-prison-phone-calls-and-harm-new-jersey-residents/#_edn13


Understaffed and Underfunded: Barriers to Effective Anti-Poverty Assistance

This report was produced in partnership with Communication Workers of America.


Introduction

Workers at county social service agencies across New Jersey provide essential support to our families, friends, and neighbors. They help elders struggling with dementia navigate the process of applying for Medicaid, support veterans in need, and work tirelessly to ensure that hungry children are fed, clothed, and cared for. From Newark to Warren County, social service workers uphold the value of service and care that is the backbone of our shared humanity. Our communities thrive when social service agencies are adequately supported, yet chronic understaffing and underfunding hinder the stability these agencies provide. Low pay and high turnover harm not only the dedicated employees who serve our counties and state but also ripple outward, disrupting vital safety net programs and benefits on which countless individuals and families rely. State leaders often tout these programs as advantages of living in New Jersey, but poor implementation means that residents aren’t getting the help they need.

A new survey conducted by the Communications Workers of America (CWA) of its members working in New Jersey county social service agencies finds that declining staffing and increasing caseloads impact their ability to assist New Jersey residents. Across the county agencies surveyed:

  • Staffing levels from 2019 to 2023 decreased 3.2 percent while caseloads increased 32.4 percent;
  • Nearly three-quarters of respondents in the survey reported that understaffing prevents families from receiving benefits in a timely manner;
  • A majority of respondents cited low pay as a primary driver of understaffing.


These results demonstrate the importance of ensuring employees can deliver quality service so residents can access these vital state programs. By increasing pay, setting and enforcing minimum staffing requirements, and providing benefits that improve work-life balance for agency workers, county leaders can better serve their communities.

Thousands in New Jersey Rely on County Agencies for Assistance

Federal and state benefit programs go through administrative processes to reach eligible participants. County social service agencies and the workers that run them are the community connection administering these programs. These workers evaluate applications and provide eligible residents with the services of New Jersey’s public assistance programs, including:

  • Work First New Jersey (WFNJ) (Temporary Assistance for Needy Families [TANF], General Assistance [GA], and Emergency Assistance [EA])
  • Supplemental Nutrition Assistance Program [SNAP]
  • NJ FamilyCare (New Jersey’s Medicaid and Children’s Health Insurance Program)
  • Child support services
  • Other assistance programs for the elderly, residents living with disabilities, and more.[i]


With nearly 31,000 people currently served by the WFNJ/TANF program, over 830,000 residents currently served by the SNAP program, and over 1.8 million participants in NJ FamilyCare, the county social service agencies are responsible for assisting hundreds of thousands of families each month.[ii]

County Social Service Agencies Assist Hundreds of Thousands of Residents Each Year

There must be enough staff at county social service agencies to serve all eligible residents, regardless of differences across program rules. For example, with its more generous eligibility standards, the SNAP program helps a large number of residents in comparison to the number of residents living in poverty in many counties. Serving eligible residents with timely responses and support to get them the nutrition they need requires a high level of staff capacity.

Insufficient staff capacity combined with problematic program requirements results in fewer residents in need seeking and receiving assistance. The TANF program faces this challenge regularly. With its stringent eligibility requirements that have not changed significantly since the 1990s, TANF becomes more outdated each year and helps fewer and fewer residents in poverty.[iii] These requirements, in combination with low benefits relative to the cost of living, can make eligible residents hesitant to apply. When there are not enough staff to process applications on a timely basis, answer questions, and support those seeking help, the already-existing problems with access to these programs become further exacerbated.

To counteract affordability challenges and more effectively help the nearly 880,000 residents living in poverty, New Jersey leaders must take a two-pronged approach: update program requirements and benefits policies and increase pay and benefits for social service workers, a key step in addressing staffing shortages. 

Undervaluing Workers Delays and Denies Benefit Access

Understanding the working conditions for county social service agencies can help leaders identify how to improve assistance in the state’s anti-poverty programs. A 2024 survey distributed to the 3,000 CWA members employed at county social service agencies across New Jersey examined the connection between staffing levels, workloads, and benefit distribution.[iv] This survey, in combination with data gathered from the Open Public Records Act, requests on staffing and pay levels, highlights the critical role of workers at county agencies in supporting the state’s lowest-income families.

Turnover and Slow Hiring Leaves County Agencies with Low Staffing Levels

When social service agencies are short-staffed, workers are often overwhelmed by the volume of applications and the processing time needed to help all eligible residents.

Despite the increasing need for assistance amongst Garden State residents, staffing levels at county agencies in New Jersey have fallen, putting more strain on workers. Currently, an estimated 5,000 to 6,000 people work for county social service agencies across the state, but these numbers are declining.[v] Across nine agencies (Atlantic, Burlington, Camden, Cumberland, Hunterdon, Middlesex, Morris, Union, and Warren) that provided current and historical employment data through open records requests,  the number of staff fell 3.2 percent between 2019 and 2023, from 2,268 to 2,195.[vi] At the same time, the number of WFNJ/TANF, SNAP, and NJ FamilyCare evaluations for which those workers were responsible increased by 32.4 percent, from 877,970 in 2019 to 1,162,209 in 2023.[vii] As caseloads per employee rise, turnover can accelerate, and hiring can become more difficult, especially when salaries and benefits do not rise to match the value of each employee’s work.

Staffing Levels Have Fallen, Despite More Residents Seeking Asistance
Source: CWA analysis of 2023 employee census documents retrieved via Open Public Records Act requests. NJPP Analysis of New Jersey Department of Human Services – Division of Family Development, DFD Current Program Statistics, July 2019 and July 2023; New Jersey Department of Human Services – Division of Medical Assistance & Health Services, NJ FamilyCare Monthly Enrollment Statistics, July 2019 and July 2023.

Increases in Benefit Caseload Per Employee Outpace Staffing Needs Across the State

This issue is not contained in a particular county or region. From Atlantic County to Morris County, agencies have failed to maintain sufficient staffing levels. The nine-county average of WFNJ/TANF, SNAP, and NJ FamilyCare evaluations completed by each employee went from 387 in 2019 to 529 in 2023, a 28 percent increase.[viii] Because of similar trends in poverty and budget issues, this pattern likely carries across most of the state.

Fewer employees, each with more cases assigned, means that each employee has less time to help each person and, in some instances, becomes significantly delayed. Complex application and documentation processes and less time available to help those in need increases the likelihood that residents are wrongly turned away or denied benefits. 

Low Pay and Poor Work Environments Lead to Understaffing

“The expense of everyday living does not equate to my paycheck. I am robbing Peter to pay Paul. Due to the lack of pay and increase in health insurance.” – Essex County social service worker

Where workers are undervalued, maintaining adequate staffing levels becomes impossible. Low wages that do not keep pace with the cost of living mean that employees struggle to pay bills and support their families. This makes recruiting larger numbers of staff more difficult. When asked to identify the top two causes of understaffing at their agencies, over half of survey responses received in New Jersey emphasized low pay.

Workers Cite Low Pay as the Leading Cause of Understaffing

In addition to low pay, several other issues — such as a lack of empowerment to provide input in the policies and decision-making, unhealthy workplace climates, and unequal pay across workers with the same title — were all mentioned by nearly 1 in 4 respondents. Additionally, issues such as expensive or inadequate health insurance are closely tied to low pay. Follow-up survey responses emphasized that the combination of low pay and expensive health coverage go hand-in-hand.[ix]

"Our pay is not even close to keeping up with the cost of living increases. The healthcare increases are extreme. I shouldn't be on the verge of homelessness, when trying to serve the homeless, myself." - Camden County Social Service Worker

Deteriorating understaffing issues mean that workloads continuously increase beyond the staff’s capacity. As a result, they experience low morale and burnout much sooner, leading to high turnover rates and difficulty in hiring new staff. This further worsens the understaffing crisis, creating a snowball effect on the agencies’ capabilities to carry out their work successfully. As one Camden County employee shared: “We are being unfairly overworked/understaffed while constantly being told that we need to get things done on time. All while not having a decent raise, which puts morale at an all-time low. Some of us need to miss work due to mental stress alone, which then hurts clients. We need action soon or I don’t see anything getting better.”

Understaffing Leads to Increased Workloads, Low Morale, and Other Negative Outcomes

Only by increasing pay to meet the cost of living and improving work environments can county social service agencies better attract and retain employees to meet staffing needs.

Lack of Sufficient Staffing Delays and Denies Residents Assistance

“The workload has increased tremendously and the loss of staff has gotten worse. There is no time to do all that is required, and if you are not donating your time without compensation, then you can’t keep up.” – Middlesex County Social Service Worker

As workers are saddled with larger workloads, they struggle to meet the timelines necessary to get people the benefits they need. Nearly three-quarters of respondents in the survey cited the inability to provide benefits for families promptly as the main consequence of their agency’s understaffing.

As a Result of Understaffing, Workers are Unable to Provide Promised Benefits to Residents Efficiently

"Applications are 6+ months old. People aren't getting timely services. Elderly and sick people can't go to the doctor because we don't hire enough people." - Monmouth County Social Service Worker

When agencies providing critical support services are short-staffed, the quality of relationships and support for residents also suffers. This is particularly important in social services, as many clients are undergoing vulnerable and difficult experiences. A Camden County employee lamented: “It’s been quantity over quality for as long as I can remember. The “case bank” has stripped the customer of their caseworker, and for some, the caseworker was a relied-on individual in a time of need, who was familiar with their struggle(s). There is no personalization anymore.”

In addition to the inability to provide benefits in a timely manner, nearly one-third of workers also stated that those residents who primarily speak a language other than English do not have the support they need because of the lack of capacity. “In my building, there is only one bilingual worker. Oftentimes, the receptionist is left struggling to communicate with Spanish speaking clients and to find someone to serve them,” wrote a clerk in Ocean County. “The lack of bilingual workers leaves critical communication needs unmet, especially in field duties such as home visits and client interviews,” noted another worker from Ocean County.

With hundreds of thousands of residents across diverse communities in need of assistance, barriers to social service programs can prevent families from escaping poverty and worsen economic, health, and racial inequities. If New Jersey truly wants to be a leading state in providing generous benefits for residents and a political and economic environment where all residents can thrive, state leaders need to focus on improving the implementation of existing programs, as well as creating new programs and services. Increased benefits will not reach families in need without adequate delivery of services.

Policy Recommendations

While this report identifies challenging issues in New Jersey’s county social service agencies, recent and ongoing collective bargaining processes at the local level offer opportunities to make significant improvements. New Jersey’s public sector bargaining framework allows employees with expertise on the conditions on the ground to negotiate with their employer to improve working conditions, staffing levels, and the quality of work and service across the board. Recent examples from localities such as Ocean County — which has seen increased staffing, decreased turnover, and improved workloads after pay increases — provide a foundation for progress.[x]

In 2024 and 2025, the majority of social service agencies and their unions across the state are either scheduled to start bargaining or are currently engaged in ongoing negotiations.[xi] Through these collective bargaining processes and broader policy changes, Garden State decision-makers and workers must urgently come together to implement three main recommendations from this report’s findings.

Increase Pay

Over 86 percent of survey respondents who said they were considering leaving the job stated that a pay increase of at least 10 percent would help to convince them to stay at their job.[xii] Several respondents reported that more than 10 percent would be needed, particularly with concerns about the increased cost of living and health insurance.[xiii] By increasing pay to meet the cost of living, county social service agencies can improve working conditions for employees and attract more residents to agency jobs.

Improve and Enforce Staffing Ratios

Nearly half (48 percent) of survey respondents reported that a fully staffed department would help convince them to stay at their job.[xiv] Requiring stronger staff-to-program beneficiary ratios and enforcing those ratios would help ensure that the county social service agencies can adequately perform their jobs.

Improve Work-Life Balance for Workers

While the staffing ratios and higher pay will help, improving or providing other benefits — such as child care support, greater flexibility for attending doctor appointments during work hours, and increasing the number of vacation and sick days — will further improve work-life balance to retain workers and attract more to the agencies.

Appendix A: Survey Research Methods

Over 3,000 employees at 14 county social service agencies are represented by the Communications Workers of America (CWA), working under collective bargaining agreements. Social service agency employees represented by CWA coordinate statewide through the CWA New Jersey Welfare Council (Welfare Council). In the spring of 2023, the Welfare Council designed and distributed a survey to measure worker concerns about staffing levels, pay, benefits, and service provision across the state. Between May and August 2024, the survey was sent to all CWA members at 11 of the 21 social service agencies, and 592 employees completed the survey.

Survey outreach was designed to capture a diverse sample of social service agency workers, including employees with a range of job titles and demographic backgrounds, and who work at a mix of large, medium, and small agencies in urban and rural contexts. In addition to surveys, semi-structured interviews with three workers from each agency were conducted to understand quantitative and qualitative survey data better.

Survey participants are racially and ethnically diverse. Of the 492 who answered questions about race and ethnicity (83 percent of the total), 48 percent are White, 33 percent are Black or African American, 9 percent are Multiracial, and 5 percent are Hispanic. Five hundred (84 percent) respondents answered the question about gender: 82 percent are women, and 18 percent are men, reflecting the gender demographics in the social service sector as a whole. For a more detailed chart of survey responses by agency, job title, race/ethnicity, and gender, please contact CWA.

Survey Questions:

  1. Which County Welfare Agency do you work for?
  2. Which programs do you work on (select all that apply)?
  3. Title
  4. If you selected “other” for title above, please share your job title.
  5. Years of Service
  6. Are you a full-time or a part-time employee?
  7. What issues are you the most concerned about in your workplace? Please select the top 3.
  8. Please rate your level of agreement with the following statement: “My department is currently understaffed.”
  9. How long ago did understaffing start?
  10. What do you believe are the two (2) primary drivers of understaffing in your department? Please select only the top 2.
  11. Please rate your level of agreement with the following statement: “My workload interferes with my work/life balance.”
  12. How long ago did your workload get so high that it began to interfere with your work/life balance?
  13. Have you experienced any of the following outcomes as a result of understaffing (select all that apply)?
  14. Has understaffing impacted your department’s ability to provide quality services?
  15. Has understaffing affected the quality of services in your department in any of the following ways?
  16. Please provide specific examples as to how understaffing has impacted the quality of services you are able to provide to the clients.
  17. In the past year, have you considered leaving your job for reasons other than retirement?
  18. What are the top 2 concerns affecting your consideration to leave?
  19. If you are still considering leaving your position, would any of the following convince you to stay?
  20. What is your race?
  21. What is your ethnicity?
  22. What is your gender?

End Notes

[i] New Jersey Department of Human Services, Division of Family Development, County Social Service Agencies, 2024. https://www.nj.gov/humanservices/dfd/counties/

[ii] Note: Throughout the report, “WFNJ/TANF” refers to the Temporary Assistance for Needy Families program under the umbrella of Work First New Jersey, in order to differentiate it from the numbers for General Assistance or Emergency Assistance under Work First New Jersey. Numbers from: NJPP Analysis of New Jersey Department of Human Services – Division of Family Development, DFD Current Program Statistics, September 2024. https://nj.gov/humanservices/dfd/news/cps.html

[iii] New Jersey Policy Perspective, Outdated and Ineffective: Why New Jersey Needs to Update Its Top Anti-Poverty Program, 2024. https://www.njpp.org/publications/report/outdated-and-ineffective-why-new-jersey-needs-to-update-its-top-anti-poverty-program/; Center on Budget and Policy Priorities, Policy Basics: Temporary Assistance for Needy Families, 2022. https://www.cbpp.org/research/family-income-support/policy-basics-an-introduction-to-tanf; New Jersey Policy Perspective, Promoting Equal Opportunities for Children Living in Poverty, 2020. https://www.njpp.org/publications/report/promoting-equal-opportunities-for-children-living-in-poverty/

[iv] For detailed research methods and information about the demographics of the survey respondents, please see Appendix A.

[v] The total social service employment estimate is based on CWA analysis of the following: (1) 2023 total employment data provided by 16 of the 21 social service agencies in response to OPRA requests in 2023, and (2) For the missing 5 counties: estimates were established based on average 2023 employment at agencies with similar poverty rates/benefit participation rates.

[vi] In 2023, the Communications Workers of America obtained employee census snapshots pulled on June 30th, 2019 and June 30th, 2023 via public records requests from nine New Jersey county social service agencies. Records were obtained from Atlantic, Burlington, Camden, Cumberland, Hunterdon, Middlesex, Morris, Union, and Warren Counties. Collectively, these nine counties supported a third of the total people receiving benefits from WFNJ/TANF, SNAP, and NJ FamilyCare in New Jersey in 2019 and 2023.

[vii] NJPP Analysis of New Jersey Department of Human Services – Division of Family Development, DFD Current Program Statistics, July 2019 and July 2023. https://nj.gov/humanservices/dfd/news/cps.html

[viii] Lists of current vacancies by agency were also obtained through OPRA in 2023. Vacancy data suggest that even in the counties where short staffing is not as severe, there are persistent challenges filling vacancies.

[ix] NJPP Analysis of CWA survey data. Data on file with CWA and the author.

[x] CWA Local 1088, representing employees at the Ocean County Social Services Board, worked productively with management to negotiate a historic contract in 2024. The contract was ratified in June of 2024 and, among other improvements, it increased starting pay across all job titles by $3 an hour. Between June and November, at least 60 new employees have been hired, turnover has decreased, and workloads are improving. The contract also includes provisions for an additional $2/hour increase to starting pay by 2025. This progress in Ocean points to the importance of increasing pay and including the people who do the work in robust negotiations to improve New Jersey’s social service landscape. Source: Interview with Steven P. Hernandez, Ocean County Social Services Board, Chapter VP, CWA Local 1088, November 2024.

[xi] NJPP review of social service agency collective bargaining agreements and expiration dates available publicly or by request. Note: public sector bargaining agreements in NJ are collected by and made publicly available by Public Employment Relations Commission (PERC): https://www.nj.gov/perc/conciliation/contracts/

[xii] NJPP Analysis of CWA survey data. Data on file with CWA and the author.

[xiii] NJPP Analysis of CWA survey data. Data on file with CWA and the author.

[xiv] NJPP Analysis of CWA survey data. Data on file with CWA and the author.

Fair and Square: Changing New Jersey’s Tax Code to Promote Equity and Fiscal Responsibility

New Jersey is a rich state with high median wages, high concentrations of wealth, and high productivity.[i] But that wealth does not translate into prosperity for all — more than 1 in 8 children live in poverty,[ii] and key public investments, including schools, public transportation, and municipal services, have faced decades of underfunding and underinvestment. The top 1 percent of households by income take home more than 24 times more than the bottom 99 percent.[iii] Meanwhile, economic growth is increasingly concentrated in multinational corporate profits instead of workers, deepening a system of haves and have-nots.[iv] This inequality exacerbates racial economic divides, with Black and Hispanic/Latinx workers paid lower wages and holding less wealth than white households.[v]

New Jersey can counter these trends, sustain public investments, and reduce income concentration in wealthy households and corporations, by strengthening its progressive tax system. In this system, wealthier individuals pay a higher tax rate, while those with lower incomes pay less.[vi] This approach reflects societal values that those who have benefited the most from our economic systems should contribute a higher percentage of their income and pay back their fair share to the rest of the state, while those with fewer financial resources should pay a smaller share.

Now is the moment to address tax fairness, as more revenue will be needed to improve affordability for the state’s residents. Unfortunately, the state’s revenues have not kept pace with existing obligations, in part because of years of underinvestment in pensions, deferred maintenance on New Jersey Transit,[vii] and failure to fully fund the school funding formula.[viii] These choices led to irresponsible budgeting, which mortgaged the state’s future for short-term budget patches.[ix] As a result, the state is now running a structural deficit, meaning it collects less in revenue than it spends on programs and services.[x] As these longer-term fiscal projections from an independent group of New Jersey budget experts show in the graph below, this deficit will expand in the years to come, draining the state’s surplus and hampering new investments.[xi]

New Jersey's State Budget is Projected to Bring in Billions Less in Revenue to Sustain Current Public Services and Programs

New Jersey’s need for tax reform has additional urgency because of looming threats to the national landscape. Federal tax law changes from 2017 gave substantial tax cuts to wealthy individuals and corporations starting in 2019, but those changes may become permanent in 2025 when those provisions expire.[xii] Expiring federal funds from pandemic-era aid for states will create fiscal cliffs for critical programs such as New Jersey Transit, which has already led to fare increases and the end of popular fare programs.[xiii] The state’s economy needs increased investment in public services at exactly the time when federal support for progressive tax policy and aid to states is declining.

To meet these policy goals, this report lays out a range of revenue-raising options that meet key criteria:

  • Raise new revenues for the state
  • Are based on former or current tax systems such as gross income, sales, or corporate taxation
  • Increase the overall progressivity of the state’s tax system
  • Improve racial and economic equity by closing existing income and wealth disparities.


The full package of revenue increases outlined in this report would raise nearly $4 billion annually for the state’s budget — enough to make all school meals free, restore state aid to schools getting cuts, and cover the state’s entire deficit. The full package includes the state’s major revenue streams, including gross income, sales, corporate business, and inherited wealth taxes, identifying targeted changes to generate much-needed funding without placing those costs disproportionately on the people who need the most help:

  • Income tax: Revising the income tax to add brackets for higher-income residents, including new rates on earners over $2 million, $5 million, and $10 million in income, while expanding working-family tax credits such as the Child Tax Credit and Earned Income Tax Credit to ensure that low- and moderate-income households benefit from the tax changes.
  • Inherited wealth tax: Reforming inherited wealth taxes to reduce unearned wealth transfers and tax large inheritances.
  • Sales tax: Restoring the sales tax to 7 percent, along with modernizing services exemptions, which have excluded accounting, advertising, engineering, and other high-end services from taxation.
  • Realty transfer fee: Adding two percentage points to the existing 1 percent realty transfer fee on home sales over $1 million and four percentage points on sales over $2 million.
  • Corporate tax: Requiring large multinational corporations to report profits from overseas subsidiaries, forcing them to stop offshore profit-shifting.


Net Effect of Tax Policy Changes Would Result in Nearly $4 Billion in New Revenue Annually Right-Size the Income Tax: Raise Rates at the Top, Lower Them at the Bottom
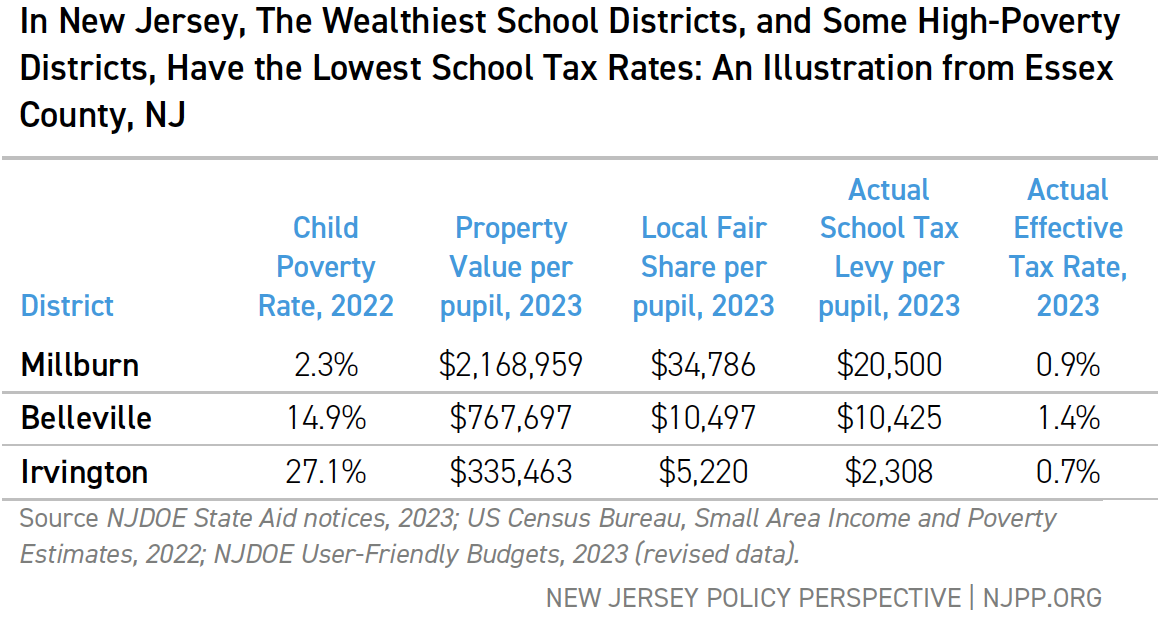
Proposal Overview

Making New Jersey’s income tax more progressive would increase revenue and improve affordability for working- and middle-class households. This proposal would add new tax brackets for incomes over $2 million, $5 million, and $10 million, affecting only a tiny fraction of taxpayers but targeting a significant portion of the state’s wealth. Additionally, it would expand the Earned Income Tax Credit (EITC) to 50 percent of the federal credit and make all workers who file taxes eligible to claim it. The Child Tax Credit (CTC) would also be expanded to $1,500, extending eligibility to children up to age 11. While the expanded working-family tax credits would reduce overall revenues, they would reduce income inequality and provide more financial support to low- and moderate-income households. Combined, this proposal would generate about $772 million annually.[xiv]

Raise Rates at the Top: Higher Marginal Income Tax Rates for High Earners

 New Jersey’s gross income tax applies different rates to income brackets, starting at 1.4 percent for the first $20,000 and reaching 10.75 percent for income over $1 million. This tax funds the state’s local property tax relief and serves as the primary revenue source for school aid.[xv] Even with these progressive elements, wealth continues to remain heavily concentrated in high-income households, with the top 20 percent of households taking home more than half the state’s total income.[xvi]

As shown in the table below, the proposal introduces new tax brackets at $2 million, $5 million, and $10 million, in addition to the existing 10.75 percent rate on earnings over $1 million, known as the “Millionaires Tax.” This adjustment alone would raise more than $1.2 billion for essential state programs while affecting less than 1 percent of households.[xvii] As wealth continues to concentrate at the top, a fair tax system should impose higher rates on the highest earners.

Proposed Tax Rates Would Increase Rates on Only the Top 1% of Incomes

As the state’s experience with the millionaires tax has shown, gross income tax receipts continue to climb despite the increasing marginal rates for those earning over $1 million and $5 million income.[xviii] Additionally, research shows that raising income tax rates on high earners has minimal impact on economic growth.[xix] High-income residents continue to call New Jersey home, and the number of tax filers with over $1 million in income increased by nearly 50 percent between 2019 and 2021.[xx]

Lower Rates at the Bottom: Expanding Working Family Tax Credits

New Jersey, like many states, uses its tax code to reduce poverty and improve affordability to working families and households to help them meet the cost of living by putting cash directly into their bank accounts to help cover the cost of living in the state.[xxi] In particular, the state funds two major tax credits that reduce poverty statewide: the state Earned Income Tax Credit (EITC)[xxii] and the state Child Tax Credit (CTC).[xxiii] As the name implies, the EITC pays workers back by enhancing their incomes, while the CTC provides cash rebates to families with children under age 6. The success of the federal Child Tax Credit has shown that even modest increases in credit amounts can dramatically reduce child poverty.[xxiv]

However, in New Jersey, both programs are still limited in their eligibility, weakening their antipoverty effects. The EITC, for example, is not available for workers without a Social Security number, excluding immigrant workers who pay and file taxes each year.[xxv] The CTC is only available for families with a child under age 6,[xxvi] despite research showing that children’s expenses grow as they age.[xxvii]

New Jersey should expand its Earned Income Tax Credit to 50 percent of the federal credit, and expand eligibility to all workers who file taxes, not just those with Social Security numbers.

Similarly, New Jersey should expand its Child Tax Credit to children ages 6 to 11 and increase the maximum benefit from $1,000 to $1,500 for children under age 6.[xxviii]

These changes would put hundreds of dollars back into families’ pockets, helping make New Jersey the best place to raise a family. These combined proposals would increase the progressivity of the tax code by providing an estimated $432 million to low- and moderate-income households. By amplifying the antipoverty effects of these critical lifelines, the state can help more households meet basic needs and raise the standard of living for working families. 

Net Effect of Combined Income Tax Proposals

Expanding tax credits for the lowest 40 percent of earners while raising income tax rates for the top 1 percent would make the state’s income tax system more progressive. This would generate additional income for the state while reducing the financial burden on its lowest-income residents, with no changes to rates for the majority of taxpayers.

Lower-Income Groups Would See Benefits While Only Highest 1% Would See Increases

This combination of income tax changes would boost revenue and make the tax system fairer — a win-win for both New Jersey and its residents. The annual increase of $1.2 billion in revenue based on the bracket changes at the top of the income spectrum would be partially offset by the $432 million in reductions for low- and moderate-income households, resulting in a net revenue increase of $772 million. These tax law changes raise costs only for the wealthiest one percent while helping those who need the most help and funding critical state priorities.

Restore Taxes on Inherited Wealth Transfers

Proposal Overview

Taxation of intergenerational wealth is critical to reducing wealth inequality, shrinking the racial wealth gap, and equitably generating revenue. New Jersey currently has an inheritance tax which taxes the money collected by heirs, but the state no longer has an estate tax which taxes the overall value of the deceased person’s estate.[xxix] The proposed options aim to either eliminate inheritance tax exemptions or restore the estate tax, ensuring that intergenerational wealth transfers among the wealthiest households contribute to critical state needs. By implementing these changes, New Jersey could generate between $450 million and $598 million annually.[xxx]

Proposal Details

Currently, the inheritance tax includes major exemptions, covering lineal descendants (children, grandchildren, etc.), spouses, or lineal ancestors (parents, grandparents, etc.).[xxxi] Since the majority of inheritances come from parents or grandparents,[xxxii] these broad exemptions have resulted in most estate wealth being exempt from taxation entirely: Of the nearly $5.8 billion in total estate wealth in 2017, less than $2.5 billion (43 percent) was taxable.[xxxiii]

These loopholes run the risk of worsening wealth disparities and racial wealth inequality. Inheritances disproportionately benefit higher-income people, who compound their existing wealth while lower-income people are unlikely to receive any inheritance at all.[xxxiv] Across races, the difference in inheritance rates reinforce existing disparities: 30 percent of white families nationally report having received an inheritance, compared to only 10 percent of Black and 7 percent of Latinx/Hispanic families.[xxxv]

The Majority of New Jersey Estate Wealth Avoids Taxation Due to Broad Exemptions

Compounding matters, New Jersey eliminated its estate tax for residents passing away after December 31, 2017.[xxxvi] Estate taxes were levied on the total value of the estate of the deceased person, and the elimination of this tax has led to substantial revenue loss for the state, estimated at $560 million in 2022 — $598 million in 2024 dollars.[xxxvii]

Concerns about the potential risks of inherited wealth taxes at the state level, such as forced home sales to cover tax costs or an exodus of older high-wealth residents, do not have a strong basis in the available evidence. Real estate such as homes and land do not make up the bulk of estates, which are overwhelmingly composed of intangible property such as retirement and bank accounts.[xxxviii] Meanwhile, research on aging adults and their moving behavior shows, at most, little effect on residence decisions.[xxxix]

New Jersey has two options for taxing inherited wealth transfers:

  • Eliminating the inheritance tax exemptions and subjecting all transfers to taxation;
  • Restoring the estate tax.


Removing inheritance tax exemptions would generate an estimated $451 million in annual revenue for the state[xl]. Restoring the estate tax could generate between $450 million and $598 million annually. These amounts could vary, depending on state policy decisions such as the size of exemptions, whether some heirs would still have partial exemptions, and the interplay between the two taxes. Nonetheless, taxing intergenerational wealth transfers is an effective way to raise revenue while reducing wealth inequality.

Restore the Sales Tax Rate and Eliminate Loopholes and Exemptions

Proposal Overview

Reversing the damaging Christie-era sales tax cut while modernizing the sales tax by eliminating gimmicks and exemptions would create a broader tax base and generate much-needed revenue. Specifically, the proposal aims to: restore the sales tax from 6.625 percent to 7 percent; eliminate loopholes for car rental companies and yacht purchases; and tax high-end professional services. Taken together, this proposal could generate about $859 million.

Restoring the sales tax to 7 percent would generate $702 million annually, while eliminating the car rental and yacht loopholes would add another $157 million. Estimates for eliminating high-end professional services vary due to the complexity of industry-specific sales data.

Proposal Details

Increasing sales taxes can bring in much-needed reliable revenue for a budget facing a structural deficit.[xli] New Jersey’s sales tax supports the state’s general fund by taxing consumer purchases, with exemptions for groceries, medicine, and various services.[xlii] Although the sales tax does place proportionally more financial burden on lower-income residents, the below graph shows that people in the bottom 60 percent of incomes would see increases of under $100 if the sales tax cut were reversed, with even smaller amounts for lower-income residents.

To counter the impact on low- and moderate-income households, New Jersey can maintain and improve its overall progressive tax code by expanding refundable working family tax credits as detailed in the income tax section above.[xliii]

Returning the Sales Tax to 7% Would Cost Most Households Less Than $100 Per Year

Robust sales tax collections are essential for aligning the state’s revenues with state economic activity. However, it is crucial not to compound the sales tax’s regressive nature by allocating the revenue generated on regressive tax programs such as property tax credits.[xliv] Past ill-planned tax cuts, like the Christie-era sales tax reduction, cost the state hundreds of millions in much-needed tax dollars while providing little in terms of economic benefits.[xlv]

Restoring the sales tax to 7 percent would generate roughly $700 million in additional revenue for the state. About one-quarter of the revenue generated — around $180 million — would come from non-residents, such as tourists and shoppers from neighboring states.[xlvi]

Additionally, New Jersey’s sales tax is primarily geared toward goods, even though services now make up a larger portion of the economy as a whole. Services account for nearly two-thirds of all consumer spending in the state,[xlvii] yet high-end services remained exempt. Put differently, when a family goes to buy a computer, they pay taxes on that purchase, but if a large corporation buys computing services from a third-party vendor, they do not pay taxes on that service.

Examples of services exempt from sales tax include:

  • Accounting and Bookkeeping
  • Architects
  • Land Surveying
  • Attorneys
  • Engineers
  • Advertising and Marketing
  • Public Relations and Management Consulting
  • Lobbying and Consulting
  • Data Processing Services


These high-end services, categorized under “Professional, Scientific, and Technical Services” in the North American Industry Classification System, generated $67.6 billion in revenue in New Jersey, based on 2017 data,[xlviii] much of which was not subject to sales tax.[xlix]

Major Service Industries Are Not Subject to Sales Tax, Leaving Potentially Billions in Revenue on the Table

Updating the state’s sales tax code to include these services and closing loopholes can bring in substantial revenue. Closing the car rental loophole alone could generate $174 million annually,[l] while repealing the yacht purchase tax would bring in about $15 million in additional annual revenue.[li]

The state has precedent for updating services subject to sales tax, but it has been nearly 20 years since the last major revision in 2006.[lii] That update expanded the tax to include services like pre-written computer software, flooring installation, storage units, and personal care services such as tanning salons and massage therapy.

Raise Fees on Super-Luxury Homes Sales

Proposal Overview

 New Jersey’s market for super-luxury homes continues to grow, as homes with high price tags continue to sell faster than more moderately priced homes.[liii] Currently, New Jersey levies a 1 percent tax on home sales greater than $1 million.[liv] This proposal suggests increasing the tax to 3 percent for homes over $1 million and 5 percent for homes over $2 million. This proposal would generate about $410 million in new annual revenues while affecting only the top 10 percent of home sales.

Proposal Details

The existing fee has done little to dampen the luxury home market, with sales of very expensive homes continuing to grow while the overall housing market has cooled. While many residents struggle with the high cost of housing in New Jersey, very expensive homes continue to change hands at a high rate. However, as detailed in a recent NJPP analysis, an added fee on expensive home sales would provide substantial revenue for the state.[lv] Home sales over $1 million represent less than 10 percent of home sales in the state, with home sales over $2 million making up less than 2 percent.[lvi] These transactions affect high-income or high-wealth households, leaving the vast majority of homeowners unaffected.

Home Sales Over $1 Million Make Up a Small Percentage of Total Home Sales

Require Worldwide Combined Corporate Reporting to Fight Against Profit Offshoring

Proposal Overview

As large multinational corporations have enjoyed the lion’s share of economic growth, they have also grown sophisticated in hiding their profits, shifting to tax haven countries to avoid tax exposure in the United States. As corporations have used sophisticated tax avoidance strategies to move their profits overseas, they have hidden their true profit margins from state regulators.[lvii] Across the country, the overall corporate tax base has shrunk even as corporate profits have skyrocketed to record levels.[lviii] New Jersey can help fight back against this corporate tax offshoring through a straightforward solution: require all corporations to report profits from global subsidiaries, not just those based in the United States. This approach, called “mandatory worldwide combined reporting,” is a critical tool to address profit offshoring, which has accelerated in recent years, significantly reducing the corporate tax base.

Currently, New Jersey taxes corporations that meet a certain threshold of sales in New Jersey by applying a tax to their overall profits, based on the proportion of those sales occurring in the state.[lix] By expanding this to include all global profits, New Jersey would increase its overall tax base, raising an estimated $888 million in annual revenue simply by requiring corporations to disclose all profits, including those declared overseas.

Proposal Details

The concept of requiring full disclosure, called “mandatory worldwide combined reporting,” simplifies the complex web of corporate offshore holdings by requiring that all profits generated by companies controlled by a parent company be included in New Jersey’s corporate tax calculations.[lx] Currently, under “water’s edge reporting,” New Jersey only requires that corporations disclose profits generated by companies in the United States, taxing them based on the portion of sales made within the state.[lxi] But, by shifting profits overseas, many corporations make their biggest profits invisible to the state’s taxing authority.

Mandatory combined reporting would close this loophole and level the playing field, by forcing large multinational corporations to show where their profits are hidden. This would also benefit smaller domestic corporations that lack the resources to establish foreign subsidiaries or operate in foreign tax haven countries.

An estimate from 2019 placed the potential benefit to New Jersey of adopting worldwide combined reporting at $714 million.[lxii] This figure is now projected to be nearly $890 million adjusted for inflation.

Increase State Tax Enforcement Workforce

Proposal Overview

The New Jersey state’s tax division hires auditors and collectors to examine the returns of taxpayers to identify errors and collect assessments. This workforce helps ensure the state maximizes its collections and reduces fraud and errors, particularly among high-income and high-wealth taxpayers. However, the number of auditors has declined since the Great Recession. New Jersey should restore its auditor workforce to pre-Great Recession levels, increasing the number of auditors from 340 to at least 485.[lxiii] This proposal would generate about $385 million annually.

Proposal Details

Over the past 20 years, New Jersey’s auditor workforce has shrunk by 30 percent, even though the complexity of the state’s budget and tax code have grown substantially. This reduction has weakened the state’s ability to combat tax fraud and ensure accuracy, especially for complex tax returns. On average, each New Jersey auditor identifies about $2.35 million in assessments.[lxiv] Restoring the workforce to 485 would yield $341 million in additional annual revenue.[lxv] Reinstating the 20 compliance officers lost since 2004 would add another $44 million, bringing the total potential revenue increase to $385 million.[lxvi] These figures are consistent with past performance when auditor staffing levels were higher, with assessment surpassing $1 billion during from 2007 to 2010 when auditor workforces were at their peak.[lxvii]

The Number of Tax Auditors Has Not Recovered from Christie-Era Cuts

Federal efforts to target high-income individuals and large corporations out of compliance with their tax obligations have yielded substantial collections, with nearly $1 billion in past-due taxes collected.[lxviii] Federal tax authorities have noted that the complexity of higher-income audits and auditor attrition has extended the amount of time needed to complete audits.[lxix]

What’s Next for New Jersey

New Jersey needs a set of new revenue streams that will fund the next generation of programs to improve affordability and induce economic growth for generations to come. Whether that comes in the form of increased investments in housing and infrastructure, substantial expansions of tax credits and cash assistance for working families, or increased support for K-12 and higher education, any expansions in public programs to assist affordability will need funding. However, to fully advance equity and lift up the state’s working-class and middle-class residents, these revenues must be generated progressively, ensuring that the state’s wealthiest residents pay their fair share for prosperity for all.

Broadly, this package of potential revenue raisers would set New Jersey on a path toward fiscal responsibility, generate sufficient funds to invest in growth and affordability, and reduce income and economic inequity. Without bold changes in tax policy, New Jersey runs the risk of falling back into the rut it was in at the end of the Christie administration, with a low credit rating, enormous pension and school funding liabilities, and a budget that slashed state employment and investment.[lxx] The choice is clear: New Jersey can choose prosperity for all through targeted taxation of the very wealthy, or a return to fiscal brinkmanship and the continued deferral of essential investments in the state’s well-being.

Net Effect of Tax Policy Changes Would Result in Nearly $4 Billion in New Revenue Annually


End Notes

[i] New Jersey ranks second in the nation in median income at $99,781. See Katherine Engel and Kirby G. Posey, U.S. Census Bureau, Household Income in States and Metropolitan Areas: 2023, p. 3, tbl. 1 (Sept. 2024), https://www2.census.gov/library/publications/2024/demo/acsbr-023.pdf. New Jersey ranks in the top ten in median net worth. See U.S. Census Bureau,

Wealth and Asset Ownership for Households, by Type of Asset and States: 2022, table 1,

Survey of Income and Program Participation, Survey Year 2023, https://www2.census.gov/programs-surveys/demo/tables/wealth/2022/wealth-asset-ownership/state_wealth_tables_dy2022.xlsx. New Jersey’s gross domestic product ranks tenth nationally. U.S. Bureau of Economic Analysis, SQGDP1 State quarterly gross domestic product (GDP) summary (accessed Wednesday, October 16, 2024), https://apps.bea.gov/itable/index.html?appid=70&stepnum=40&Major_Area=3&State=0&Area=XX&TableId=532&Statistic=3&Year=2024:Q2&YearBegin=-1&Year_End=-1&Unit_Of_Measure=Levels&Rank=1&Drill=1&nRange=5.

[ii] U.S. Census Bureau, U.S. Department of Commerce. “Poverty Status in the Past 12 Months.” American Community Survey, ACS 1-Year Estimates Subject Tables, Table S1701, 2023, https://data.census.gov/table/ACSST1Y2023.S1701?q=child poverty&g=040XX00US34. Accessed on October 16, 2024.

[iii] Estelle Sommeiller & Mark Price, Economic Policy Institute, The New Gilded Age: Income Inequality in the U.S. by State, Metropolitan Area, and County at tbl. 1 (July 19, 2018), https://files.epi.org/pdf/147963.pdf.

[iv] U.S. Bureau of Economic Analysis, Corporate Profits with Inventory Valuation Adjustment (IVA) and Capital Consumption Adjustment (CCAdj) [CPROFIT], retrieved from FRED, Federal Reserve Bank of St. Louis; https://fred.stlouisfed.org/series/CPROFIT, October 16, 2024. U.S. Bureau of Economic Analysis, Compensation of Employees: Wages and Salary Accruals [WASCUR], retrieved from FRED, Federal Reserve Bank of St. Louis; https://fred.stlouisfed.org/series/WASCUR, . https://fred.stlouisfed.org/graph/?g=G8JT.

[v] New Jersey Institute for Social Justice, The Two New Jerseys by the Numbers: Racial Wealth Disparities in the Garden State (March 2023), https://njisj.org/wp-content/uploads/2023/07/Two_New_Jerseys_By_the_Numbers_Data_Brief_3.23.23-compressed.pdf.

[vi] By contrast a regressive tax system has higher tax rates for lower-income residents. For more information on progressive and regressive tax systems, see Institute on Taxation and Economic Policy, Who Pays? A Distributional Analysis of the Tax Systems in All 50 States, Seventh Edition (Jan. 2024), https://sfo2.digitaloceanspaces.com/itep/ITEP-Who-Pays-7th-edition.pdf.

[vii] Alex Ambrose & Peter Chen, New Jersey Policy Perspective, Getting Back on Track: Fully Fund NJ Transit by Taxing Big Corporations, Sept. 27, 2023, https://www.njpp.org/publications/report/getting-back-on-track-fully-fund-nj-transit-by-taxing-big-corporations/.

[viii] For a review on the accumulation of insufficient funding of the school funding formula, see Bruce Baker & Mark Weber, New Jersey Policy Perspective, School Funding in New Jersey: A Fair Future for All, Part 3: The School Funding Reform Act – 2020 Update (Nov. 2020), https://www.njpp.org/wp-content/uploads/2020/11/NJPP-School-Funding-in-New-Jersey-A-Fair-Future-for-All-Part-3.pdf.

[ix] Gordon MacInnes & Sheila Reynertson, New Jersey Policy Perspective, The Notorious Nine: How Key Decisions Sent New Jersey’s Financial Health Spiraling Down Over Two Decades (Sept. 2016), https://www.njpp.org/wp-content/uploads/2016/09/NJPPNotorious9Sept2016.pdf.

[x] Multi-Year Budget Workgroup, Steve Sweeney Center for Public Policy, New Jersey’s Fiscal Cliff: Current Services Budget Projections, Long-Term Economic Forecast, and the Multi-Year Structural Deficit (June 13, 2024), https://chss.rowan.edu/centers/sweeney_center/mybwreportjune2024web.pdf.

[xi] Multi-Year Budget Workgroup, Steve Sweeney Center for Public Policy, New Jersey’s Fiscal Cliff: Current Services Budget Projections, Long-Term Economic Forecast, and the Multi-Year Structural Deficit (June 13, 2024), https://chss.rowan.edu/centers/sweeney_center/mybwreportjune2024web.pdf.

[xii] Steve Wamhoff, Institute on Taxation and Economic Policy, Extending Temporary Provisions of the 2017 Trump Tax Law: Updated National and State-by-State Estimates, Sept. 13, 2024, https://itep.org/trump-tax-law-tcja-permanent-state-by-state-estimates/.

[xiii] Nikita Biryukov, NJ Transit approves $3B budget amid outcry over fare hikes, New Jersey Monitor, Jul. 25, 2024, https://newjerseymonitor.com/2024/07/25/nj-transit-approves-3b-budget-amid-outcry-over-fare-hikes/.

[xiv] Based on analysis by the Institute on Taxation and Economic Policy.

[xv] John Reitmeyer, Explainer: A Look Under the Hood of NJ’s Income Tax and Its Special Quirks, NJ Spotlight News, Apr. 9, 2019, https://www.njspotlightnews.org/2019/04/19-04-08-explainer-a-look-under-the-hood-of-njs-income-tax-and-its-special-quirks/.

[xvi] Data shows that the top 5 percent of households by income in New Jersey take home more than 22 percent of the state’s aggregate income. The top 20 percent take home more than 51 percent. B19082 Census 1-year 2023 estimate.

[xvii] Based on analysis by the Institute on Taxation and Economic Policy.

[xviii] U.S. Census Bureau, State Government Tax Collections, Individual Income Taxes in New Jersey [NJINCTAX], retrieved from FRED, Federal Reserve Bank of St. Louis; https://fred.stlouisfed.org/series/NJINCTAX, October 16, 2024.

[xix] Wesley Tharpe, Center on Budget and Policy Priorities, Raising State Income Tax Rates at the Top a Sensible Way to Fund Key Investments (Feb. 7, 2019), https://www.cbpp.org/research/state-budget-and-tax/raising-state-income-tax-rates-at-the-top-a-sensible-way-to-fund-key.

[xx] The number of tax filers with $1 million or more in income increased from 22,720 to 33,770 between 2019 and 2021. Compare Internal Revenue Service, Statistics of Income, Table 2: Individual Income and Tax Data, by State and Size of Adjusted Gross Income, Tax Year 2019 (Dec. 2021), https://www.irs.gov/pub/irs-soi/19in31nj.xlsx with Internal Revenue Service, Statistics of Income, Table 2: Individual Income and Tax Data, by State and Size of Adjusted Gross Income, Tax Year 2021 (Feb. 2024), https://www.irs.gov/pub/irs-soi/21in31nj.xlsx.

[xxi] Samantha Waxman et al., Center on Budget and Policy Priorities, Interactive Map: States Should Continue Enacting and Expanding Child Tax Credits and Earned Income Tax Credits (Aug. 24, 2024), https://www.cbpp.org/research/state-budget-and-tax/states-should-continue-enacting-and-expanding-child-tax-credits-and.

[xxii] New Jersey Division of Taxation, NJ Earned Income Tax Credit Frequently Asked Questions (last updated Dec. 2023), https://www.nj.gov/treasury/taxation/eitc/eitcfaq.shtml

[xxiii] New Jersey Division of Taxation, Child Tax Credit (last updated Jan. 5, 2024), https://www.nj.gov/treasury/taxation/individuals/childtaxcredit.shtml.

[xxiv] Elise Gould, Child Tax Credit expansions were instrumental in reducing poverty rates to historic lows in 2021, Economic Policy Institute Working Economics Blog, Sept. 22, 2022, https://www.epi.org/blog/child-tax-credit-expansions-were-instrumental-in-reducing-poverty-to-historic-lows-in-2021/.

[xxv] Vineeta Kapahi, New Jersey Policy Perspective, Building a More Immigrant Inclusive Tax Code: Expanding the EITC to ITIN Filers (July 2020),

https://www.njpp.org/wp-content/uploads/2020/07/NJPP-Report-Building-a-More-Immigrant-Inclusive-Tax-Code-Expanding-the-EITC-to-ITIN-Filers-1.pdf. For more on the nearly $100 billion in tax payments by undocumented immigrants including more than $1.3 billion in New Jersey alone, see Carl Davis, Marco Guzman & Emma Sifre, Institute on Taxation and Economic Policy, Tax Payments by Undocumented Immigrants, Jul. 30, 2024, https://sfo2.digitaloceanspaces.com/itep/ITEP-Tax-Payments-by-Undocumented-Immigrants-2024.pdf.

[xxvi] N.J. Stat. Sec. 54A:4-17.1

[xxvii] Mark Lino et al., U.S. Department of Agriculture, Center for Nutrition Policy and Promotion, Expenditures on Children by Families, 2015,. Miscellaneous Publication No. 1528-2015 (Mar. 2017), p. 15, https://fns-prod.azureedge.us/sites/default/files/resource-files/crc2015-march2017.pdf.

[xxviii] For additional information on proposals to expand the state’s Child Tax Credit, see Peter Chen, New Jersey Policy Perspective, How an Expanded Child Tax Credit Would Help More Hard-Working New Jersey Families, Jan. 31, 2023, https://www.njpp.org/publications/report/how-an-expanded-child-tax-credit-would-help-more-hard-working-new-jersey-families/. Analysis of an expanded child tax credit has shown that New Jersey could reduce child poverty by 25 percent with a $2,000 credit for children under age 6 and $1,700 for ages 6-18. See Institute on Taxation and Economic Policy, Columbia Center on Poverty and Social Policy, Child Tax Credit Options for Reducing Child Poverty (2022),  https://itep.sfo2.digitaloceanspaces.com/Child-Tax-Credit-Options-New-Jersey-2022.pdf.

[xxix] New Jersey Division of Taxation, General Information: Inheritance and Estate Tax, O-10-C (Jan. 2017), https://www.nj.gov/treasury/taxation/pdf/other_forms/inheritance/o10c.pdf.

[xxx] See Samantha Waxman, Center on Budget and Policy Priorities, State Taxes on Inherited Wealth, Jun. 2021, https://www.cbpp.org/research/state-budget-and-tax/issue-brief-state-taxes-on-inherited-wealth; Martin Poethke & Patrick Brennan, New Jersey Office of Legislative Services, Legislative Fiscal Estimate [Second Reprint], Assembly, No. 12, Oct. 12, 2016, https://www.njleg.state.nj.us/bill-search/2016/A12/bill-text?f=A0500&n=12_E3.

[xxxi] N.J. Stat. Sec. 54:34-2

[xxxii] Andrew Van Dam, How inheritance data secretly explains U.S. inequality, Washington Post, Nov. 10, 2023, https://www.washingtonpost.com/business/2023/11/10/inheritance-america-taxes-equality/.

[xxxiii] State of New Jersey Department of the Treasury, Office of Revenue and Economic Analysis, Transfer Inheritance Tax: Statistical Report for Tax Years 2015-2017 (Jul. 28, 2021), https://www.nj.gov/treasury/economics/documents/pdf/stats/Transfer-Inheritance-Tax-Statistical-Report-TY-2015-2017.pdf at 5.

[xxxiv] Andrew Van Dam, How inheritance data secretly explains U.S. inequality, Washington Post, Nov. 10, 2023, https://www.washingtonpost.com/business/2023/11/10/inheritance-america-taxes-equality/.

[xxxv] Bhutta, Neil, Andrew C. Chang, Lisa J. Dettling, and Joanne W. Hsu (2020). “Disparities in Wealth by Race and Ethnicity in the 2019 Survey of Consumer Finances,” FEDS Notes. Washington: Board of Governors of the Federal Reserve System, September 28, 2020, https://doi.org/10.17016/2380-7172.2797.

[xxxvi] N.J. Stat. Sec. 54:38-1.a.(4). Previously the minimum size of an estate to be eligible for the tax was $675,000. As with other estate taxes including the federal estate tax, wealthy residents could still avoid the tax through a variety of methods. See U.S. Senate Committee on Finance, Estate Tax Schemes: How America’s Most Fortunate Hide Their Wealth, Flout Tax Laws, and Grow the Wealth Gap, Oct. 12, 2017, https://www.finance.senate.gov/imo/media/doc/101217%20Estate%20Tax%20Whitepaper%20FINAL1.pdf.

[xxxvii] Martin Poethke & Patrick Brennan, New Jersey Office of Legislative Services, Legislative Fiscal Estimate [Second Reprint], Assembly, No. 12, Oct. 12, 2016, https://www.njleg.state.nj.us/bill-search/2016/A12/bill-text?f=A0500&n=12_E3.

[xxxviii] Personal property made up 70 percent of estates, compared to real property at 18 percent in tax year 2017, the most recent year of available data State of New Jersey Department of the Treasury, Office of Revenue and Economic Analysis, Transfer Inheritance Tax: Statistical Report for Tax Years 2015-2017 (Jul. 28, 2021), https://www.nj.gov/treasury/economics/documents/pdf/stats/Transfer-Inheritance-Tax-Statistical-Report-TY-2015-2017.pdf at 6.

[xxxix]Samantha Waxman, Center on Budget and Policy Priorities, State Taxes on Inherited Wealth, Jun. 2021, https://www.cbpp.org/research/state-budget-and-tax/issue-brief-state-taxes-on-inherited-wealth, n.1.

[xl] Given that inheritance tax data is limited, this estimate is based on key assumptions. First, the estimate assumes that the effective tax rate on Class A (lineal descendants and spouses) and Class C (siblings) beneficiaries would be the same as the current effective tax rate on Class D beneficiaries if the current Class D marginal rate structure were applied to Class A and Class C beneficiaries. Second, it assumes that the exempt estate is evenly distributed over the currently exempt beneficiaries, even though lineal descendants and spouses likely inherit larger inheritances than unrelated persons and more distant relations. Third, the estimate assumes that the ratio of share of returns between Class C and Class D beneficiaries correlates with the size of the tax base for each category.

[xli] Sheila Reynertson, New Jersey Policy Perspective, Modernizing New Jersey’s Sales Tax Will Level

the Playing Field & Help the Economy Thrive, Feb. 2018,

https://www.njpp.org/wp-content/uploads/2018/02/NJPPSalesTaxReformsFeb2018.pdf.

[xlii] For a comprehensive look at New Jersey’s sales and use tax exemptions, see New Jersey Division of Taxation, New Jersey Sales Tax Guide, Tax Topic Bulletin S&U-4, July 2022, https://www.nj.gov/treasury/taxation/pdf/pubs/sales/su4.pdf.

[xliii] To see how New Jersey’s sales tax regressivity is counteracted by its progressive income tax, see Institute on Taxation and Economic Policy, Who Pays? New Jersey State and Local Tax Shares of Family Income (Jan. 2024), https://sfo2.digitaloceanspaces.com/itep/itep-whopays7-New-Jersey.pdf.

[xliv] Testimony of Peter Chen, Senior Policy Analyst, New Jersey Policy Perspective, Before Stay NJ Task Force, March 13, 2024, https://www.njpp.org/wp-content/uploads/2024/05/NJPP-StayNJ-Committee-Testimony-03-13-24.pdf.

[xlv] Based on analysis of data from the Institute on Taxation and Economic Policy.

[xlvi] Based on analysis of data from the Institute on Taxation and Economic Policy.

[xlvii] U.S. Bureau of Economic Analysis, “SAPCE1 Personal consumption expenditures (PCE) by major type of product 1” (accessed Wednesday, October 16, 2024), https://apps.bea.gov/itable/?ReqID=70&step=1&_gl=1*1c592j9*_ga*NDUzNjQ0MzAyLjE3MjY1MTAxMDc.*_ga_J4698JNNFT*MTcyNjUxMDEwNy4xLjAuMTcyNjUxMDEwNy42MC4wLjA.#eyJhcHBpZCI6NzAsInN0ZXBzIjpbMSwyOSwyNSwzMSwyNiwyNywzMF0sImRhdGEiOltbIlRhYmxlSWQiLCI1MjQiXSxbIk1ham9yX0FyZWEiLCIwIl0sWyJTdGF0ZSIsWyIwIl1dLFsiQXJlYSIsWyIzNDAwMCJdXSxbIlN0YXRpc3RpYyIsWyIyIiwiMTMiXV0sWyJVbml0X29mX21lYXN1cmUiLCJMZXZlbHMiXSxbIlllYXIiLFsiLTEiXV0sWyJZZWFyQmVnaW4iLCItMSJdLFsiWWVhcl9FbmQiLCItMSJdXX0=.

[xlviii] U.S. Census Bureau, Survey of U.S. Businesses, The Number of Firms and Establishments, Employment, Annual Payroll, and Receipts by State, Industry, and Enterprise Employment Size: 2017 (2021), available at https://www.census.gov/data/tables/2017/econ/susb/2017-susb-annual.html.

[xlix] New Jersey Division of Taxation, New Jersey Sales Tax Guide, Tax Topic Bulletin S&U-4, July 2022, https://www.nj.gov/treasury/taxation/pdf/pubs/sales/su4.pdf, pp. 14-15.

[l] NetChoice, Big Rental’s Rules of the Road: Tax Loopholes and Sneaky Subsidies, Policy Note, April 2020, https://netchoice.org/wp-content/uploads/2020/04/Turo-VLF-v.3.pdf, p. 9. The $174 million estimate adjusts the annual estimate of $142 million in 2020 for 2024 dollars.

[li] Sheila Reynertson, New Jersey Policy Perspective, Modernizing New Jersey’s Sales Tax Will Level

the Playing Field & Help the Economy Thrive, Feb. 2018, https://www.njpp.org/wp-content/uploads/2018/02/NJPPSalesTaxReformsFeb2018.pdf.

[lii] Pub. L. 2006, c.44.

[liii] Allison Pries, The housing market in N.J. has slowed — except for these types of homes, NJ Advance Media for NJ.com, Mar. 10, 2024, https://www.nj.com/realestate-news/2024/03/the-housing-market-in-nj-has-slowed-except-for-these-types-of-homes.html.

[liv] NJ Stat. Sec, 46:15-7.2 (2023)

[lv] Peter Chen, New Jersey Policy Perspective, Taxing “Super Luxury” Home Sales Could Make New Jersey Affordable for More Residents, Sep. 10, 2024, https://www.njpp.org/publications/blog-category/taxing-super-luxury-home-sales-could-make-new-jersey-affordable-for-more-residents/.

[lvi] Peter Chen, New Jersey Policy Perspective, Taxing “Super Luxury” Home Sales Could Make New Jersey Affordable for More Residents, Sep. 10, 2024, https://www.njpp.org/publications/blog-category/taxing-super-luxury-home-sales-could-make-new-jersey-affordable-for-more-residents/.

[lvii] Michael Mazerov, Center on Budget and Policy Priorities, States Can Fight Corporate Tax Avoidance by Requiring Worldwide Combined Reporting, June 27, 2024, https://www.cbpp.org/research/state-budget-and-tax/states-can-fight-corporate-tax-avoidance-by-requiring-worldwide-0.

[lviii] Josh Bivens, Economic Policy Institute, Reclaiming Corporate Tax Revenues, April. 14, 2022, https://www.epi.org/publication/reclaiming-corporate-tax-revenues/ at figure G.

[lix] Michael Mazerov, Center on Budget and Policy Priorities, The “Single Sales Factor” Formula for State Corporate Taxes, Sept. 1, 2005, https://www.cbpp.org/sites/default/files/archive/3-27-01sfp.htm.

[lx] Michael Mazerov, Center on Budget and Policy Priorities, States Can Fight Corporate Tax Avoidance by Requiring Worldwide Combined Reporting, June 27, 2024, https://www.cbpp.org/research/state-budget-and-tax/states-can-fight-corporate-tax-avoidance-by-requiring-worldwide-0.

[lxi] N.J. Admin. Code § 18:7-21.15 (2024).

[lxii] Richard Phillips, Institute on Taxation and Economic Policy, A Simple Fix for a $17 Billion Loophole: How States Can Reclaim Revenue Lost to Tax Havens, Jan. 17, 2019, https://itep.org/a-simple-fix-for-a-17-billion-loophole/.

[lxiii] The state peaked at 485 auditors in fiscal year 2007.

[lxiv] In Fiscal Year 2007, New Jersey peaked at 485 auditors. See State of New Jersey Budget, Fiscal Year 2008-2009 at D-425. The per auditor assessment is based on the Revised FY 2024 figure in State of New Jersey Budget, Fiscal Year 2025, at D-402.

[lxv] In Fiscal Year 2007, New Jersey peaked at 485 auditors. See State of New Jersey Budget, Fiscal Year 2008-2009 at D-425. The per auditor assessment is based on the Revised FY 2024 figure in State of New Jersey Budget, Fiscal Year 2025, at D-402.

[lxvi] In Fiscal Year 2007, New Jersey peaked at 290 auditors. See State of New Jersey Budget, Fiscal Year 2008-2009 at D-425. The per collector collection is based on the Revised FY 2024 figure in State of New Jersey Budget, Fiscal Year 2025, at D-402.

[lxvii] NJPP analysis and inflation adjustment of state budget data from fiscal years 2004 through 2024. In fiscal year 2009, assessments reached over $1.5 billion in 2024 dollars.

[lxviii] Press Release, Internal Revenue Service, IRS tops $1 billion in past-due taxes collected from millionaires; compliance efforts continue involving high-wealth groups, corporations, partnerships, July 11, 2024, https://www.irs.gov/newsroom/irs-tops-1-billion-in-past-due-taxes-collected-from-millionaires-compliance-efforts-continue-involving-high-wealth-groups-corporations-partnerships.

[lxix] Government Accountability Office, Report to the Chairman, Subcommittee on Oversight, Committee on Ways and Means, House of Representatives, Tax Compliance: Trends of IRS Audit Rates and Results for Individual Taxpayers by Income (May 2022), https://www.gao.gov/assets/gao-22-104960.pdf, pp. 10-16.

[lxx] John Reitmeyer, The List: Tracking NJ’s 10 Credit-Rating Downgrades Under Gov. Christie, NJ Spotlight News, Nov. 21, 2016, https://www.njspotlightnews.org/2016/11/16-11-20-the-list-tracking-nj-s-10-credit-rating-downgrades-under-gov-christie/.

Reforming School Funding in New Jersey: Equity For Taxpayers, Excellence For Students

Executive Summary

There is growing consensus among New Jersey’s legislators, school leaders, educators, and other stakeholders: It’s time for the legislature to implement long-needed changes to its K-12 funding law, the School Funding Reform Act (SFRA). This report provides guidance for revising SFRA, focusing specifically on the issue of school revenues.

New Jersey’s local property taxes are less regressive than in neighboring states; this is, in no small part, due to the state school aid provided by SFRA. However, funding for schools has declined as a percentage of the state’s economy, suggesting there is room for improvement. To raise adequate funding, SFRA advises a local contribution from each school district; however, the calculation of that “Local Fair Share” (LFS) is not transparent, resulting in local tax inequities across otherwise similar school districts.

Specifically, this report examines how factors other than district wealth affect tax equity. Although the former Abbott districts pay less than similar districts in school taxes, their overall local tax burden (which includes municipal taxes) is similar. Disturbingly, districts with larger populations of students of color, especially Latinx/Hispanic students, pay much higher total tax rates than similarly wealthy districts. This report also finds that districts with larger shares of non-residential property raise more local revenue, even though districts are expected to contribute less under SFRA.

Given these findings, this report recommends that New Jersey reevaluate the revenue calculations in SFRA, paying particular attention to the effects on tax equity that arise from setting the property and income rates. The Department of Education should develop a set of indicators to monitor school property tax, total property tax, and overall tax equity, both at the local and state level. Given this report’s findings of inequitable tax rates for communities of color, these indicators should evaluate disparities in tax rates by race, ethnicity, and income.

This report also recommends that, once valid and equitable LFS amounts are calculated, localities should be required by the state to provide that share to their schools if they are below their adequacy threshold — adequacy as defined as the amount of funding needed for a school district to provide a constitutionally mandated, high-quality education — with the understanding that the state will also provide the aid needed for districts to reach their adequacy targets. Districts facing tax increases should be able to phase in those increases over time. To aid in the collection of these local revenues, non-residential properties should be taxed at the regional or state level, allowing for a more equitable distribution of revenues to the districts where they are most needed.

Finally, this report’s appendices include an update of earlier work focused on “adequacy” with a new analysis that supports previous recommendations: SFRA needs to be adjusted to provide more funding to the highest-poverty districts if they are to meet current, more rigorous standards.

Introduction

New Jersey’s public schools rely on a complex system of funding, drawing primarily from local and state taxes, with federal contributions playing a smaller, yet important, role. In 2008, the state’s School Funding Reform Act (SFRA) was enacted to ensure equitable distribution of state resources, particularly for districts with higher levels of poverty. However, the application of SFRA’s Local Fair Share (LFS) formula — determining how much a community should contribute based on its wealth and tax capacity — has led to significant disparities in local taxes.

In 2024, school funding became a contentious issue in New Jersey. Even as the state moved toward fully funding SFRA, some local districts objected to cuts in state aid. While subsequent legislation provided some relief to some of these districts, there is growing consensus that SFRA needs to be overhauled. Lawmakers are expected to propose changes to the formula at the heart of SFRA.

This report focuses on the revenue side of SFRA, examining how much the state expects school districts to raise through local property taxes. Specifically, it offers: (1) guidance on how to set valid “Local Fair Share” amounts for school districts, recognizing that different communities have varying capacities to raise local funds for schools; (2) recommends that SFRA should direct more state aid to communities that maintain relatively high tax rates but have lower property values, limiting their capacity to raise sufficient funds; and (3) suggests that the formula should set local fair share amounts that avoid regressive and inequitable tax rates, while ensuring that schools can secure the necessary revenues to provide a high-quality education.

Before the legislature begins this work, it’s important to take a step back and remember who SFRA affects and why its design is essential not only for school districts but all of New Jersey’s residents. Like all state school funding systems, SFRA was designed with two constituencies in mind:

  1. Students, who need adequately funded schools to receive a quality education
  2. Taxpayers, who should be taxed fairly based on their ability to pay

Regarding students: Statewide school funding systems, like New Jersey’s SFRA, are premised on the fact that different students in different contexts require different amounts of funding to reach the state’s outcome goals. For example, decades of research have shown that students in poverty, on average, require more resources in schools to achieve the same outcomes as more affluent students.[i] Students whose native language is not English or students with learning disabilities also require more resources to have more equitable educational opportunities.[ii]

Based on this research, New Jersey should be driving more resources toward school districts serving a greater number of students in poverty. In the decade before the Great Recession of 2008, the state was, in fact, doing just that: high-poverty districts were, on average, receiving considerably more revenues than low-poverty districts. This changed in 2010 by the end of the Christie administration when New Jersey’s highest- and lowest-poverty school districts were spending roughly the same amount per pupil. Appendix A presents more details.

SFRA was supposed to address the needs of higher-poverty school districts by setting higher funding targets for those districts. However, as previous reports have detailed, New Jersey still does not provide enough revenue for its highest-poverty school districts to meet the state’s current, rigorous educational goals.[iii] Appendix B includes an updated analysis of SFRA’s adequacy targets, revealing that the poverty weights in SFRA continue to be too low to meet state constitutional requirements.

Regarding taxpayers: A fair school funding system considers the wide differences in “tax capacity” — the ability to raise local revenues — between school districts. Keep in mind that local school revenues are raised almost entirely through property taxes. Districts with higher property values, per pupil, have an advantage over others: they can raise the necessary revenue to fund their schools without having to raise tax rates as high as districts with lower property values. Overall, districts with lots of property wealth can maintain relatively low tax rates while still generating the revenue their schools need.

SFRA was adopted, in part, to smooth out unevenness in school funding by providing statewide, systematic, and predictable adequacy budgets for all districts and children — not just the districts that were party to litigation. But SFRA also sets the share of those adequacy budgets that school districts will fund through local property taxes. By setting targets for spending and local revenue, SFRA attempts to allocate state revenues so that school funding is both adequate for students to receive an excellent education and fair for taxpayers.

Paying For Public Schools in New Jersey

Schools rely on three primary sources of revenue: local, state, and federal. As shown below (Figure 1), federal funding is a relatively small part of overall revenues. The majority of federal funding is allocated through programs such as Title I, which drives more revenues toward districts with higher poverty rates. These funds are supposed to “supplement, not supplant” other sources of funding.[iv] As a result, school funding systems focus primarily state and local revenue sources.

Figure 1

School Revenue is Largely Split Between State and Local Sources

Although overall school revenues in New Jersey are split nearly evenly between state and local taxes, the reliance on each revenue source varies widely across individual districts. SFRA requires more affluent districts to contribute more local funding to their schools because they have greater capacity to do so. Some districts get nearly all of their funding from local sources because they have greater property wealth and, therefore, greater tax capacity. Others get the majority of their revenues from the state because their property wealth and, therefore, tax capacity is relatively low. This approach helps to reduce the regressivity of New Jersey’s taxes; however, the current configuration of SFRA still results in substantial inequities in local property taxes. Correcting these inequities, which this report describes below, should be a primary objective of any reforms to SFRA.

To illustrate how different towns have different tax capacities, Table 1 shows data for three towns in Essex County. Millburn, which has very low child poverty, also has very high property values per pupil. Irvington, a town with high poverty, has comparatively low property values, while Belleville falls between the two. Because Irvington has much lower property values, it would have to tax itself at a much higher rate than Millburn to generate the same amount per pupil. In this illustration, the three districts all aim to raise $10,000 per pupil; but Irvington’s tax rate would need to be six times higher than Millburn’s to raise the same amount.

Table 1:

Wealthy Towns Can Afford Lower Property Tax Rates to Raise Similar Amounts of School Revenues: An Illustration from Essex County, NJ

As this example shows, without state aid, districts with low property values would have to pay much higher effective tax rates to fund their schools compared to districts with high property values. SFRA addresses this disparity by calculating a Local Fair Share (LFS): an amount local districts are expected to raise without imposing an undue tax burden. This report explores how SFRA calculates LFS, and how it could improve that calculation.

Appendix C further discusses the mix of taxes states use to fund schools, and the relative advantages or disadvantages of different revenue sources. To summarize: even though property taxes can be regressive, there are good reasons to include them in the mix of revenues used to fund schools. In a related analysis, Appendix D explores New Jersey’s tax effort: the percentage of the state’s economy devoted to K-12 education. Relative to other states, New Jersey does make a strong effort to fund its schools; however, given the decrease in effort following the Great Recession of 2008, there is still room for improvement.

Tax Progressivity in New Jersey and Its Neighbors

A tax system can be classified as either “progressive” or “regressive.” In a progressive tax system, taxes increase as income rises, whereas a regressive tax system requires low-wage workers to pay a greater share of their income in taxes than those with higher incomes. Because different taxes have different effects on tax equity, the mix of tax types in a state will affect its tax progressivity: the average differences in total effective tax rates for taxpayers of different incomes.

It is useful to compare New Jersey to its neighbors when assessing tax progressivity. Table 2 shows that individual property taxation in New Jersey is generally less regressive than Pennsylvania’s, and the lowest-income residents in New Jersey pay lower tax rates than their counterparts in New York. Any reforms of SFRA should not undermine this relative tax progressivity.

Table 2:

New Jersey's Least Wealthy Taxpayers Pay Lower Property Tax Rates Than in Neighboring States: Individual Property Taxes as a Share of Income in New Jersey and NeighborsLocal Fair Share

The core of SFRA’s revenue calculation is Local Fair Share (LFS). The theory behind SFRA’s LFS formula is that there is “fair” amount each community should pay to fund its schools, based on its capacity to raise revenues through local taxes. Once that amount is set, the state then comes in and provides additional funding to help school districts reach their adequacy targets. It’s important to note that until FY 2025, some districts have never received the full funding they were entitled to under SFRA to reach those targets.

Although local school revenues are almost entirely collected through property taxes, the school district’s tax capacity is determined by more than just property values. The LFS formula is:

Local Fair Share = [(District Aggregate Property Value * Property Rate) + (District Aggregate Personal Income * Income Rate)] / 2

Again, the theory behind LFS is that communities with less wealth — and, therefore, less tax capacity — should receive more state aid to fund their schools as they generate less from local property taxes than wealthier communities. This approach aims to make tax rates less regressive, if not fully progressive. However, in practice, the outcome doesn’t always align with this theory. To illustrate, we return to our three districts in Essex County, as shown in Table 3.

Table 3:

In New Jersey, The Wealthiest School Districts, and Some High-Poverty Districts, Have the Lowest School Tax Rates: An Illustration from Essex County, NJ

As expected, Millburn, with its significant property wealth, has a much higher LFS than Belleville, which in turn has a larger LFS than Irvington. But Millburn’s actual tax levy falls well below its LFS; this affluent town doesn’t need to raise taxes to its LFS level to adequately fund its schools and maintain its status as a high-performing district. Belleville, on the other hand, raises nearly exactly what its LFS calls for and has the highest effective school tax rate among the three communities. Unlike Irvington, Belleville was not party to the Abbott rulings; as discussed below, Abbott districts tend to have lower effective school tax rates than non-Abbott districts like Belleville. However, the total tax rates are not systemically lower in Abbott districts (see below), a crucial point when discussing how SFRA should calculate LFS.

Local Fair Share and Taxes

As mentioned above, the SFRA formula calculates a town’s LFS by multiplying its total property value by a property rate, and its total personal income by an income rate. The Education Commissioner determines both the property rate and the income rate. These rates vary annually and play a significant role in determining a district’s LFS and, consequently, the amount of state aid each district receives. By adjusting the rates, the Commissioner has the power to substantially alter the distribution of state aid to schools.

To illustrate the differences between property values and income as used in SFRA, Figure 2 shows (a) local fair share and (b) actual local revenue per pupil in relation to taxable property wealth per pupil; Figure 3 presents the same data but in relation to median household income. Overall, as property values or income increases, LFS and actual revenue also rise. However, the relationship between local fair share and taxable property wealth is stronger than the relationship between local fair share and median household income.[v] Likewise, the relationship between actual revenues and property wealth is stronger than the relationship between actual revenues and income.

Figure 2

New Jersey Expects Wealthier Districts to Pay More in School Taxes

Figure 3

"Local Fair Share" Correlates More Closely with Property Value Than With Income

Both property values and income are indicators of a district’s tax capacity; however, they do not always align perfectly. Figure 2 shows that the relationship between local fair share relationship and taxable property wealth is relatively consistent. As expected, districts with higher equalized property values contribute more toward their adequacy targets. Although some districts raise more than their LFS and others raise less, the variation is relatively minimal.

Figure 3, in contrast, shows the same trend but with a less consistent relationship between income and local share. Many districts are expected to raise relatively more revenues than their income levels would suggest, while others are expected to raise less.

Former Abbott districts, shown with a red marker, are typically very low in both taxable property wealth and median household income. Many of these districts continue to raise local revenue below their local fair share. This is due to primarily three reasons: First, funding to Abbott districts before SFRA was allocated without considering for local capacity, which allowed these districts to maintain very low school taxes — a practice that has persisted under the era of SFRA. Second, the local fair share is not a mandatory requirement; districts are not obligated to raise revenues equal to their LFS if they choose not to. Third, legal limits on tax increases prohibited these districts from raising taxes to meet the LFS requirement. Importantly, and as the analyses that follow show, the low school tax rates in these districts do not necessarily mean they have low total tax taxes.

The differences in the relationship between property values and local share versus income and local share highlight an important aspect of New Jersey’s school funding formula: The property and income rates set by SFRA have profound consequences for both school funding and local taxes. Changing one rate relative to the other will change a district’s LFS, even if the underlying tax capacity of that district remains the same. Again, the Education Commissioner set these rates, with no requirement to provide an explanation for how these rates are determined.

School Taxes vs. Total Local Taxes

School taxes represent only a portion of a locality’s total local taxes; additional revenues for other public services must also be raised through property taxes. Figure 4 shows effective school and total tax rates in relation to the Local Fair Share ratio for school districts.[vi] From left to right, districts generally range lower to higher in taxable wealth and income, which are key factors in determining local fair share requirements.

Effective school tax rates are relatively flat across the spectrum, with a slight increase in the middle. This suggests that state school aid over time has been effective in maintaining lower local school tax rates in the districts with the lowest wealth and income, thereby keeping those rates relatively equitable compared with wealthier districts. However, the same is not true for total property tax rates. Despite achieving some level of equity in local school rates, total local tax rates remain systematically higher in lower-wealth communities.

Figure 4

New Jersey's Local School Taxes Are Flat, but Overall Local Taxes are Regressive

Local Tax Equity

To better understand the effect of SFRA’s formula on tax equity, the authors conducted a series of regression analyses to identify factors associated with differences in (a) local fair share, (b) local revenue per pupil, (c) school tax rates, and (d) total tax rates. The full models, detailed in Appendix E, enable us to isolate the impacts of different district characteristics on tax rates while controlling for other variables. We included measures of taxable wealth per pupil, housing values, and median household income, analyzing data from 2013 to 2020. As expected, local shares and local revenues are higher in higher-income and higher-taxable wealth districts.

Derived from these regression models, Figure 5 focuses on factors associated with differences in local revenue. Former Abbott districts have local fair share expectations in line with their wealth and income (as controlled for in model); however, they generally raise significantly less local revenue per pupil than similar non-Abbott districts.

Figure 5

School Districts with Greater Shares of Black Students Are Expected to Pay Higher School Taxes

Figure 6 provides insight into why Abbott districts raise less revenue: their effective school tax rates are lower than other, similar districts. However, their total local tax rates are roughly equivalent to those of comparable districts. The interplay between school taxes, total taxes, and municipal obligations warrants further study; but for now, it is sufficient to note that total tax rates should be considered in any analysis and reform of the SFRA formula.

Figure 6

School Districts with Greater Shares of Hispanic Students Have Much Higher Local Tax Rates

The most important — but, given previous work, not unexpected — disparity revealed across the figures is that as Hispanic/Latinx enrollment increases, local revenues decline and local tax rates, particularly total tax rates, increase. Earlier NJPP reports have documented funding gaps in predominantly Hispanic/Latinx districts in New Jersey;[vii] the current models here provide additional evidence of this disturbing reality. These models also indicate that even the local fair share calculation disproportionately burdens these communities, holding other factors constant. This disparity is even more pronounced in Black communities, which face higher local share expectations, all else being equal. But it is Hispanic/Latinx communities that face significantly higher local taxation as a result. Reforms of SFRA must include changes that eliminate these persistent and inequitable tax effects on communities of color.

Another key issue involves taxable property wealth that is non-residential (commercial, industrial, etc.). In communities with proportionately more non-residential property, LFS is lower, yet the actual revenues raised are higher. In other words, school districts with more non-residential property raise more in local revenues, even though they are expected to raise less.

The easiest tax for which to gain political support is the tax on someone else. Property taxes on non-residential properties are partially borne by non-local residents: outsiders who don’t access the local schools still pay some school taxes when they conduct business within the district. However, this non-residential taxable wealth is unevenly distributed across taxing jurisdictions, often causing significant revenue-raising disparities. The value of those properties does not depend exclusively on the demand for their products or services within the same jurisdiction (think, for example, Paramus or Cherry Hill shopping areas). As such, school finance experts have long argued that such properties could or should be taxed regionally or statewide to balance these local tax distortions and provide more equitable statewide revenue distribution according to costs and needs across districts.[viii]

Conclusions and Recommendations

New Jersey’s School Funding Reform Act (SFRA) is due for a revision: it is not providing enough funding to the districts that need it the most, and its method for calculating local fair share should be improved.

Regarding the setting of adequacy targets, this report recommends:

  1. Strictly adhere to the schedule of updating the formula every three years, using cost-modeling methods to guide any changes.
  2. Implement data-driven, cost-modeling approaches based on current standards to determine base costs and weights in SFRA. This will increase the weights for poverty in SFRA’s formula, which is necessary for high-poverty districts to receive the revenues needed to meet New Jersey’s current, more rigorous standards. (See Appendix B for more)

Regarding the revenue side of SFRA, this report recommends the following:

  1. The New Jersey Department of Education (NJDOE) should develop a set of indicators to monitor the equity of school property taxes, total property taxes, and overall tax burdens annually.
  2. NJDOE should then use these indicators to evaluate tax disparities related to race, ethnicity, and income of taxpayers and students.
  3. Using these indicators, the state should reassess the property and income rates in the Local Fair Share (LFS) part of the SFRA formula, aiming to establish rates that promote goals of tax equity and progressivity.
  4. Once Local Fair Share amounts are set to reasonable and equitable levels that are not an undue burden on local taxpayers, the state should require school districts that are under SFRA adequacy to raise their full LFS through local taxes. Districts should provide their LFS with the understanding that the state will fully fund SFRA to meet current outcome goals. Again, total local taxes should be accounted for when calculating LFS. If districts need to raise local taxes rates to meet their LFS, those rates should be phased in over time to avoid any shocks to taxpayers.
  5. Regionalize industrial and commercial property taxes to distribute their revenues more equitably and correct racially and ethnically disparate local share requirements.

Appendices

Appendix A: An Update On New Jersey School Funding Equity

When New Jersey adopted the School Funding Reform Act (SFRA) in 2008, the state already had one of the country’s most progressive state school funding systems, targeting substantial additional state funding to the districts, schools, and children that needed those resources most. However, the distribution of state aid was determined largely by decades of litigation (known as the Abbott rulings), resulting in state aid targeted explicitly to only those districts that brought the litigation. While this drove a significant amount of revenue to the school districts that needed it the most, state aid — and its influence on local property taxation — was still uneven: some districts needed more financial help to fund their schools and keep their local taxes equitable.

Unfortunately, the adoption of SFRA was met with the onset of the Great Recession and Governor Chris Christie’s subsequent decision to cut state aid to schools. It is not an overstatement to say that 2008 represents the beginning of the collapse of school funding equity in New Jersey. While recent years have seen some improvement, the consequences of this collapse still affect many New Jersey school children and taxpayers.  

Figure 7 shows how the recession and Christie’s cuts impeded New Jersey’s effort to equitably fund its school districts. In the early to mid-1990s, the ratio of current spending per pupil to state and local revenue per pupil were roughly the same (1:1, or index of 1.0) for districts that had very low child poverty rates compared to those that had very high child poverty rates. This was despite the widely known fact that children in poverty need more school funding to ensure equal educational opportunities.[ix] However, throughout the 2000’s, the Abbott rulings forced the state to increase aid to many high-poverty districts, leading to more equitable funding. This trend reversed during the Christie Administration, and by 2019, New Jersey was back to where it had been in the early 1990s, with school spending becoming essentially flat once again. In recent years, the state’s movement towards fully funding SFRA has at least prevented further erosion; however, there has only been modest progress toward restoring the level of progressive school funding seen in 2008.

Figure 7

The Least Affluent School Districts Used to Get Much More Funding Than the Most Affluent

It’s important to recognize that the erosion of progressivity in New Jersey’s school funding is not solely the result of underfunding SFRA. Under the law, The New Jersey Department of Education is required to prepare an Educational Adequacy Report (EAR) every three years. The EAR is supposed to recalibrate the SFRA formula, adjusting its components to set both appropriate adequacy targets and fair levels of local revenues for schools. However, since the passage of SFRA, the department has either shirked this responsibility (under the Christie administration) or recalibrated the formula without considering factors such as the state’s increasing expectations for student outcomes.[x]

Appendix B: Setting Adequacy Targets: An Update

Previous NJPP reports about SFRA focused largely on how to target “adequacy,” which refers to the amount needed for a school district to provide a constitutionally mandated education that allows students to meet the state’s increasingly rigorous standards.[xi] Here, this report gives an update of this work, using current data to calculate the latest version of these adequacy targets. This analysis finds, once again, that school districts with the highest rates of poverty are not spending enough to meet New Jersey’s new, more rigorous standards.

As described in earlier NJPP reports, SFRA accounts for different student needs through a system where “base amounts” and “weights” are set by the state, resulting in an adequacy target for every school district.[xii] The base amount is the amount of revenue per student a school district needs to educate an elementary school student who is not economically disadvantaged and is not an English Language Learner (ELL). When a district counts its students, each student is “weighted:” students who are economically disadvantaged, ELLs, or in upper grades add more to the weighted student count. That count is multiplied by the base to set the district’s adequacy target. While there are other factors accounted for in SFRA, the base and the weights are at the heart of the law’s adequacy formula.

For SFRA to validly determine how much each New Jersey school district needs, its base amount and weights need to be set correctly. The base weight must reflect the true cost of educating an elementary student so they can achieve the goals the state has set. Likewise, the weights must reflect the additional cost of educating an economically disadvantaged, ELL, or upper-grade student. If the base and weights are wrong, a district will not have the revenues it needs to be able to achieve its outcome goals. The Education Adequacy Report (EAR), which is supposed to update the SFRA base and weights every three years, is, therefore, critically important: it must set the base and weights correctly for schools to receive the funding to be successful.

As noted in previous work, New Jersey has raised its outcome goals for students over the past two decades, but has failed to change its school funding formula to align with these new goals.[xiii] To measure the extent of the problem, previous reports from NJPP have used the National Education Cost Model (NECM).[xiv] Grounded in actual data and time-tested empirical methods, the NECM gives a valid, reasonable estimate of the cost of students achieving, on average, a particular educational outcome. What follows here are the latest NECM cost estimates; see the table at the end of this appendix for model specifications and estimates.

Figure 8 shows the average current spending, SFRA adequacy budget, and NECM-predicted costs by school district poverty quintile from lowest poverty to highest. Regarding existing per pupil spending (the grey bars), the average is just over $20,000, regardless of whether a district is very low in child poverty concentration or much higher. Like in the early 1990s (see Figure 7 above), spending per pupil is currently flat in New Jersey with respect to poverty, despite the presence of a poverty weighting factor in SFRA.

The lighter blue bars represent what SFRA would provide as an “adequacy budget” for each group. Adequacy budgets for low-poverty districts are just over $15,000 per pupil; for high-poverty districts, just over $20,000 per pupil. SFRA is, therefore, somewhat progressive; however, that progressivity is offset by local choices in affluent districts to spend above that level. The fact that low-poverty districts choose to spend much more than their SFRA adequacy targets suggests that those targets are well below what New Jersey residents want for the education of their communities’ children.

Figure 8

High-Poverty Districts Need More Funding to Meet Higher Education Standards

The medium blue bars estimate the per pupil cost — predicted from the NECM — to achieve reading and math outcomes equivalent to the Massachusetts average, which is slightly higher than the New Jersey average, and, as discussed in our previous reports, on track with college and career readiness.[xv] New Jersey school districts with low to moderate levels of poverty currently spend at or above what they’d need to achieve these outcomes (and most of these districts achieve these outcomes). SFRA, however, provides sufficient adequacy budgets only for the state’s more affluent districts.

In contrast, the highest poverty districts continue to show a large gap between what the NECM says they should spend and what they actually do spend. Worse, the gap between what NECM says districts should spend and their SFRA targets is even larger; in other words, SFRA adequacy targets for high-poverty districts are well below where they should be to meet the goals the state has set. As reported in the past, these analyses suggest the poverty weights in SFRA are too low to meet the state’s current, more rigorous standards.[xvi] Properly recalibrating SFRA will require bringing these weights up, using current data and modern costing methods to set valid targets.

National Education Cost Model vs. Current Spending and SFRA Targets

Appendix C: Sources of Revenues

In New Jersey, as in many other states, state and local revenues are collected through different types of taxes. The table below lays out the features of the three main revenue sources for the state: property taxes, sales taxes, and income taxes.

Property taxes are collected primarily at the local level, although sometimes not directly by the school district but by the parent government (city or town), which in turn allocates the revenue to local schools. As illustrated above, property taxes are highly inequitable across localities, meaning that affluent communities often have lower tax rates than those with less property wealth. However, property taxes are also relatively stable in terms of the revenue they generate, making them particularly attractive to school districts because they provide consistent funding regardless of economic fluctuations.

While property taxes can be regressive, they tend to be less so, on average, than sales taxes. Sales taxes are primarily state source taxes but increasingly include local option sales taxes, which in some states make up a substantial share of local revenues. Sales tax revenues are moderately volatile but less so than income tax revenues.

Table 4 summarizes the advantages and disadvantages of different sources of tax revenues. Because each type of tax has its own trade-offs between property, sales, and income taxes, state tax systems tend to rely on some combination of all three.

Table 4: The Pros and Cons of Different Tax Revenue Sources

*Increased use of Local Option Sales taxes

Appendix D: New Jersey’s Tax Effort

School finance researchers often describe the level of state and local funding in terms of effort: the percentage of a state’ or locality’s tax capacity that is spent on schooling. When calculating a state’s effort, tax capacity is often measured as the total personal income for the state; the percentage of that income spent on schools is its effort.

Figure 9 shows the effort of all 50 states to fund schools from 1997 to 2021 with New Jersey highlighted. From 2000 to 2005, New Jersey dramatically increased its effort, coinciding with the targeting of substantial funding to higher-need districts following the Abbott decisions. But like nearly every other state, New Jersey decreased its effort toward funding K-12 education following the Great Recession of 2008—2009. Had New Jersey simply maintained its effort level from 2006 — in other words, made the policy choice to continue spending the same percentage of its economy on K-12 schooling each year — revenue could have been up to 14.3% higher, on average, from 2016 to 2021.[xvii] 

Figure 9

New Jersey's Effort to Fund Schools is Relatively Strong, But Has Declined in the Last Decade

While Figure 9 shows K-12 education revenues as a share of income, Figure 10, below, compares total state and local taxes as a share of income for New Jersey among other states. Although taxes in New Jersey are higher than in many other states, the state is not an extreme outlier, with several other states collecting higher amounts proportionally. Notably, New Jersey ranks somewhat lower on total state and local taxes as a share of income than it does on K-12 effort. In addition, and like K-12 effort, total taxes as a share of income have declined since their pre-recession peak. These analyses suggest that while New Jersey makes a relatively strong effort to fund its public schools, there remains room for improvement.

Figure 10

Total Taxes in New Jersey Have Declined Since the Great Recession

Appendix E: Local Fair Share, Effective Tax Rates (School and Total), and Local Revenue per pupil Models


End Notes

[i] Duncombe, W. D., & Yinger, J. (2005). How much more does a disadvantaged student cost? Economics of Education Review, 24(5), 513–532.

Baker, B. D., Weber, M., & Srikanth, A. (2021). Informing Federal School Finance Policy with Empirical Evidence. Journal of Education Finance, 47(1), 1–25.

Jackson, C. K., & Mackevicius, C. L. (2024). What Impacts Can We Expect from School Spending Policy? Evidence from Evaluations in the United States. American Economic Journal: Applied Economics, 16(1), 412–446. https://doi.org/10.1257/app.20220279

[ii] Augenblick, Palaich and Associates. (2011). Analysis of New Jersey’s Census-Based Special Education Funding System. http://nj.gov/education/sff/sereport.pdf

[iii] Baker, B.D. and Weber, M.A. (2023) Unlocking Academic Success: Revitalizing New Jersey’s School Funding Formula for Student Achievement. New Jersey Policy Perspective. https://www.njpp.org/publications/report/unlocking-academic-success-revitalizing-new-jerseys-school-funding-formula-for-student-achievement/

[iv] New Jersey Department of Education, Title I, Part A, Supplement Not Supplant Guidance  https://www.nj.gov/education/title1/resources/docs/TitleISupplementnotSupplantGuidanceDocument.pdf

[v] “Median household income” is a different measure than what is used for SFRA’s formula: SFRA totals the district’s residents’ income and multiplies it by the rate. We use median income here as it better approximates the relationship between local share and the “typical” household income for a district.

[vi] “Local Fair Share ratio” is the calculated LFS amount of revenues from local sources vs. the amount from state sources. An LFS ratio of 1 (1:1) means the calculated LFS is equal to the amount from state sources; an LFS ratio of 0.5 (1:2) means the calculated LFS is equal to one-half of the amount from state sources. As tax capacity rises, the LFS ratio will also rise; for example, districts with a LFS of 2 will have greater property wealth and income—and, consequently, tax capacity—than districts with an LFS of 0.5.

[vii] Baker, B.D. and Weber, M.A. (2022) Separate and Unequal: Racial and Ethnic Segregation and the Case for School Funding Reparations in New Jersey. New Jersey Policy Perspective. https://www.njpp.org/publications/report/separate-and-unequal-racial-and-ethnic-segregation-and-the-case-for-school-funding-reparations-in-new-jersey/

[viii] Brent, B. O. (1999). An analysis of the influence of regional nonresidential expanded tax base approaches to school finance on measures of student and taxpayer equity. Journal of Education Finance, 24(3), 353-378.

Ladd, H. F., & Harris, E. W. (1995). Statewide taxation of nonresidential property for education. Journal of Education Finance, 21(1), 103-122.

Ladd, H. F. (1976). State-wide taxation of commercial and industrial property for education. National Tax Journal, 29(2), 143-153.

[ix] See Footnote #1.

[x] Baker, B.D. and Weber, M.A. (2022) New Jersey School Funding: The Higher the Goals, the Higher the Costs. New Jersey Policy Perspective. https://www.njpp.org/publications/report/new-jersey-school-funding-the-higher-the-goals-the-higher-the-costs/

[xi] Baker, B.D. and Weber, M.A. (2023) Unlocking Academic Success: Revitalizing New Jersey’s School Funding Formula for Student Achievement. New Jersey Policy Perspective. https://www.njpp.org/publications/report/unlocking-academic-success-revitalizing-new-jerseys-school-funding-formula-for-student-achievement/

[xii] Baker, B.D. and Weber, M.A. (2020) School Funding in New Jersey: A Fair Future for All. New Jersey Policy Perspective. https://www.njpp.org/publications/report/school-funding-in-new-jersey-a-fair-future-for-all/

[xiii] Baker, B.D. and Weber, M.A. (2023) Unlocking Academic Success: Revitalizing New Jersey’s School Funding Formula for Student Achievement. New Jersey Policy Perspective. https://www.njpp.org/publications/report/unlocking-academic-success-revitalizing-new-jerseys-school-funding-formula-for-student-achievement/

[xiv] Baker, B. D., Weber, M., & Srikanth, A. (2021). Informing Federal School Finance Policy with Empirical Evidence. Journal of Education Finance, 47(1), 1–25.

[xv] Baker, B.D. and Weber, M.A. (2022) New Jersey School Funding: The Higher the Goals, the Higher the Costs. New Jersey Policy Perspective. https://www.njpp.org/publications/report/new-jersey-school-funding-the-higher-the-goals-the-higher-the-costs/

[xvi] Baker, B.D. and Weber, M.A. (2023) Unlocking Academic Success: Revitalizing New Jersey’s School Funding Formula for Student Achievement. New Jersey Policy Perspective. https://www.njpp.org/publications/report/unlocking-academic-success-revitalizing-new-jerseys-school-funding-formula-for-student-achievement/

[xvii] School Finance Indicators Database, State School Finance Profile, New Jersey, 2020-21 School Year https://www.schoolfinancedata.org/wp-content/uploads/2024/01/profiles24_NJ.pdf