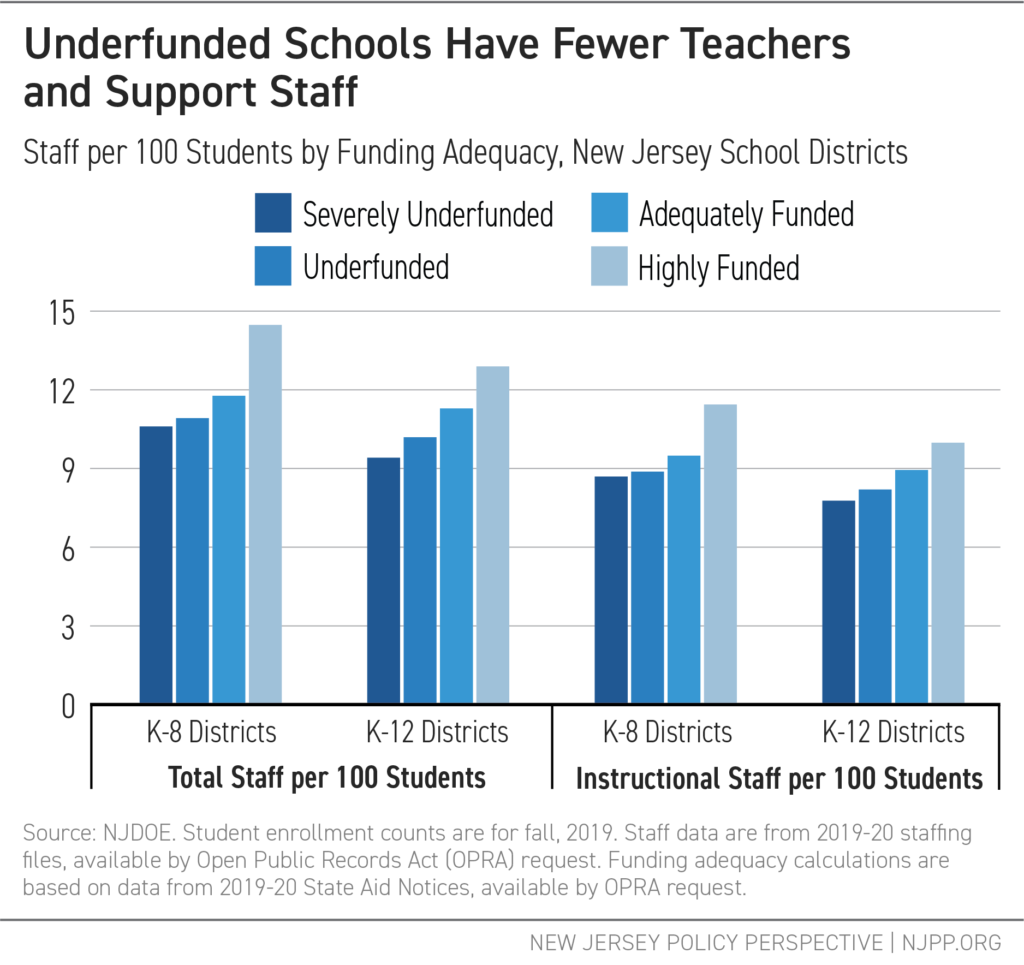
Executive Summary
“. . . A rational statewide drug policy requires that the coercive force of the criminal justice system be used constructively to influence far more people, numbering in the millions, than could ever be arrested, adjudicated, and sentenced.”
— New Jersey Office of the Attorney General, 1990
“We are no longer locking up this disease. We’ve acknowledged — and it’s a cliché now because we’ve said it so many times — that we’re not going to arrest our way out of this problem. But we mean it. We’re walking the walk and we’re taking that public health approach to this crisis.”
— New Jersey Office of the Attorney General, 2020
Report Overview
On the 50th anniversary of President Nixon’s declaration of a War on Drugs, it is time for New Jersey to “Just Say No” to an expensive, ineffective, racially discriminatory war against its residents.
In 2021, the need for investment in public health, racial equity, and economic well-being for New Jersey’s families is more urgent than ever. New Jersey’s overdose and COVID-19 crises created a “pandemic within a pandemic,” and residents have borne the consequences of years of underinvestment in New Jersey’s public health infrastructure. At the same time, the growing Movement for Black Lives makes clear the urgency of addressing head-on policies that fuel racial injustice, police violence, and the murder of Black residents.
This report highlights state budget spending dedicated over the past decade to arrest, prosecute, and incarcerate residents for drug war violations. This analysis is contextualized with the racist origins of drug war policies, comparisons of New Jersey’s drug war spending to spending on public health, and the stories of residents directly harmed by the drug war.
New Jersey Invested $11.6 Billion to Enforce the Drug War (2010-2019)
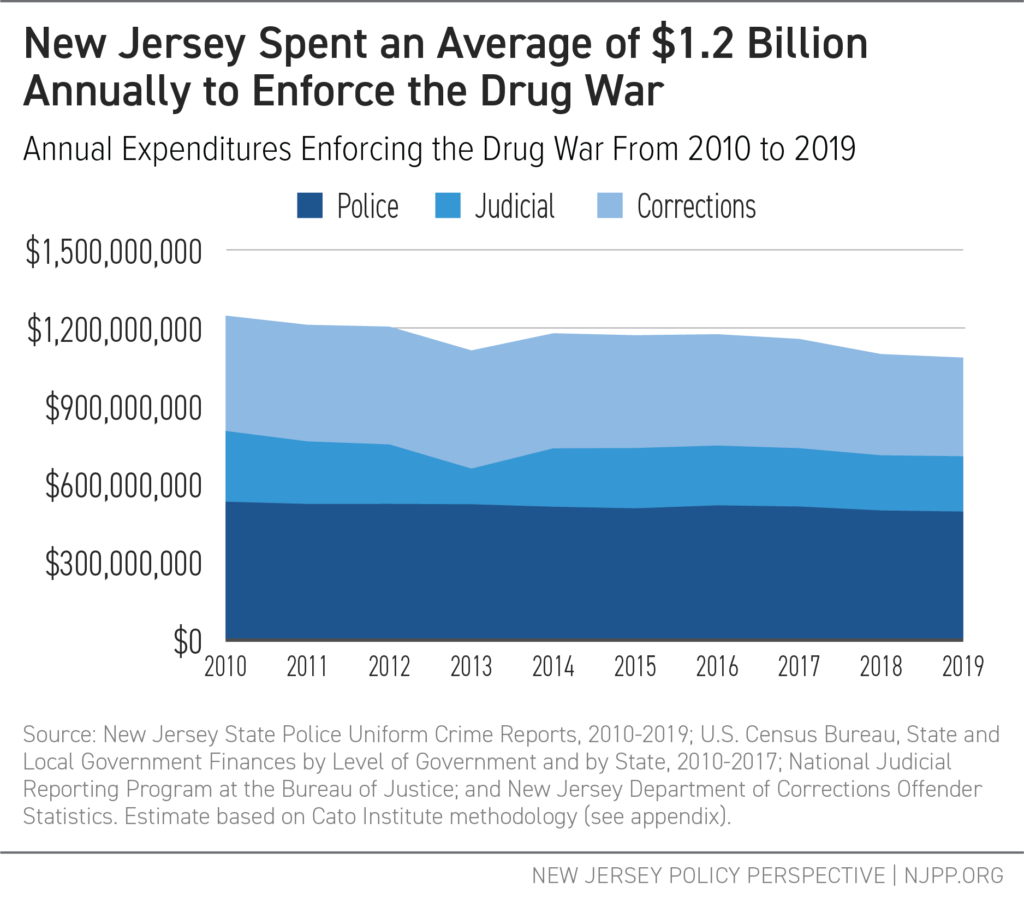
New Jersey spent at least $11.6 billion (2020 dollars) over the past decade to enforce the drug war, amounting to an average of $1.2 billion annually. By type of expenditure, the state invested:
- $5.1 billion to arrest people
- $2.2 billion to prosecute people
- $4.3 billion to incarcerate people
Drug Criminalization is Rooted in Racial Discrimination
Policies that criminalize drug use and possession are connected to racial discrimination and economic scapegoating, targeting people of color and immigrants. As a result:
- New Jersey incarcerated a higher percentage of people due to the drug war than any state in the nation by 1989.
- Black residents are 12 times more likely, and Hispanic/Latinx residents two times more likely, to be incarcerated than white residents. New Jersey now leads the nation in racial disparities in incarceration.
- New Jersey increased drug-war arrests, with one in five arrests being for a drug war violation. Most of these arrests do not decrease drug use or distribution.
- Black residents are 3.3 times more likely to be arrested for drug war violations than their white peers, despite white people both using and selling criminalized drugs at higher rates.
New Jersey’s Drug War is Premised on Misconceptions About Drug Use
Policymakers frequently advocate for prohibition to justify ongoing investments in the drug war. However, prohibition has not led to reductions in drug use, only increases in arrests. The report explains that:
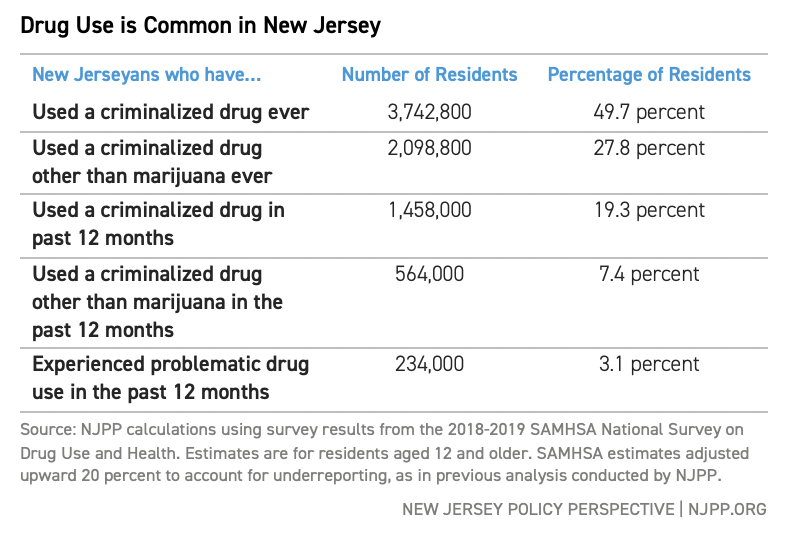
- Over two million New Jersey residents will use a criminalized drug other than marijuana in their lifetime, and over half a million have done so in the past year.
- Of those who used a criminalized drug in the past year, 84 percent did not experience any problems, including substance use disorder; 16 percent reported experiencing problems.
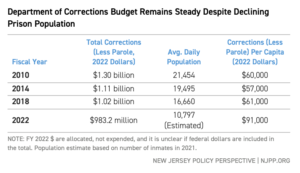
- If everyone who used an opioid, heroin, methamphetamine, or medicine not prescribed to them last year was arrested, it would take over 8,300 NJ Transit buses to transport everyone.
- The social and economic conditions of people’s lives influence the risks of drug use, i.e., conditions that can be improved by policies that promote racial, economic, and social justice.
- People who have access to harm reduction programs are five times more likely to connect with drug treatment than those who do not and three times more likely to stop problematic drug use.
New Jersey Spends More on the Drug War Than Public Health Approaches to Drug Use
In 2019, New Jersey’s investment in the drug war was 8.5 times greater than what the state budget allocates for addiction services and 27.9 times greater than spending on rental assistance, homeless shelters, homelessness prevention, and lead abatement combined.
Despite this investment, nearly 20,000 New Jerseyans died of a drug-related overdose between 2010 and 2019. In 2019, the rate of overdose deaths for white residents was 2.1 times greater than it had been in 2010; for Black residents, this rate was 3.6 times greater; and for Hispanic/Latinx residents, it was 3.8 times greater.
Policy Recommendations
New Jersey policymakers can take essential steps toward dismantling the drug war by enacting the following:
- Decriminalize all drug use, personal possession, and low-level drug sales.
- Make data about drug war enforcement publicly available and easily accessible, and regularly publish racial and gender impact analyses.
- Conduct an audit of all public agencies to identify and reform punishment-based policies, practices, and regulations that discriminate against or exclude people who use drugs.
- Invest in equitable, evidence-based drug policies that prevent problematic drug use and promote the health and well-being of people who use drugs.
- Substantially invest in Black and Hispanic/Latinx communities most harmed by drug war arrests.
|
Introduction
“The War on Drugs is a war on people.” — Caitlin O’Neill[1]
Fifty years ago, President Nixon launched a War on Drugs that has proven ineffective and actively harmful to the public health and well-being of both individuals and communities.[2] During this drug war, rates of drug use have not changed substantially, prices of criminalized drugs have plummeted, and drug war punishments target Black and Hispanic/Latinx residents.[3] As a result of targeting these communities, the drug war is often called the “new Jim Crow.”[4]
Justification for the drug war is premised on the misconception that criminalized drugs are too dangerous to be used safely.[5] In reality, most people who use drugs, including heroin, cocaine, and methamphetamine, do so without experiencing a substance use disorder.[6] And for people who do live with substance use disorders, the drug war increases the risk of overdose deaths and makes it harder to access harm reduction and treatment services.[7]
The drug war has also strained state and local budgets. Over the past ten years, this report finds that New Jersey has spent at least $11.6 billion on enforcing the drug war, a policy choice that is shown to divert funding from program, and services that enable people who use drugs to stay healthier and safer, such as adequate and affordable housing and free physical and mental healthcare.[8] At the same time, drug war policies have extended beyond the criminal justice system into other vital systems and services like education, immigration, social safety net programs, health care, housing, and child welfare.[9]
In 2020, the nation took historic steps forward in dismantling the War on Drugs.[10] Oregon became the first state to decriminalize all drugs, including heroin, cocaine, and methamphetamine, while investing in harm reduction and drug treatment services.[11] New Jersey also decriminalized marijuana and legalized recreational use, joining 13 other states.[12] In an effort to repair the harms of the drug war, New Jersey will also dedicate 70 percent of cannabis sales tax revenue for communities targeted by racially discriminatory marijuana prohibition.[13]
The year 2020 also brought the most egregious aspects of the drug war and racial injustice into sharp focus. The Movement for Black Lives, arguably the largest social movement in U.S. history, brought increased attention to the murders of Black people at the hands of the police and the role that the drug war plays in militarizing police forces and providing pretexts for police brutality.[14] The pandemic also made clear that racism itself is a public health issue, with housing and economic segregation making COVID-19 deadlier for Black, Hispanic/Latinx, and Asian residents than for their white counterparts.[15] People — especially low-paid workers and Black and Hispanic/Latinx residents — have reported starting or increasing drug use during the pandemic to cope with stress, economic uncertainty, and grief.[16] People living with a recent substance use disorder (SUD) are at greater risk of COVID-19, and Black residents living with a SUD were more likely to be hospitalized and die from COVID-19 than their white peers.[17]
Due to a growing consensus among the public, academics, and policymakers that the drug war has failed, New Jersey has the opportunity to fundamentally reconsider its investment in the drug war and to shift its investment to policies that prioritize public health over punishment. To evaluate the effects of the drug war, this report analyses the overall budgetary investment New Jersey has made to enforce the drug war through arrests, prosecutions, and incarceration over the past decade. This report then compares spending on the drug war to investments made in public health and drug treatment and analyses overdose deaths and racial disparities in drug war arrests.
This budgetary analysis is preceded by a brief history of drug criminalization, which shows how the drug war is rooted in racial discrimination and economic scapegoating rather than the risks associated with criminalized drugs themselves. The report also examines the extent to which drug war arrests have become commonplace in New Jersey and evidence that debunks common misconceptions about drug use. Ultimately, the report concludes with policy recommendations on how New Jersey can further dismantle the drug war and invest in healing, public health, and the economic and social well-being of all residents, including residents who use and sell drugs and Black and Hispanic/Latinx communities most harmed by drug war enforcement.
Please refer to the appendix for more information about the report’s methodology and acknowledgments of the many contributors who made this research possible.
Content Note
Throughout the report are stories shared by New Jersey residents directly harmed by the drug war. Their stories are intended to ground budgetary analysis in the human toll of New Jersey’s drug war policies. Some include descriptions of discrimination, assault, and harms caused by drug war policies. Many people shared stories about how they are working to reduce and challenge the harms caused by the drug war, as well as the moments of joy, family, and relationships that helped them endure the failings of the drug war.
Drug Policy Definitions: Commonly Used Terms
Drug war: An umbrella term for public policies that prioritize eliminating certain drug use through punishments and penalties, instead of a public health approach that centers risk reduction and individual and community well-being.[18] Drug war policies, sometimes called “drug prohibition,” prohibit the possession, distribution, and sale of substances for which someone does not have a medical prescription.[19] While many drug war policies are through the legal system, they are also at the administrative or organizational level. Examples include mandatory drug tests designed to exclude people from opportunities (e.g., housing, employment, and scholarships), abstinence requirements to receive housing or social services, and administrative discharge from a drug treatment program for urine tests that indicate continued drug use.[20]
Drug decriminalization: The removal of criminal penalties for people who buy and/or use drugs and possess related paraphernalia and, possibly, people who sell or distribute drugs.[21] Comprehensive drug decriminalization would encompass removal of all criminal penalties along with civil legal, immigration, medical, and social service penalties (e.g., fines and fees, ineligibility for naturalization, exclusion from health services, and disqualification for housing or income benefits).[22] Multiple pathways to decriminalization, include:
- Legal or legislative approaches, such as changing the criminal code to remove bans on drug possession or sale. This method is called de jure decriminalization.[23]
- Changing policies and practices not dictated by legislation, such as prosecutor directives to stop prosecutions for drug violations or police directives to stop arrests for drug violations. This method is called de facto decriminalization.[24]
Drug legalization: The creation of legal pathways and regulatory oversight for adult use, purchase, manufacture, and distribution of criminalized drugs.[25] Like other markets, equitable legalized drug frameworks include protections for workers and consumers, taxation, investments in communities disproportionately impacted, and safeguards to ensure the market is non-exploitative and acting on behalf of the public good.[26]
Racism: This report uses the definitions of racial discrimination and racism offered by Dr. Carl Hart: “an action that results in disproportionately unjust or unfair treatment of persons from a specific racial group. Malicious intent is not required — I don’t care to know what’s in your heart or head. What is required is that the treatment be unjust or unfair and that such injustice is disproportionately experienced by at least one racial group.”[27]
Drug: A substance other than food that alters the mind or body in some way.[28] A criminalized drug is against criminal law to possess, distribute, or manufacture.[29] Drugs can also be partially criminalized, meaning that some people can legally possess that drug (for example, with a prescription from a healthcare provider), while others can be punished.[30]
Drug paraphernalia: The equipment or tools used to introduce a drug into the human body (e.g., pipe, syringe, wine glass).[31] Different ways of using a drug (e.g., drinking, smoking, injecting) come with benefits and risks.[32] Possession and use of some types of paraphernalia may be criminalized. For example, police in New Jersey made 3,500 arrests for syringe possession in 2020 alone.[33]
Chaotic or problematic drug use: Drug use that a person identifies as causing problems, harms, or instability in their lives, whether to relationships, physical or emotional health, or quality of life.[34] Contrary to drug war messaging, not all criminalized drug use is problematic, and it is a best practice in public health for people to self-define problems or concerns, if any, related to their drug use.[35] This approach reduces stigma, increases the chance that people will be comfortable asking for support, and increases the likelihood that someone will find support suited to their needs.[36]
Substance use spectrum: The broad continuum of drug use from abstinence, to episodic use without any issues, to chaotic or problematic use. The spectrum also includes drug use that is symptomatic of a substance use disorder (SUD).[37] The type, frequency, quantity, potency, and route of administration (e.g., smoking, snorting, drinking, injecting, or eating) of substances used varies from person to person, and changes for a person across time.[38]
Substance Use Disorder (SUD): A treatable chronic health condition defined by compulsive use of a substance.[39] The DSM-5, a diagnostic and statistical manual of mental health conditions, includes ten classes of drugs that can meet the diagnostic criteria for a SUD: alcohol; caffeine; cannabis; hallucinogens; inhalants; opioids; sedatives; stimulants; tobacco; and others.[40] Symptoms of a SUD include continuing drug use despite wanting to stop and continuing to use despite problems associated with use.[41] This pattern of compulsive behavior extends beyond SUD with chronic health conditions that involve compulsive shopping, gambling, sex, and eating.[42]
Note that SUD is the most accurate, up-to-date term for what many people refer to as “drug addiction.” The terms “addiction” and “abuse” to describe SUD, and “addict” and “abuser” to describe someone living with a SUD, are found to increase stigma an individual internalizes about themselves and result in inadequate treatment by healthcare professionals.[43] See appendix for language best practices.
Drug dependence: A physiological outcome that can occur due to drug use, whether prescribed by a doctor or criminalized by law. Symptoms include withdrawal effects after continued use; withdrawals can be managed by tapering use.[44]
People who are prescribed a medication that involves physical withdrawal effects are experiencing physical dependence, which is markedly distinct from the experience of a SUD.[45] This is also true of babies who experience physical withdrawal effects if their parents used certain drugs, whether prescribed or criminalized, during pregnancy.[46] For both babies and adults, these withdrawal symptoms can be safely treated and do not have long-term impacts on health.[47]
Harm reduction: Programs and services that support people wherever they are on the continuum of substance use in setting self-directed goals, using a trauma-informed approach that recognizes the complexity of individual reasons for drug use.[48] At the same time, a harm reduction approach advocates for policies that address the U.S. legacies of enslavement and exclusion that continue to harm people Black, Hispanic/Latinx, and people with low-or-no income who use drugs and sell drugs.[49]
|
Section 1
Policy History: Racist Origins of Drug Criminalization
“… Once the War on Drugs, so to say, really kicked off, then our neighborhoods became carceral spaces with militarized police officers. The trauma that came with all of a sudden seeing tons of police officers come into our neighborhood every day, different police officers, it was an unraveling.”
— Stephon Whitley[50]
The history of drug criminalization illustrates that many drug policies are not premised on any scientific-based risk assessment but rather on who is associated with a given drug. Many drug policies are connected to racial discrimination and economic scapegoating, targeting people of color and immigrants. What follows is an abridged timeline of key events in U.S. history that underpin today’s drug war policies and motivations.
Timeline of Drug Criminalization
Opium Panic (Late 1880s – Early 1900s)
During the mid to late 1800s, Chinese immigration to the United States increased to meet the demand for workers in mines and to build railroads.[51] With the economic depression of the 1870s, European immigrants and white workers competed for jobs traditionally held by Chinese residents, causing rampant anti-Chinese sentiment.[52] In response, state and local governments passed laws criminalizing opium because Chinese immigrants were linked to smoking it;[53] however, residents of all races and classes used opium at the time.[54] Anti-opium laws were also motivated by racial segregation, with laws designed to prevent Chinese and white residents from using opium together.[55] Eventually, the U.S. would pass the first federal drug prohibition law banning the importation of opium for smoking in 1909.[56] More than a century later, anti-Asian racism is still felt today as many Asian residents are being scapegoated for the COVID-19 pandemic.[57]
Cocaine Panic (Late 1800s - Early 1900s)
Many white residents used cocaine at the dawn of the 20th century, as did Black workers in the U.S. South as a stimulant for the long hours of labor in an exploitative sharecropping system.[58] As a method of social control of Black residents who increased their political and economic influence during the Reconstruction era,[59] public leaders and white-led newspapers stoked white racial fears by depicting patently false images of “crazed” Black men attacking white women as a result of their cocaine use.[60] These racist associations, in turn, amplified the calls for policymakers to pass state and federal laws criminalizing cocaine.[61]
Marijuana Panic (1920s – 1930s)
The Great Depression further fueled fears of and resentment toward Mexican immigrants and people of color.[62] During this period, cannabis and hemp were in relatively common use by people of all races and ethnicities, yet portrayals in the media and by government officials created a strong association between the drug and people of color.[63] The Federal Bureau of Narcotics stoked racialized fear of marijuana through a persistent public relations campaign, including press releases stating “fifty percent of the violent crimes committed in districts occupied by Mexicans, Spaniards, Latin Americans, Greeks, or Negroes may be traced to this evil [of marijuana].”[64] Federal policymakers criminalized marijuana use as a result of this new racialized narrative.
Heroin Panic (1960s – 1970s)
Heroin use increased among white, Black, and Hispanic/Latinx residents during the 1960s. Yet, white policymakers and white-led media associated heroin use with Black and Hispanic/Latinx people.[65] Because drug use was framed as “weak” or “immoral” and associated with residents of color, policymakers did not increase public health and drug treatment services.[66] Organizations like the Black Panthers and Young Lords started free, community-based harm reduction, treatment, and health care services to fill this gap.[67] Looking back, a major cause of increased heroin use among Black and Hispanic/Latinx residents in urban centers was the decline of good-paying jobs and racist real estate practices that prompted “white flight” to suburbs.[68]
At the same time, policymakers were raising the alarm about heroin use among veterans, focusing on heroin itself and not the traumas of warfare. While more than four out of ten U.S. soldiers in Vietnam used heroin or opium during their tours of duties, only one out of 100 experienced problematic heroin use after their first year returning home.[69]
War on Drugs (1971)
President Richard Nixon declared drugs “public enemy number one,” opening the floodgates for harsh federal drug enforcement policies like mandatory minimum sentences and no-knock warrants.[70] As with previous drug criminalization policies, the War on Drugs was never designed to keep people safe from the potential risks of drug use.[71] Nixon’s chief policy advisor, John Ehrlichman, exposed how the War on Drugs was designed for political gain and to reduce the political influence of Black residents and anti-war activists.[72] Ehrlichman shared in a 1994 interview:
“The Nixon campaign in 1968, and the Nixon White House after that, had two enemies: the antiwar left and Black people. You understand what I’m saying? We knew we couldn’t make it illegal to be either against the war or Black, but by getting the public to associate the hippies with marijuana and Black [people] with heroin. And then criminalizing both heavily, we could disrupt those communities … We could arrest their leaders, raid their homes, break up their meetings, and vilify them night after night on the evening news. Did we know we were lying about the drugs?
Of course we did.”[73]
Turbocharged Drug War (Mid-1980s – Late 1990s)
In 1986, President Ronald Reagan doubled down on Nixon’s drug war, calling for a “great, new national crusade” and asking people across the nation to generate “an outspoken intolerance for drug use.”[74] The federal government incentivized states like New Jersey with funding to dramatically scale up the widespread arrest of people who use or sell drugs at a time when overall criminalized drug use was declining.[75]
As a result, in 1989, there were about 1.36 million drug war arrests nationwide, a 134 percent increase from the 581,000 drug war arrests in 1980.[76] Broken down by race: over this period, Black residents went from approximately three times more likely to be arrested for drug possession to over five times more likely, as compared to white residents.[77] This is evidence of racial discrimination, as Black and white residents use criminalized drugs at similar rates.[78]
In 1986, anti-Black discrimination among policymakers and the media resulted in widespread panic and escalation of punishments to eradicate crack cocaine use. For example, the mandatory period of incarceration for possession of five grams of crack cocaine (the weight of two pennies) was equivalent to 500 grams of powder cocaine — despite having no pharmacological differences between the two.[79] The affordability of crack cocaine made it more accessible than powder cocaine to low-paid workers and Black residents with less wealth and disposable income than white residents.[80]
While Reagan’s turbocharged drug war most visibly ballooned the arrests and incarceration of Black and Hispanic/Latinx residents, it also ballooned drug war punishments in education, child welfare, immigration, and housing.[81] For instance, the drug war became a major driver of deportation and children removed from their homes.[82] Today, research finds that the health consequences of children born in the midst of the crack cocaine panic are attributed to poverty resulting from exclusionary economic, housing, and social policies, not crack cocaine use during pregnancy.[83] In 2018, the New York Times apologized for its role in fueling a misinformed panic.[84]
Overdose Crisis (Late 1990s – Present)
Decades of racialized, punishment-based drug policy worsened the contemporary overdose crisis.[85] Between 1999 and March 2021, 841,000 people across the U.S. died from drug-related overdoses.[86] As a result, life expectancy for U.S. residents declined in 2015 for the first time in decades.[87]
The media has predominantly covered the overdose crisis as an issue facing white people — and white people, especially working-age people, have faced severe loss during the crisis. Research shows that, like the experience for Black and Hispanic/Latinx during the earlier heroin panic, loss of good-paying jobs, the decline of unions, and the destabilizing impact of economic decline contribute to increased overdose deaths.[88] Yet, since 2013, Black people have been dying from opioid-related overdoses at faster-growing rates than their white counterparts. As a result of the racialized drug war that prioritized investments in punishment over public health, Black people living with an opioid use disorder (OUD) are 77 percent less likely to have access to buprenorphine (a gold-standard medication for OUD) than white people.[89] Moreover, generations of disinvestment in public transportation, housing, and public health services in Black communities make it more difficult for Black people who use drugs to access care.[90]
New Jersey Embraced the War on Drugs
With President Reagan’s turbocharged drug war, the federal government incentivized states to crack down on any perceived criminalized drug use and distribution. For this reason, the drug war is largely a local affair — most drug arrests occur at the state and local, not the federal level.[91] And, for its part, New Jersey enacted some of the most punitive, wide-reaching drug war punishments in the nation.[92]
In 1987, New Jersey passed the Comprehensive Drug Reform Act (CDRA),[93] moving drug policy from the state’s health code to its criminal code and creating what the New York Times described as “some of the toughest drug legislation in the nation.”[94] The CDRA created mandatory minimum sentences for drug war violations, increased the number and severity of drug-war punishments, and established extensive fines and fees.[95] When the CDRA went into effect, it was also accompanied by a voter-approved $198 million bond (or $459.3 million, 2020 dollars) to build prisons.[96] Notably, not a single dollar was allocated for harm reduction or drug treatment services.[97]
Between 1986 and 1989, New Jersey’s drug war arrests increased by 71 percent.[98] By 1992, approximately one in three people incarcerated in New Jersey were due to drug policy violations, the highest percentage in the nation, compared to the national average of one in five.[99] Of the incarcerated, a 1995 analysis found that: 8,000 people had no prior violent criminal arrests; 2,000 people had no criminal history; and that most, six out of ten, were living with a substance use disorder.[100]
These policies resulted in targeting Black and Hispanic/Latinx residents who, despite using and selling drugs at similar or lower rates than their white counterparts, were and continue to be punished more frequently and harshly than white residents.[101] In 2016, New Jersey led the nation in racial incarceration disparities. Black New Jerseyans were 12.2 times more likely to be incarcerated than their white counterparts, and Hispanic/Latinx residents were two times more likely.[102]
In addition to fueling racial disparities, the drug war did not decrease drug use,[103] but it did stall needed public health policies to support people who use drugs.[104] By 1995, over half of new HIV infections in New Jersey were from injection drug use.[105] New Jersey’s failure to adopt lifesaving syringe access programs was directly related to policymaker concern that harm reduction expansion ran counter to the explicit drug war goal of eradicating all drug use.[106] By 2006, when the New Jersey Legislature provisionally legalized syringe access, the state had the highest HIV rate among women and the third highest among children in the nation.[107] New Jersey was the last state to integrate some form of harm reduction programs, despite the high death rates from HIV/AIDs of LGBTQ+ residents, Black and Hispanic/Latinx residents, and residents who inject drugs.[108]
For specific examples of drug war policies in New Jersey that contradict public health best practices, see the appendix.
Beyond the Numbers: Stephon Whitley
I lived in an urban neighborhood in northern New Jersey where drugs were sold and people hung out. I remember when the War on Drugs hadn’t really gotten off and so there was true community policing.
The first thing that sticks out to me is how much the policing changed. When there was still community policing, you literally had the same two police officers walk the beat in our neighborhood every single day. Everyone knew them. They knew everyone by name and things were very respectful, but once the War on Drugs, so to say, really kicked off, then our neighborhoods became carceral spaces with militarized police officers. The trauma that came with all of a sudden seeing tons of police officers come into our neighborhood every day, different police officers, it was an unraveling experience.
One thing a Black male is often taught is that you have to walk a thin line because you are always in jeopardy when it comes down to the police officers, possibly losing your life … It was a lot of trauma because anytime you don’t know whether your life is in jeopardy or not, it’s just a scary moment.
My family actually sold marijuana out of the household. My mom and my stepfather sold small amounts of marijuana just to pay the bills.
My first direct experience of what came with mass incarceration, the drug war, was, I remember at the age of 12, all of a sudden we heard a banging on our door one night. My stepfather went to the doorway. The police was saying, ‘Open the door,’ but they were banging very aggressively, trying to push the door in. My stepfather was holding the door, holding the door, trying to stop them.
He stepped back or whatever happened, I’m about 15 feet away from him. The door burst open and the police started shooting and basically shot him in his shoulder, handcuffed him, and then laid him on the carpet, bleeding, as they searched our apartment for what felt like hours. Probably it was only about 30 minutes, but it still was a very long time. They tore the house up and the whole time he was bleeding, no ambulance, no type of medical assistance, no checking on him to see if he was okay. Just me sitting there watching my mother trying to use rags to stop the bleeding or slow things down.
That right there is one of the things that really sat with me and made me say, ‘Okay. This thing is serious. Things are changing and my life will never be the same again.’
— Stephon Whitley is a community organizer and scholar of the criminal legal system from Newark who spent 20 years incarcerated with the New Jersey Department of Corrections. His mother, raised in a family of sharecroppers in North Carolina, found work in factories in northern New Jersey. As the factories began to close, she and Stephon’s stepfather relied on selling marijuana to provide for their children.
|
Section 2
Drug War Arrests in New Jersey
“I call it the trap of the trap.” – H-Dub
In recent years, New Jersey policymakers have started calling for a public health approach to drug use and are questioning the efficacy of drug-war punishments altogether. For example, in January 2020, Attorney General Gurbir Grewal stated in response to overdose fatalities, “We are no longer locking up this disease. We’ve acknowledged — and it’s a cliché now because we’ve said it so many times — that we’re not going to arrest our way out of this problem. But we mean it. We’re walking the walk and we’re taking that public health approach to this crisis.”[109] In November 2020, Governor Phil Murphy urged policymakers to use revenue from legal marijuana to “invest in communities most harmed by the War on Drugs.”[110] And most recently, in April 2021, U.S. Senator Cory Booker called for an “end to the failed War on Drugs.”[111]
This change in stated goals is occurring not only in New Jersey but across the nation, as the deaths of white people who use drugs are seen less as an issue of moral failure and more as an issue of inadequate public health and drug treatment systems.[112] This is reinforced by media coverage of drug policy: in coverage about Black and Hispanic/Latinx people who use drugs, the emphasis is often about drug use and sales as a form of crime; for coverage about white people who use drugs, an individual’s history, reasons for using drugs, and uniqueness are covered.[113]
Yet, even with the changing discourse motivated by increased attention to overdose in white communities, this analysis shows that New Jersey continues to make drug war arrests at the same, or greater, per capita rates than it did at the peak of support for the drug war in the 1990s.
Figure 1 shows that New Jersey’s per capita drug war arrests[114] — that is, all arrests reported by participating New Jersey law enforcement agencies for drug use/possession and drug sale/manufacture — were higher in 2019 than in 1986, the year that President Reagan turbocharged the drug war and New Jersey passed the CDRA.[115] In 1986, New Jersey made 398 drug war arrests per 100,000 residents; in 2019, New Jersey made 626 drug war arrests per 100,000 residents — an increase of 57 percent.[116] In 2017, New Jersey made 703 drug war arrests per 100,000 residents, a per capita number of arrests that, for the period 1986-2019, was only exceeded in 1989.[117] The number of law enforcement agencies that report their arrest data varies from year to year, and arrest numbers should be taken as approximate and are likely an underestimate of the actual number of arrests made.
FIGURE 1
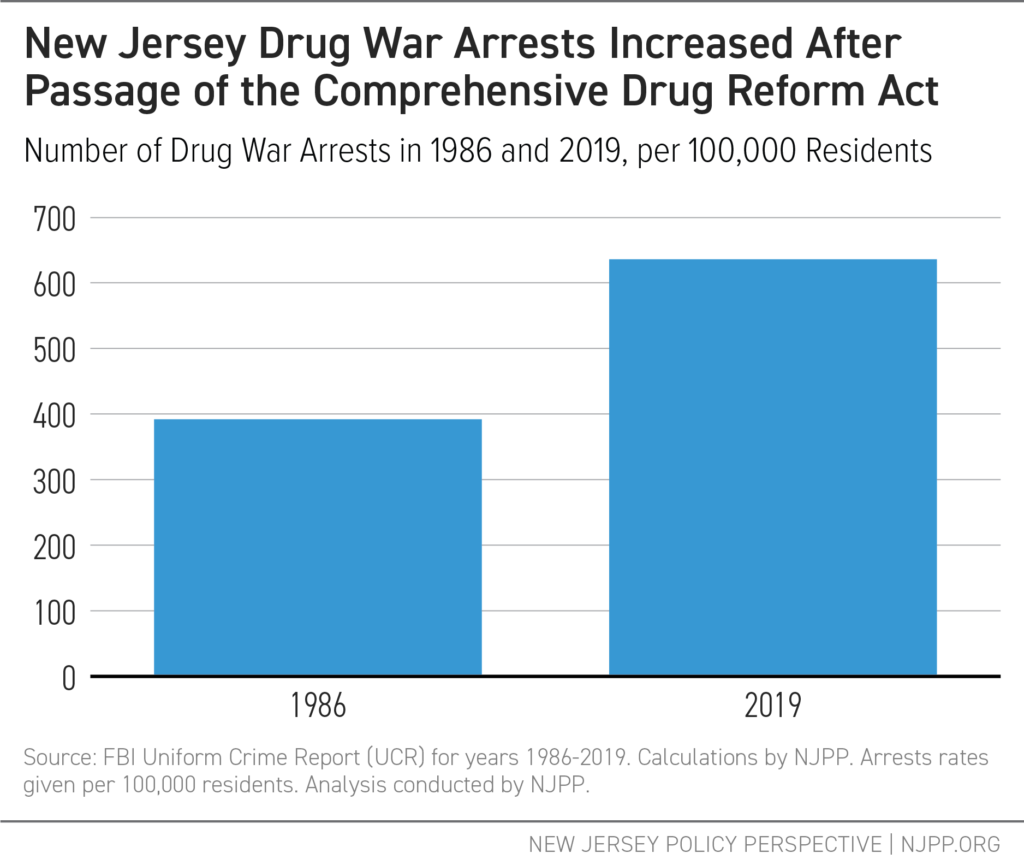
FIGURE 2
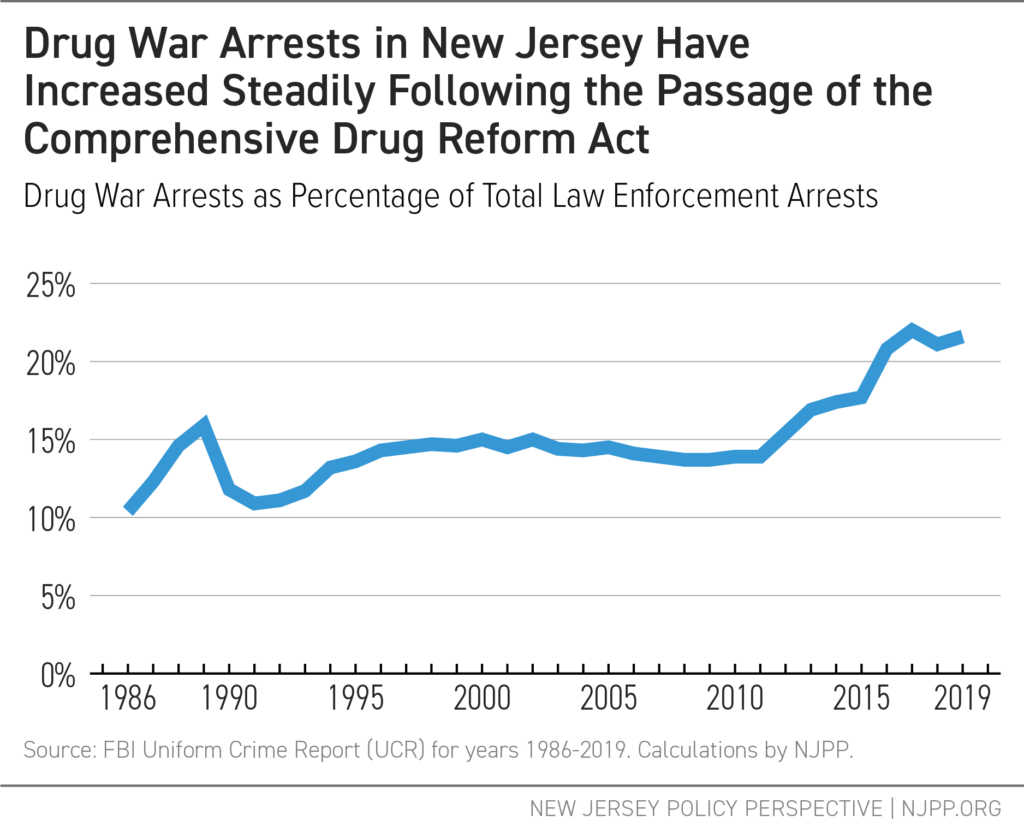
New Jersey’s drug war arrests, as a percentage of all non-traffic arrests, was 107.9.percent greater in 2019 than in 1986.[118] This trend is evident in Figure 2: in 1986, 10.4 percent of all arrests reported in New Jersey law enforcement agencies were for drug war violations; in 2010, this percentage had risen to 13.9 percent; by 2019, 21.6 percent of all arrests reported in New Jersey were drug-related.[119] This means that, in 2019, more than one in five of total arrests made by New Jersey’s state and local police departments were for a drug war violation.[120]
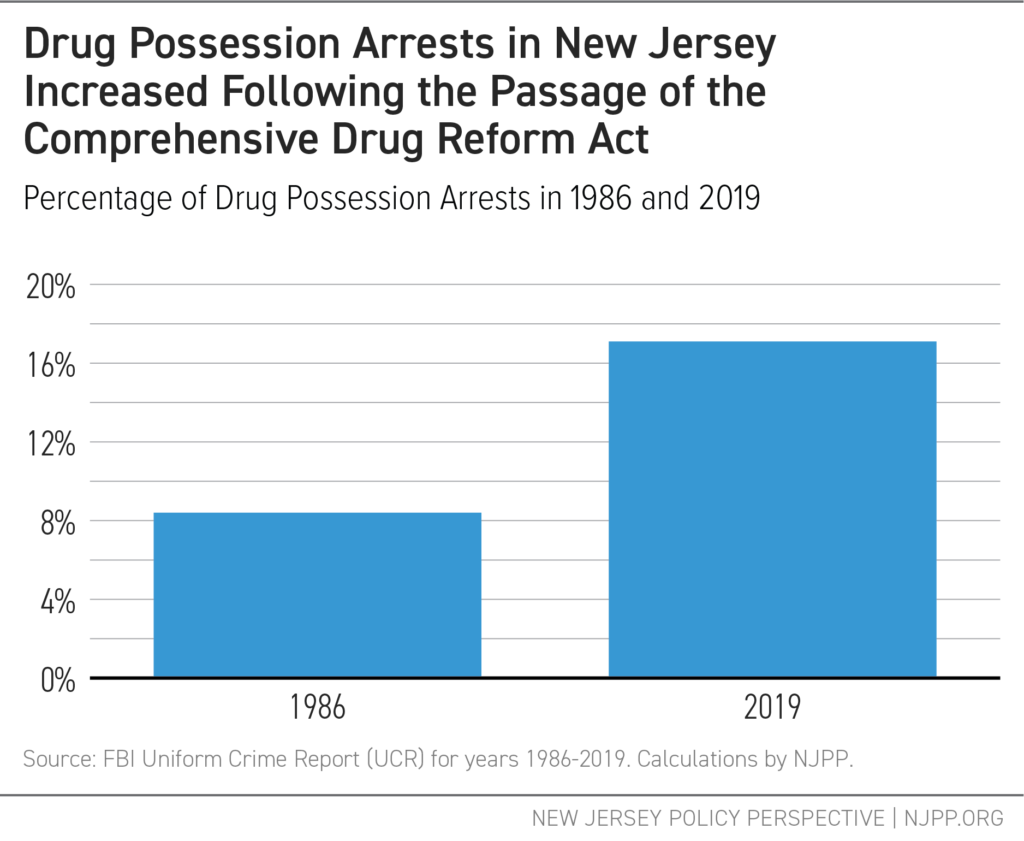
Consistent with the drug war’s emphasis on arresting people for their personal drug use and possession, New Jersey also made more arrests for drug possession relative to total arrests in 2019 than in 1986.[121] In 1986, 8.4 percent of all reported arrests were for drug possession alone.[122] By 2019, drug possession arrests accounted for 17.1 percent of all arrests — a 104.7 percent increase.[123]
FIGURE 3
Beyond the Numbers: H-Dub
I was introduced to marijuana at a young age, like 12 years old, and was very into sports, so very gingerly used it. And then I was thrust into homelessness, and when I became homeless, it was like an alphabet city, and I was introduced to more than weed.
I got hit with a manufacturing charge and a distribution, right? So possible with intention to distribute on top of a shoplifting charge that if I did not catch the other charge, the distribution charge, the shoplifting charge would have been thrown out and I would have paid a fine and never went to prison. But because I got this charge that’s municipal, the other one being superior, I had to do a three year, a three flat, with a three year and nine-month stipulation that ran together, right?
It’s just the militarism of the police while you’re homeless because you’re criminalized. You’re targeted. So, you become targeted and that pressure, that anxiety, builds up, like ‘Oh my god, do I have a warrant? Oh my god, did I miss court?’ And the fact that you feel like all your money has to be used on surviving.
I call it the trap of the trap. Like you’re trapped within the inner city because you’ve caught so much disorderly persons [citations], or you caught urination, or you caught a possession of cocaine, you got caught at a party with marijuana, and you got so many of those things while being homeless that, guess what? Now you’re trapped in debt, you know.
It’s deep. I hate to say it, but it has to be a deep change. We add to the biggest prison population in the world, instead of trauma informed care like Tai Chi, meditation, and yoga. It’s more than defunding the police, it’s actually pushing trauma-informed policies like healing, harm reduction, and Housing for All, and taking minute community-based programs and pushing that work until it’s funded and it has a building.
— H-Dub is a community leader, proud father, and Tai Chi enthusiast. H-Dub was raised by adoptive parents after his parents lost custody due to their substance use; his mother is still using heroin and in need of support, and he reports that his mother’s experience with child protective services was traumatic.
|
Section 3
Decade in Review: New Jersey’s Budgetary Investment in the Drug War
“People who are using or selling drugs, it’s the same problem, it’s poverty, right? There’s a struggle somewhere. There’s a missed opportunity somewhere. So, there’s an underlying situation that needs to be addressed, which is either poverty, trauma, or something of that nature. We need a trauma-informed lens, not a war on drugs lens — that’s the narrative change. That’s literally the switch. You have to understand trauma in the community to be able to service the community.”
— Dashaan Jennings
Despite its racist underpinnings and documented failures, New Jersey continues to invest in state and local drug war enforcement. Between 2010 and 2019, New Jersey invested at least $11.6 billion, 2020 dollars, to enforce the drug war at the state and local levels. This amounts to an average of $1.2 billion per year to arrest, prosecute, and incarcerate residents for drug war violations.
Broken down, New Jersey spent the $11.6 billion in the following ways:
- $5.1 billion to make drug war arrests
- $2.2 billion to carry out drug war prosecutions
- $4.3 billion to incarcerate people for drug war convictions
The actual cost of New Jersey’s drug war is higher than $11.6 billion. The budget costs outlined here do not include significant expenses in the criminal legal system for drug war enforcement, such as insurance for police departments in the event of being sued, health insurance and retirement benefits for employees of police, court, or corrections departments, and capital costs to maintain buildings and other infrastructure through local jails and the New Jersey Department of Corrections.
This report’s budgetary analysis also does not account for the economic costs of the harms wrought by the drug war on New Jersey residents and communities, such as the loss of income from being incarcerated and unable to work.
FIGURE 4
New Jersey’s Investment in Drug War Arrests, Prosecutions, and Convictions
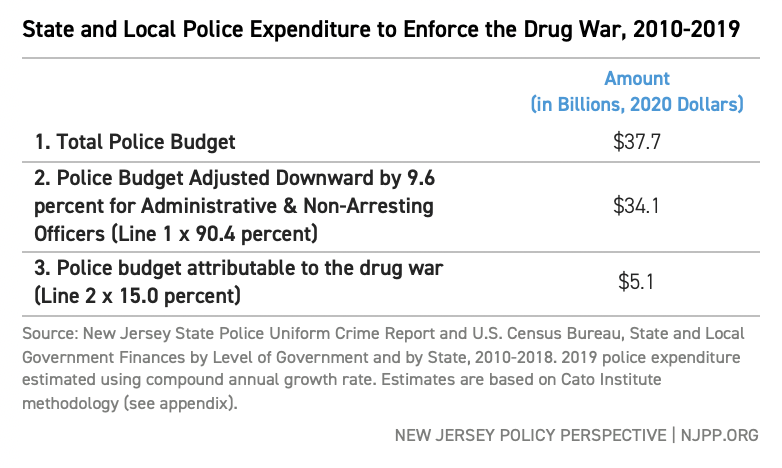
$5.1 Billion to Make Drug War Arrests
Included in the $11.6 billion, New Jersey invested an estimated $5.1 billion to arrest residents for drug war violations between 2010 and 2019 (see Line 3 of Table 1). This amounts to an annual average of $510 million in 2020 dollars.
To arrive at this number, this analysis found the percentage of all state and local arrests attributable to the drug war and multiplied the total state and local police expenditures by that amount, excluding administrative costs, for the years 2010 through 2019.[124] In this period, New Jersey state and local law enforcement agencies made approximately 2.9 million arrests for all reasons other than traffic violations (such as speeding, failure to yield, or out-of-date registration).[125]
Line 7 of Table 1 shows that, of all reported arrests between 2010-2019, 15.0 percent can be attributable solely to the drug war, meaning that no other reason for the arrest existed (e.g., loitering, theft) in the absence of the drug-related charge.
TABLE 1
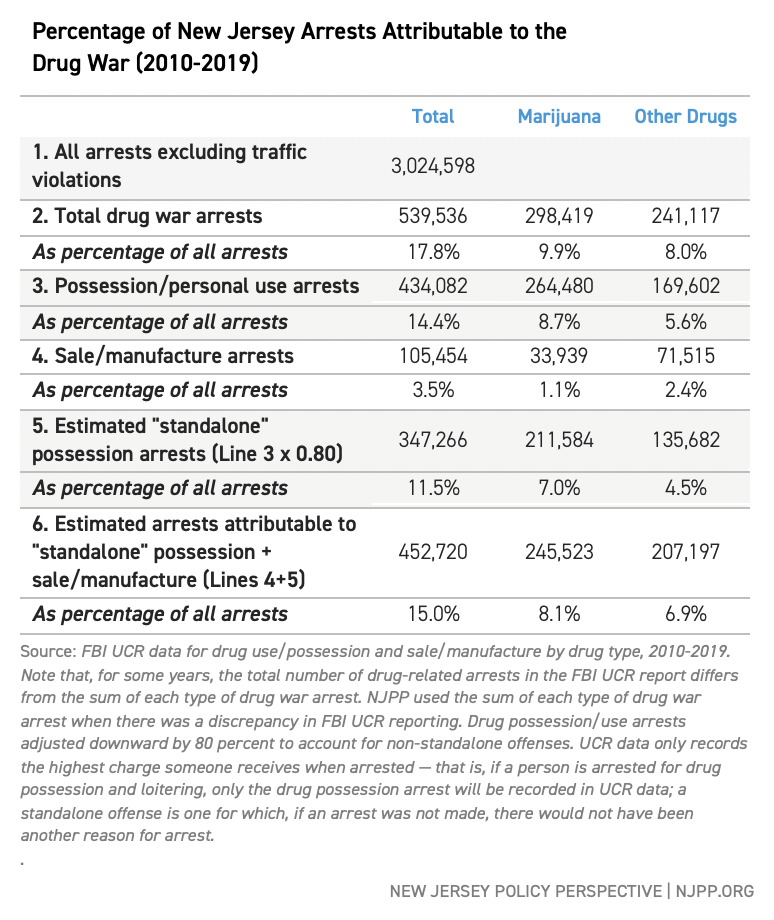
TABLE 2
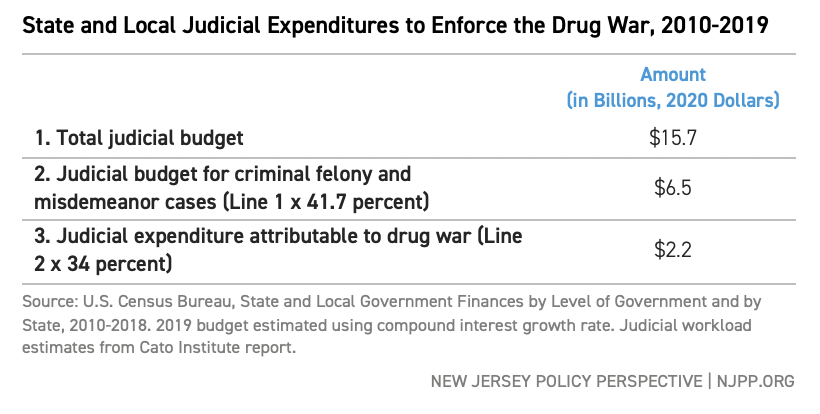
$2.2 Billion to Carry Out Drug War Prosecutions
In addition to the $5.1 billion investment in drug war arrests, New Jersey invested $2.2 billion in 2020 dollars, or an average of $220 million annually, between 2010 and 2019 to charge, prosecute, sentence, and monitor New Jerseyans with drug war violations in the criminal courts through the probation system.[126] This finding is based on the estimated percentage of state judges’ workloads — that is, the amount of time judges spend on different types of cases. Based on estimates from the Cato Institute, 41.7 percent of judicial caseloads are criminal cases and, of those cases, 34 percent are drug war-specific cases.[127] This calculation is likely an underestimate of the true judicial investment in drug war punishments, as it does not include civil court costs (e.g., child custody cases) or prosecutions for violations associated with drug prohibition, such as loitering.
TABLE 3
$4.3 Billion to Incarcerate People for Drug War Convictions
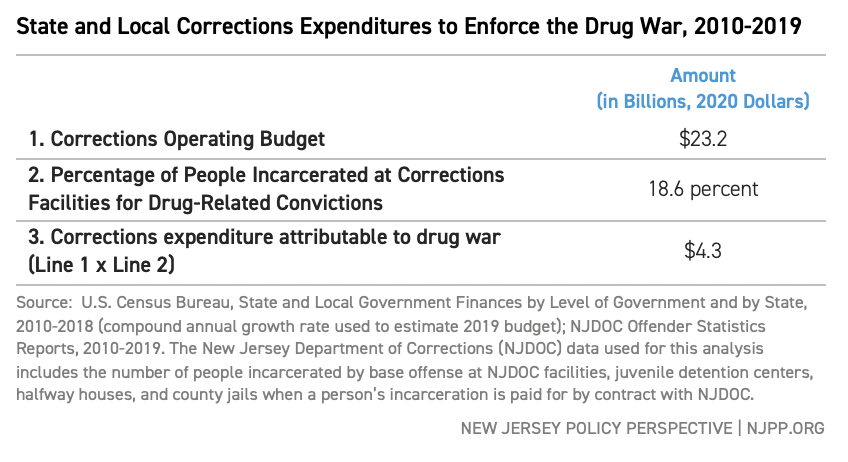
New Jersey invested an estimated $4.3 billion over the past decade to incarcerate residents whose base offense was drug related. “Base offense” means that it is the most serious offense for which someone was convicted. Over the past decade, an average of 18.6 percent of people incarcerated — or about 4,181 people at a given time — at New Jersey Department of Corrections (NJDOC) facilities were detained due to drug war enforcement.[128]
Like the police and judicial estimates before it, the estimated state cost of incarceration is an underestimate, as it only documents the incarceration of those who have been convicted of drug-related violations and sentenced to serve time at NJDOC facilities.[129] For some New Jerseyans, a drug violation arrest leads to incarceration outside of NJDOC. For example, the budgetary expenditure does not account for drug war incarcerations of New Jerseyans at federal facilities or by U.S. Immigration and Customs Enforcement (ICE).
TABLE 4
Beyond the Numbers: Dashaan Jennings
The war on drugs, I’m a victim of it. My mother was a survivor of abuse. I came out, all my brothers came out with levels of drugs within our systems, crack babies . . . [both] parents used heroin and alcohol, which caused me to be removed from my biological family and forced into foster care. I was placed in the [child protective system] at the age of four.
The narrative about people like my mother and myself… it was not a supportive narrative. My mom was looked at as the predator, because she was using drugs. I was looked at as a super-predator, because I came out of the womb of someone that used drugs. I always had a loyalty to my biological family… As I got older, I got to understand that the support wasn’t available for them.
[At the time] crack meant ten years incarcerated for the urban community. Cocaine meant ten days. So it was zeroed in to deteriorate our community, and put us in a space where we’re not able to support each other, right? It’s the whole cycle of getting punished for something that you should be supported for. [My mom] was not able to get support when she was looked at as a criminal instead of someone that needed help, instead of someone that was trying to mask her pain in drugs. My mom didn’t have that option, because it wasn’t promoted to the community then. Those options were not in our community.
My brothers and I, we were looked at as super predators. [The assumption was] we would be angry, we would be lashing out, we would be dangers to society. But it didn’t happen. You know, my brothers definitely had a part in tearing up society, but I wouldn’t call them super predators. I would call them people who were seeing their mom and father on drugs and who were tossed in the system and not given a personalized approach. No one took time to see exactly what each and every one needed.
I was blessed. At age 13, I caught a heavy charge. It was a murder. The first judge in court said, ‘You’re a danger to society.’ [But the next time] I appeared in court, I had a schoolteacher there, a support system. The second judge looked at my transcript and was like, ‘Oh, he is someone . . . there’s no way he’s a danger to society. Release him to a program.’ My attitude was angrier when I was younger. I didn’t show that I cared. And the fact that [my teacher, my caseworker, the judge] noticed something in me was big. The people that helped me through that process were a Godsend. Like, seriously.
People who are using or selling drugs, it’s the same problem. It’s poverty, right? There’s a struggle somewhere. There’s a missed opportunity somewhere. So there’s an underlying situation that needs to be addressed, which is either poverty, trauma, or something of that nature. We need a trauma-informed lens, not a war on drugs lens — that’s the narrative change. That’s literally the switch. You have to understand trauma in the community to be able to service the community.
— Dashaan Jennings is an advocate, member of the Newark Community Street Team, direct service provider with people experiencing homelessness, and proud father to a son and daughter.
|
Section 4
New Jersey’s Drug War Investment Far Exceeds Spending on Public Health Approaches to Drug Use
“Then once I placed [my kids], I was gone… I started staying in the streets. It was rough. I used to sleep in the hallways. There was times I was so hungry, I had nothing to eat. I would actually go to the garbage cans to find food to eat. I got raped a couple of times. I mean, life was terrible. It was just terrible… I wish I could just take it, and make it better for [people who use drugs], because I know that’s possible. They ain’t got to go through what I needed to go through.”
— P.J.[130]
State and local budgets disclose where New Jersey is investing its resources. In this respect, budgets are moral documents that put priorities and values into action. However, based on total investments, New Jersey prioritizes drug-war arrests, prosecutions, and incarcerations over public health and community well-being. In fact, if the War on Drugs were a stand-alone state agency, it would have a budget 4.4 times larger than that of the New Jersey Department of Environmental Protection.[131]
To put New Jersey’s drug war investments into context, this section compares the average annual amount of the $1.2 billion that New Jersey invested in drug war enforcement over the past decade with FY 2019 state investments in public health, harm reduction, housing, and addiction treatment.[132]
New Jersey’s annual drug war investment of $1.2 billion over the past decade is:
- 2.6 times greater than New Jersey’s budget expenditure for the Division of Mental Health and Addiction Services (DMHAS) in the Department of Human Services.[133]
- 19.1 times greater than New Jersey’s investment in public health protection services like epidemiology, cancer prevention and monitoring, smoking cessation programs, and protections from workplace hazards.[134]
- 40.4 times greater than New Jersey’s investments in homelessness prevention and the State Rental Assistance Program combined.[135]
- 139.9 times greater than New Jersey’s investment in community health services.[136]
- 544.6 times greater than New Jersey’s investment in harm reduction programs.[137]
- 737.9 times greater than New Jersey’s budget allocation for the Office of Minority and Multicultural Health.[138]
Compared to the state’s drug war investment, New Jersey’s public health infrastructure is severely underfunded. New Jersey’s network of state and local medical examiners have 20 percent fewer employees than a decade ago while the overdose crisis increased workloads.[139]
New Jersey also ranks in the bottom quarter of spending on local public health departments compared to states across the nation. Indeed, New Jersey’s investment of $30 per capita on local public health services falls short of investments like $70 per person in Massachusetts and Maryland; this underfunding left the state underprepared for the COVID-19 pandemic.[140]
The state also needs substantially greater investment in housing for residents leaving incarceration. Although 25 percent of the estimated need for supportive housing is for formerly incarcerated residents, none of New Jersey’s supportive housing units created through the low-income housing tax program have gone to residents exiting incarceration.[141]
New Jersey’s Return on Drug War Investment
As a result of the state’s $11.6 billion investment in drug war enforcement over the past decade, New Jersey also saw increasing overdose death rates and persistent racial inequities in arrest rates despite white residents using criminalized drugs more than their Black and Hispanic/Latinx counterparts.[142] At the same time, New Jerseyans continue to face barriers to evidence-based drug treatment and mental health support.
- Between 2010 and 2019, 18,492 residents died of a drug-related overdose, a loss of loved ones that has impacted families across the state.[143] In 2018, this amounted to over eight funerals a day.[144]
- Drug-related overdose rates are growing fastest for Black and Hispanic/Latinx residents. In 2019, the rate of drug-related overdose deaths for white residents was 1 times greater than in 2010. This rate was 4.6 times greater for Black residents and 4.8 times greater for Hispanic residents.[145]
- Between 2010 and 2019, Black residents were 3 times more likely to be arrested for all types of drug war arrests than white residents, despite white people both using/possessing and selling/manufacturing drugs at higher rates.[146] Black and Hispanic/Latinx residents would be arrested at similar rates to their white counterparts in the absence of racist policy outcomes.[147]
- In 2019, New Jersey’s Division of Mental Health and Addiction Services estimated drug treatment options were lacking for 1 percent of residents who might want treatment.[148] Meanwhile, evidence-based harm reduction services are only available in seven of New Jersey’s 21 counties and 1.2 percent of New Jersey’s municipalities.[149]
- Approximately 57,600 people felt that they needed more mental health support than they were able to find between 2018 and 2019.[150]
Beyond the Numbers: PJ
I grew up in the ’60s, the ’70s, and I grew up in the projects. I started with marijuana. I started taking pills and drinking cough syrup. Then I moved on to heroin and cocaine. They made me feel something I never felt before. Actually, I believe that’s what kept me using. Because the first time I used, that feeling was so different, and it was so good, it kept me looking for that same feeling which I never got. I never received that same feeling again. But I guess that’s what I was looking for.
My mother was what you would call a functioning alcoholic. My father was a functioning alcoholic, but he had underlying medical issues. My father had heart disease. One day he had a heart attack which was in 1976. It was a nice little day. He had a heart attack and that was it. A major heart attack, and my father didn’t come back home.
I was 14 years-old. That’s when I believe I just really didn’t care no more. My drug use, it just exploded. I just didn’t care about anything anymore. Two years after my father passed, I gave birth to my first child. During the time I was pregnant; I couldn’t use because she ingested everything. I couldn’t drink, I couldn’t smoke cigarettes, I couldn’t do it.
After I had her, I started getting high, dipping and dabbing again, and that’s when I moved to New York with a friend of mine, and that’s when I shot my first drug. It was fun in the beginning, but then it became like a job. That was just something I did everyday just to function, as a matter of fact. . . Each day I would wake up trying to figure out ways and means to get money, so I could get these drugs that I knew I had to have. If I didn’t have it. I wouldn’t be able to function.
At first it was okay, I was able to function and take care of my kids. I used to get a lot of comments on how I kept my kids so neat and clean. They always had their hair touched, brand-new underwear. That was something that I looked forward to, keeping my kids looking their best at all times.
I noticed I started neglecting them. I wasn’t buying their clothes like I used to, I wasn’t getting their hair touched, and I was using more and more drugs. I had to make a decision, if I would keep them and have them struggling with me out here, chasing these drugs with me. Or . . . let them, hopefully, get a better life somewhere else. It was hard. I regretted it. Many days I regretted it. There was no other option, I had to do what I had to do to get my drugs, and I didn’t want my kids to be out there with me.
I had a couple of workers with the [child protective] system that was willing to work with me, and they were helping me in any way they could. Then I had those that wasn’t so supportive. You can tell those that were really trying to keep me and my kids together, and those that seemed like they was just trying to do anything to keep us apart.
Then once I placed them, I was gone. . . I started staying in the streets. It was rough. I used to sleep in the hallways. There was times I was so hungry, I had nothing to eat. I would actually go to the garbage cans to find food to eat. I got raped a couple of times. I mean, life was terrible. It was just terrible.
Many times I went to methadone programs. They didn’t work because my cocaine drug use heightened. I started using more cocaine. I went to a couple of voluntary in-patient programs. The longest I ever stayed clean on one of those was eleven and a half months, something like that.
Now, I no longer use. I no longer have the desire to use. I haven’t used any drugs except methadone since 2007. I went and I got on the methadone program and this time it worked for me.
It’s not getting better because every time you turn around, it’s some different kind of drug. Before it used to be just heroin, cocaine, and marijuana. Now it’s all kinds of stuff. Marijuana got everything mixed in it. Heroin got everything mixed in it. Cocaine has everything mixed in it… I wish I could just take it and make it better for [people who use drugs] because I know that’s possible. They ain’t got to go through what I needed to go through.”
— PJ is a mother and neighbor known for the music she plays on her electric scooter. PJ continues to attend the methadone program she connected with in 2007. She achieved her goal of reconnecting with all of her children.
|
Section 5
Challenging Common Misconceptions About Drug Use
“They make up stuff… You’ve got to see the person you just was talking to, maybe your next door neighbor, and you know he’s probably doing something, but he don’t deserve to be treated like that. You know what I mean? It’s not slavery no more.”
— Ray[151]
Policymakers frequently advocate for prohibition to justify ongoing investments in the drug war.[152] However, as the report indicates, prohibition has not led to reductions in drug use, only increases in arrests. Consequently, to move towards evidence-based public policy, there must be an active unlearning of misconceptions. The following analysis uses data and research to address common misconceptions about drug use.
Misconception 1:
Most People Who Use Criminalized Drugs Will Develop a Substance Use Disorder
The Evidence Shows:
Most people who use criminalized drugs — including cocaine, methamphetamine, and heroin — do so without any issues.[153] Between 2018 and 2019, nearly 1.5 million New Jerseyans reported using a criminalized drug and, of those, only 3.1 percent used drugs in a problematic way.[154] Of all New Jerseyans who used a criminalized drug in the previous year, an estimated 84 percent did so without experiencing problems, while 16 percent experienced a substance use disorder or other problems related to their
drug use.[155]
These findings are consistent with national research showing that 70 to 90 percent of people who use a criminalized drug (including heroin, cocaine, and methamphetamine) do not experience a substance use disorder.[156] Specifically, the Global Commission on Drug Policy reports that:[157]
- 77 percent of people who try heroin will do so without problems.
- 83 percent of people who try cocaine will do so without problems.
- 91 percent of people who try marijuana will do so without problems.
- 68 percent of people who try tobacco will do so without problems.
Some factors that contribute to higher-risk drug use include social marginalization, difficult living conditions (e.g., racial segregation, job loss, economic insecurity, housing insecurity), and traumatic experiences (e.g., incarceration of a loved one, sexual assault, childhood sexual abuse, family-based violence, and gender-based violence).[158]
Misconception 2:
The Vast Majority of New Jerseyans Have Never Used Criminalized Drugs Like Cocaine, Heroin, and Methamphetamine
The Evidence Shows:
Drug use is a common part of life in New Jersey, as it is globally. An estimated 41.4 percent of New Jerseyans, or over three million residents, have used a criminalized drug in their lifetime. Over two million residents, or 27.8 percent, have used criminalized drugs, other than marijuana, in their lifetime, and over half a million residents have done so in the past year. If New Jersey were to arrest every resident who used a criminalized drug other than marijuana over the past year, it would take over 8,300 NJ Transit buses to transport everyone — almost four times as many buses in the entire fleet.[159]
TABLE 5
Misconception 3:
Most People Arrested for Drug War Violations are Responsible for Manufacturing and Distributing Large Amounts of Substances
The Evidence Shows:
Over the past decade, an average of eight in ten drug war arrests were for personal drug possession or use, according to this report’s analysis of arrest data from the New Jersey State Police.[160] For the two in ten people arrested for drug sale, distribution, or manufacture (which are not distinguished in New Jersey’s criminal code), evidence suggests they have little influence over the drug supply chain and their arrests do not reduce drug supply.[161] Indeed, the prices of heroin, methamphetamine, and cocaine al declined substantially.[162]
Misconception 4:
The Drug War is Necessary to Prevent Overdose Deaths and Problematic Substance Use
The Evidence Shows:
When a drug market is established, efforts to stop supply are ineffective and make the supply more deadly.[163] For example, experts believe that illicit fentanyl is now irrevocably part of the U.S. drug supply market. [164] Experts warn that increasing punishments for fentanyl use or sale will increase overdoses and other harms while not decreasing availability.[165] Moreover, policies that attempt to limit the supply of criminalized drugs are associated with more deaths from overdose and a more toxic and deadlier drug supply.[166] This phenomenon is known as the “Iron Law of Prohibition.”[167]
Misconception 5:
The Drug War Helps Prevent Overdose Deaths and Supports People Living with a Substance Use Disorder
The Evidence Shows:
As the Global Commission on Drug Policy indicates, “It is not possible to frighten or punish someone out of drug dependence.”[168] But, drug war policies operate in this manner. Current policies mandate punishment and abstinence, like treatment options through the courts or offered after arrest.[169] However, these policies are ineffective because they are not premised on public health or individual well-being.[170]
Instead, a less used but more effective approach is harm reduction because of its value-neutral stance toward drug use itself and support of individuals in defining and achieving their own goals grounded in well-being and quality of life.[171] The U.S. Centers for Disease Prevention and Control found that people who access harm reduction programs are: [172]
- 5 times more likely to enter treatment for their drug use than those without access.
- 3 times more likely to stop drug use that is impeding their quality of life.
- 50 percent less likely to contract HIV and Hepatitis C.
Misconception 6:
Legalization of Marijuana Will End the Racial Discrimination Wrought by Drug War Arrests
The Evidence Shows:
While an essential step in dismantling the drug war and investing in public health and racial justice, marijuana legalization will not end racial discrimination of drug war arrests, which persist across all types of drug war arrests, sentencing, and prosecution. Over the past decade, Black New Jerseyans were 2.4 times more likely to be arrested for personal use or possession of drugs other than marijuana, and 7.4 times more likely to be arrested for sale or manufacture of drugs other than marijuana than white residents — despite using and selling these substances at similar rates.[173]
Creating a regulated adult-use cannabis market in New Jersey is an essential step toward dismantling the War on Drugs; however, the roots of the drug war, presented in Section I, are rooted in racism and economic exclusion. New Jersey will continue to enact racial discrimination through drug war arrests as long as drug war policies continue to guide the state’s drug policy.
Misconception 7:
There are No Policy Alternatives to the Drug War
The Evidence Shows:
In 2000, facing high rates of overdose death and new HIV infections related to drug use, Portugal decriminalized drug possession and prioritized non-coercive engagement of residents who use drugs.[174] This engagement occurs outside of the criminal legal system, and people who use drugs are never forced to attend drug treatment or punished for continuing to use drugs.[175] Rather, Portugal invested in harm reduction, syringe access services, medication for opioid use disorder, and non-abstinence-based housing and social services.[176] After over two decades of drug decriminalization, Portugal has seen dramatic improvements in public health, including:
- 80 percent fewer people died from a fatal drug-related overdose.
- 40 percent fewer people were incarcerated for drug violations.
- New HIV infections related to drug use decreased by 5 percent.
- Rates of chaotic and problematic drug use declined.
- Overall rates of drug use continue to decline for all residents, including young people ages 15 through 24.
In November 2020, Oregon residents chose public health over the drug war, voting to decriminalize all drugs and to invest in harm reduction, drug treatment, and housing options for people who use drugs. Oregon’s drug decriminalization is estimated to reduce racial disparities in arrests for Black and Native American/Indigenous residents, relative to their white counterparts, by 95 percent, and racial disparities in prosecutions by 94 percent.[177]
Beyond the Numbers: Ray
I could say as a true statement, that I was born into the drug war, not by choice. My parents were uneducated, put through racial disparities, social disparities, financial disparities, a lot of issues that caused them to be young and users of seebers and codeine then. My mother was 14 and she was pregnant with me. Her birthday is January 3rd and mine is January 4th. So, the day of her birthday, I was trying to come out and my dad was probably 16 or 17 years-old, and he was in rehab. So, he was one that had a family that could at least send him to rehab. My mom had a family that couldn’t get her care and she was the pregnant one.
My dad actually overdosed off of those when I was six. My dad had been incarcerated for charges related to drug use, stuff he never should have been incarcerated for. Then, when he came home, his tolerance was low, and he overdosed and died. That was life-changing for me. It was a family secret to lie and say he died in his sleep and then I found out one day that wasn’t true.
After that, my mom, she pretty much followed the footsteps, not as far as pills, but as far as opioid substances, polysubstance use, and crack. It was very hard growing up into a household with parents who didn’t get the support they deserve… [Many times] I called my grandmother and then she came and rescued me. And then to compare her household, that it did not have alcohol or substance use there. Even though her son did overdose, she did not use. So, it was a big difference on the opportunities I had coming up with my grandmother versus my parents who were addicted.
Of course, sometimes we find ourselves following the same patterns. So, there was a time that I felt as though drugs ruined my family and drug money was going to somehow make me feel like — it owed me, so to speak… Not having my parents put me at a disadvantage, and being born into the crack era, you were either the person selling or the person using, typically. So that’s when the law enforcement came. Every time I thought I was making a couple of dollars to survive; it was like the little petty misdemeanors and drinking and smoking at the time and probably trying to sell a little pot here and there to even support the habit. I’d run into the law time and time again.
The police are always right there talking to people like they’re trash, like they’re less than human, looking for any reason to arrest someone. They, “Oh, we smell something. We see something.” They make up stuff… You’ve got to see the person you just was talking to, maybe your next door neighbor, and you know he’s probably doing something, but he don’t deserve to be treated like that. You know what I mean? It’s not slavery no more.
There’s always a reason why you’re going to get a record because you’re just caught up in a drug environment, no way out, in a sense. I found a sense of outlet with my grandmother, but she was one woman trying to be against the whole entire city. Then I learned on my own that being the church girl wasn’t going to get me nice things. I had already learned how to steal, how to manipulate, how to hustle to survive and take care of myself in the world. Hustling became part of my identity, because the traditional way wasn’t going to save me from the drug war…
My mother did prison time, time and time and time again. It caused me to maybe get confused about my identity, my self-esteem. Does anybody in the world love me? Why me? Why is neither one of my parents there for me? My mother was getting arrested back-to-back. She lost an apartment. She took us back into the apartment, even though it was padlocked… I remember trying to sleep in the abandoned apartment that we had lost… She was always on welfare. She was always just stealing to survive. I remember her teaching us to change labels on cans of food to make it less. So that’s like disparity. You are really down and out. You got to change it from 69 cents to 39 cents.
I wish they would have intervened earlier on instead of just locking her up. They know she was probably trading sex for money to get high. They know she was stealing from a Family Dollar to get high… She has to go through group homes and things like that. I know she had it hard being molested as a girl and her mom was [living with an alcohol use disorder] which is my grandmother.
So, my grandmother was arrested, my mom was arrested, my dad was arrested, my brother’s arrested… I felt as though [the drug war] owed me for taking my parents’ lives from me, so I wanted to benefit off of it some way, somehow. So, I found myself trying to make money off of the problem… My first charge for marijuana was at 18 years-old. I did a year probation and then I say five years later, it turned into selling the heroin and did the seventy days from that. More probation… I wound up getting a therapist on my own. So that’s when all of that kind of stopped.
I wouldn’t serve the young kids, And I’ve tried to help people along the way. They were so sick out there and I never really understood the heroin sickness either. But I guess being in the environment, you start to learn that it’s kind of not people’s fault. So, I got a sense of empathy
and sympathy.
— Ray is an activist and advocate, partner, parent and role model, talented entertainment professional, and certified drug and alcohol counselor who supports patients using medication for opioid use disorder (MOUD).
|
Section 6
Policy Recommendations
As this report’s findings demonstrate, New Jersey is enforcing and investing in a drug war that is ineffective and counterproductive: it is an outsized budget responsibility, fuels racial disparities, and does not advance public health. Instead, New Jersey policymakers should dismantle the War on Drugs and invest in equitable drug policies that promote public health. Policymakers can accomplish this through the following recommendations.
Please note that the recommendations below should be made in consultation with: people who use drugs, people who sell drugs, people most harmed by the War on Drugs, Black and Hispanic/Latinx communities targeted by drug war enforcement, experts of equitable drug policy, and trusted community leaders.
Recommendation 1:
Decriminalize All Drug Use and Possession, and Drug Sale and Distribution Below an Equitably-Determined Threshold
Because the drug war is deeply rooted in New Jersey policy, foundational change to dismantle the drug war is needed: New Jersey should decriminalize all drugs and stop arresting, prosecuting, incarcerating, and otherwise punishing all people who use and possess drugs and who sell and distribute drugs below an equitably-determined threshold.
Currently, New Jersey uses a quantity threshold, which is the amount of a substance that someone can possess for sale or distribution before triggering a criminal penalty. However, an equitably-determined quantity threshold is an amount large enough for personal possession and the possibility of holding, selling, or supplying drugs to a network. Equitable quantity thresholds reduce racial disparities by allowing law enforcement to focus on large-scale drug sale arrests rather than low-level ones.
The following are steps New Jersey policymakers at all levels of government should take to accomplish drug decriminalization:
The Legislature should overhaul the criminal code to remove drug war punishments. Due to its severity and ineffectiveness, the Legislature should immediately overhaul the criminal code to remove state-level criminalization of drug use and possession and determine an equitable level at which currently criminalized drug sales and distribution will be decriminalized.
Municipal and county governments should stop drug war arrests and prosecutions. Local police departments should commit to deprioritizing drug-related arrests through police directives, and municipalities should encourage deprioritization through municipal ordinances. County prosecutors should also deprioritize drug-related prosecutions for any drug use, possession, paraphernalia, and sale and distribution below a predetermined level if those arrests continue.
The Attorney General should issue guidance to stop drug war arrests and prosecutions. As the highest-ranking law enforcement officer in the state, the Office of the Attorney General should immediately reverse directives calling for drug war enforcement to be a “number one priority” and publicly commit to dismantling the War on Drugs. The Attorney General should issue a new directive calling on all law enforcement officers to stop making arrests for drug use, possession, paraphernalia, and sale and distribution at a predetermined level, and for all prosecutors to stop prosecuting people for these drug war violations. The Attorney General should also immediately stop all drug-induced homicide prosecutions.
The governor should use the power and influence of the office to end five decades of a war on residents and modernize the state’s drug policies. New Jersey’s governor has more authority to change policies than any other governor in the nation, including the power to appoint the state’s Attorney General. The governor should commit to ensuring that any appointed Attorney General is committed to dismantling the drug war and by vetoing any new legislation that would increase or reinforce drug war punishments and criminalization of people who use and/or sell drugs.
New Jersey policymakers should create easy-to-navigate pathways for expungement. Along with decriminalization, expungement is critical for those previously arrested for drug use, possession, paraphernalia, and sale and distribution below an equitably-determined quantity. The state should also establish more accessible pathways to expungement for offenses like burglary and theft that are often correlated with drug prohibition. In addition, the state should assess the current incarceration landscape of drug war violations in collaboration with people who are currently or formerly incarcerated and community leaders to implement pathways for decarceration.
The governor should pardon people convicted of drug war offenses who are at risk of deportation. Since drug war convictions are a major driver of deportation, and since expunged records are still visible in — and used during — deportation proceedings, the governor should issue pardons to anyone with a drug war conviction currently in deportation proceedings or vulnerable to deportation. Pardons should be made in consultation with immigrant rights advocates and people most harmed at the intersection of punitive immigration and drug war policies.
Recommendation 2:
Adopt and Invest in a Harm Reduction-Based Public Health Approach to Drug Use
Following national and global best practices, New Jersey should invest in a “continuum-of-care” for people who use drugs that centers harm reduction and drug treatment options that are voluntary, available as frequently as someone wants them (known as “on demand” treatment), and that does not require abstinence.
To build a harm reduction-based public health continuum-of-care, New Jersey should:
Promote and fund widespread harm reduction services. Policymakers should remove the restrictive legislative requirements that limit access to harm reduction services to only seven of New Jersey’s 565 municipalities. Policymakers should also invest in:
- Creating access to harm reduction services that include tools for safer use to prevent infections like HIV, Hepatitis C, and endocarditis (e.g., sterile pipes and syringes).
- Increasing access to naloxone (the medication that reverses an opioid overdose).
- Increasing access to counseling to learn about safer use, overdose response and prevention, and community support.
Make “on-demand” treatment available at no cost to residents and ensure that all state-funded drug treatment services follow best practices for care. Treatment for substance use disorders is most successful when the patient is interested in treatment, and when options are affordable, readily available, and respectful of each individual’s ability to make their own choices about treatment types, timing, and goals.[178] New Jersey should ensure that all state-funded treatment programs follow public health best practices, including:
- Removing abstinence requirements to start, continue, or complete a drug treatment program.
- Ensuring that all forms of medication for opioid use disorder (MOUD) are affordable and accessible for all patients.
- Not limiting the frequency with which someone has access to drug treatment.
- Prioritizing culturally competent treatment that is considerate of how experiences of drug use are influenced by identity and life experience, including: racial and ethnic identity; gender; sexuality; nationality; birthplace; pregnancy status; physical and mental health needs; impacts of the legacy of enslavement and exclusion across generations; and experiences of violence, warfare, homelessness, separation from loved ones, incarceration, and other traumatic experiences.
Pilot a Heroin-Assisted Treatment (HAT) and Stimulant-Assisted Treatment pilot programs. In partnership with a state university, New Jersey should launch Heroin-Assisted and Stimulant-Assisted Treatment programs and evaluate the programs based on public health measures for participants, families, and their communities. These programs provide prescribed medical-grade alternatives to illicit heroin and methamphetamine to people living with a substance use disorder for whom other forms of treatment have not worked.[179] People use the prescribed supply under the close monitoring of a physician.[180]
Heroin-Assisted Treatment programs are associated with crime reduction, increased physical health and emotional well-being by participants, reductions in overdose deaths, and lower heroin use overall.[181] After Switzerland launched its HAT program in 1994, overdose deaths fell by 64 percent; thefts related to drug use decreased by 98 percent; HIV infections dropped by 84 percent; and 75 percent fewer people were prosecuted for drug war violations.[182] A randomized control trial found a similar treatment model to be effective for people living with a methamphetamine use disorder,[183] and Stimulant-Assisted Treatment options are being piloted in three U.S. cities.[184]
Launch Housing First shelter options for people who use drugs and experiencing homelessness. New Jersey should launch a pilot Housing First shelter program based on California’s “navigation centers.” These centers welcome the whole person experiencing homelessness, along with their partners, pets, and possessions.[185] People have safe storage lockers to store their belongings, and abstinence is not required as a condition for housing.[186] This type of shelter is better equipped than traditional shelters to support people who use drugs to secure a safe place to sleep and find long-term housing.[187]
Prioritize and fund fact-based, accurate drug education curriculum for New Jersey’s young people. New Jersey should implement an evidence-based drug education curriculum for youth and young adults, such as the Safety First curriculum developed by the Drug Policy Alliance. Drug education enables young people to be better prepared to navigate the complexity of drug use in their social environments and make informed choices based on accurate information and a realistic understanding of risks. A fact-based curriculum should also include content about drug war policies’ racist and exclusionary history.
Modernize the Governor’s Commission on Alcohol and Substance Abuse to prioritize harm reduction and public health. The Commission currently operates from a disproven approach of preventing drug use through punitive local ordinances. In addition to renaming the Commission to not perpetuate stigma against people who use drugs, the governor should refocus its work to advance equitable drug policy through public health, harm reduction, and reparations for harms caused to Black, Hispanic/Latinx, and immigrant communities.
Recommendation 3:
Substantially Invest in Black and Hispanic/Latinx Communities Most Harmed by Drug War Enforcement
After five decades of targeted and damaging drug war policies, many of New Jersey’s communities need an influx of restorative investments. These investments should include: community-led economic and housing development, education, employment options, alternatives to policing and incarceration, as well as harm reduction, drug treatment, and mental healthcare programs that prioritize healing
over punishment.
Committed investment over the next decade should be comparable to the $11.6 billion New Jersey invested over the past decade to enforce drug war punishments. Policy solutions and use of resources should be decided locally by community leaders and those most harmed by drug war policies.
Recommendation 4:
Publicly Share Data About the Extent of New Jersey’s Drug War Enforcement and Conduct a Drug Policy Audit of All State Agencies
While drug war policies are most visible in policing and incarceration, they are threaded throughout New Jersey’s state agencies. To better understand the full extent of drug war enforcement, along with its differential harms across race, gender, sexuality, and location, New Jersey’s policymakers should:
Conduct a thorough and publicly shared audit of all state agencies to map where drug war punishments are being enacted, along with an improvement action plan. To effectively identify and uproot drug war punishments, these audits should be conducted in partnership with residents who use services provided by each public agency, community stakeholders, and national experts of equitable drug policy. All findings should be accompanied by action plans to replace punitive practices with ones based on harm reduction, healing, and trauma-informed care.
Make data about drug war enforcement publicly available and easily accessible, and regularly publish racial and gender impact analyses. The following data should be publicly shared quarterly and disaggregated by race, ethnicity, age, gender, geography, type of drug, and citizenship status, if it does not jeopardize safety or confidentiality. All data should include the option for intersectional analysis (for example, arrests by type of drug, race, and gender).
- The New Jersey State Police should make available and publish data on drug-related arrests and share this data regularly by location, type of drug, and demographic of the person arrested.
- The Administrative Office of the Courts should make available and publish data on drug-related court involvement, including: type and quantity of a drug, concurrent charges, type of attorney representation (e.g., public defender or private attorney), time to resolve a case, whether a plea bargain was entered, type and length of sentence, probation status, and drug court outcomes.
- The New Jersey Department of Corrections should make available and publish data on drug-related incarcerations, including: the number of people incarcerated and on parole for drug-related violations, the type of violations, and length of sentence.
- The Department of Human Services should make available and publish data on the availability of drug treatment and risk reduction supports, including: demand for treatment and length of waiting lists, types of medication for opioid use disorder offered at each facility, integration of harm reduction into the continuum of care, and the number of “administrative discharges” occurring due to requirements of abstinence.
- The Office of the Attorney General should make available data on law enforcement-led drug war programs (like “drug courts” and initiatives to connect people to drug treatment), including: the scope of fines and fees paid by participants, arrests made, enrollment in treatment and drug court programs, reasons for discharge from treatment and drug court programs, and rates of completion for treatment and drug court programs.
Recommendation 5:
Publicly Acknowledge the Harms Caused by Five Decades of a War on Drugs
Finally, New Jersey policymakers should publicly recognize the state’s role in enforcing a drug war that has proven ineffective and rooted in racialized criminalization. This acknowledgment should be explicitly anti-racist and informed by the leadership of those most harmed by drug war arrests, convictions,
and incarceration.
Conclusion
The takeaways of this report are clear: over the past decade, New Jersey has spent $11.6 billion to arrest, prosecute, and incarcerate people at increasingly higher rates for using, selling, and distributing drugs. Meanwhile, decades of evidence show that such punitive measures do not prevent the very behaviors they purport to curtail or keep people safe from the associated risks of drug use, such as overdoses or chronic drug-related diseases.
New Jersey has the opportunity to approach drug policy much more sensibly and with a view to racial and economic justice, sensible drug education, harm reduction, and equitable treatment options. Further, the state can work to ensure that all residents, especially those most harmed by the drug war, can access decent housing, a basic income that meets their needs, and opportunities to escape the cycle of inequitable enforcement of ineffective policies.
As clear as the conclusions of the report are, so too are the opportunities for real progress: Today, New Jersey has many models to follow, from Portugal to Oregon, as well as many smaller communities fighting for policies oriented toward harm reduction and education rather than punishment, if it seeks to end its participation in the drug war. And it has many people who are excited to be a part of this new age for New Jersey and its residents. Soon, we might see New Jersey’s drug policies described as among the most equitable and transformative in the nation.
Appendix
Acknowledgments
This report is possible thanks to a wide range of researchers, policy experts. advocates, and people who shared their personal experiences with the drug war in New Jersey — and, because the drug war is so pervasive and touches so many lives in New Jersey, contributors may be in multiple of these positions.
Thank you to Michael Enich for his partnership in qualitative research and conducting interviews with people interested in sharing their stories. Thank you to Tara Daniel for helping conceptualize this report’s scope; Jeffrey Miron and Sietse Goddard for their generosity of time, conversation, and fact-checking as Cato Institute researchers whose methodology this report replicates; and to Sarah Fishtein for her story and report copy-editing support.
Thank you to Professors Keith Wailoo, Anne Case, Heather Howard, and Jonathan Mummolo for supporting parts of this report while in its infancy. Thank you Gatien Laurol for conducting legal research as a foundation of the drug war’s manifestation in New Jersey’s criminal code.
Without the entire NJPP team, there would be no report. Nicole Rodriguez’s conceptual and research leadership as NJPP’s Research Director is unrivaled, and the analyst team of Marleina Ubel, Vineeta Kapahi, Brittany Holom-Trundy, and Sheila Reynertson tirelessly and thoughtfully fact-checked each aspect of the report. Louis Di Paolo and Erica Boland brought their keen eye on bringing research to life through graphic design and communications. Brandon McKoy, David Nelson, Becca Jensen Compton, and Jennifer Fekete-Donnors championed this project throughout.
Finally, deepest gratitude to the individuals and organizations who lent their expertise, experience, and wisdom to this report (non-exhaustive): Salvation and Social Justice, Newark Community Street Team, ACLU-NJ, Institute of the Black World-21st Century, Citizen Action/Anti-Poverty Network of New Jersey, Latino Action Network, Supporting Homeless Individuals Loving Others (S.H.I.L.O.), New Jersey Harm Reduction Coalition, Drug Policy Alliance, Faith in New Jersey, South Jersey AIDS Alliance, New Jersey Reentry Corporation, Dr. Sandy Gibson and Dr. Michele Naples of The College of New Jersey, Dr. Jennifer Oliva of Seton Hall Law School, Raynice McKnight, Allora Richey, Peter Treitler, Alex Starapoli, Ami Kachalia, Caitlin O’Neill, Daashan Jennings, Stephan Whitly, Dr. Erin Zerbo, Ben Chin, Brody Viney, Eddie Frierson, Alicia Parker, Kel Ramos, Robert Marsessa, Walter Herres, Domenick Scrivanich, Dr. Aakash Shah, Jada Fulmore, and Gavrielle Gardner.
And, to my family and chosen family, thank you for sharing your experiences with me and being on this journey together.
Methodology
NJPP analysis draws on data from the New Jersey State Police Uniform Crime Report (UCR); U.S. Federal Bureau of Investigation Uniform Crime Report (UCR); National Survey of Drug Use and Health (NSDUH), sponsored by the Substance Abuse and Mental Health Services Administration (SAMHSA), U.S. Census Annual Survey of State and Local Government Finances; New Jersey Department of Labor population data; and the U.S. Centers for Disease Prevention and Control.
Quantitative Analysis
To estimate New Jersey’s budgetary investment to enforce the drug war between 2010-2019, NJPP replicated the budgetary analysis done by Drs. Jeffrey Miron and Katherine Waldock in their 2010 and 2016 Cato Institute reports on the state and local budgetary effects of drug prohibition. NJPP is very grateful to Dr. Miron and his research partner, Sietse Goddard, for fact-checking NJPP’s budgetary calculations.
Qualitative Analysis
While data analysis is essential to NJPP’s research, much is also hidden behind the numbers, namely the human toll of the drug war on individuals, families, and communities. Therefore, this report also includes stories shared by residents directly harmed by drug war enforcement. NJPP interviewed people about their experiences with New Jersey’s drug war enforcement. While not all stories were included in the report, common themes from people’s experiences inform this report as well as future NJPP research.
Replication of Cato Institute Analysis
Please note that the estimate of New Jersey’s budgetary investment to enforce the drug war is likely a conservative one, as it only considers police, judicial, corrections expenditures. It does not include expenses like insurance against lawsuits for police departments; health and retirement benefits for state police, judicial, and corrections employees; and capital costs to maintain and build facilities used by police, the judiciary, and corrections. Further, this analysis does not include the many ways that New Jersey invests in drug war enforcement in other public systems. Nor does it include a dollar estimate for the personal, community, and economic costs in fines, fees, and lost wages paid by New Jersey residents targeted by drug war enforcement.
Calculation of State and Local Police Expenditure to Enforce the Drug War
Arrest data is from New Jersey State Police Uniform Crime Reports, as provided to NJPP through a public information request, and the FBI Uniform Crime Reports available online. To replicate Cato Institute calculations of the cost of enforcing drug war arrests, NJPP looked at the total arrests made by New Jersey law enforcement agencies that were attributable to drug use, possession, sale, or manufacture between 2010-2019.
For this analysis, NJPP used the assumption that 80 percent of drug use/possession arrests are “standalone” — that is, drug-related arrests for which there would not have been another reason for arrest. NJPP’s analysis uses the conservative assumption that only standalone offenses can be directly attributed to drug criminalization. Previous research suggests that between 33 and 85 percent of drug possession charges are standalone (see “The Budgetary Impacts of Ending Drug Prohibition” by Miron and Waldock). The Cato Institute analysis used a more conservative 50 percent estimator. NJPP used the estimate of 80 percent because other, lesser charges may also be related to drug war enforcement, such as loitering or public intoxication, and therefore attributable to the drug war.
Table 1 in the report outlines the calculations used to estimate the police budget attributable to the drug war, using the following data and assumptions:
- Line 1: Total non-traffic arrests in New Jersey for 2010-2019 (traffic-related arrests not included in uniform crime reports), from FBI UCR data.
- Line 2: Total drug war arrests (including use/possession and sale/manufacture), from New Jersey State Police UCR data. The percentage of drug-related arrests relative to total arrests is given in parentheses.
- Line 3: Total number of possession/use arrests and the percentage of possession/use arrests relative to total arrests.
- Line 4: Total number of sale/manufacture arrests and the percentage of sale/manufacture arrests relative to total arrests.
- Line 5: Multiplies total possession/use arrests by 75 percent to account for non-standalone offenses.
- Line 6: Adds both the number and percentage of total arrests attributable to possession/use alone (Line 5) and sale/manufacture (Line 4), finding that 15.1 percent of New Jersey’s nontraffic arrests were attributable to the drug war.
To estimate police expenditure to enforce the drug war, NJPP determined state and local spending on policing in New Jersey using data from the U.S. Census Annual Survey of State and Local Government Finances. All expenditures were converted to U.S. 2020 dollars to account for inflation. As spending for 2019 was not available, NJPP estimated this expenditure using a compound growth rate formula.
Once overall state and local spending on police was determined, NJPP reduced this number downward by 9.6 percent to account for percentage of police budgets that are estimated to go toward administrative costs (that is, costs going not to any targeted enforcement through arrests but the nuts-and-bolts of keeping police officers paid, processing paperwork, etc.). Then, NJPP calculated 15.0 percent of the remaining budget. Because 15.0 percent of arrests are attributable to the drug war alone, 15.0 percent of the remaining policing budget is attributable to the drug war. This calculation showed that New Jersey spent $5.1 billion in 2020 U.S. dollars between 2010-2019 to make drug war arrests. See Table 2.
Calculation of Judicial Expenditure to Enforce the Drug War
To estimate state and local judicial expenditure to enforce the drug war, NJPP determined state and local spending on the judiciary in New Jersey using data from the U.S. Census Annual Survey of State and Local Government Finances. All expenditures were converted to U.S. 2020 dollars to account for inflation. As spending for 2019 was not available, NJPP estimated this expenditure using a compound growth rate formula.
Next, NJPP used the estimators found by the Cato Institute to determine the portion of judicial caseloads that are attributable to criminal felony and misdemeanor cases (as the judiciary also processes civil cases like child custody, divorce, and traffic violations). Based on a review of several states, the Cato Institute estimated that 41.7 percent of judicial caseloads are for felonies and misdemeanors. As shown in Table 3, NJPP adjusted overall judicial spending downward to estimate spending only attributable to felony and misdemeanor cases.
Finally, of felony and misdemeanor cases, the Cato Institute estimated that 34 percent are related directly to drug prohibition. Using this estimator, NJPP calculated the value of 34 percent of the judicial budget — this gives the estimated dollar amount of judicial spending that can be directly attributed to the drug war.
Considerations When Using Uniform Crime Report Data
Data from New Jersey’s Uniform Crime Reports should be considered as approximate — that is, telling a story in trends and patterns while missing valuable data to see how disparities in arrests are taking place across race, ethnicity, sexual orientation, gender identity and expression, and age. The following are issues with UCR data:
- Data from Uniform Crime Reports (UCRs) understates the extent of drug war punishments, because these reports only document one violation at the time of arrest for people who are arrested for multiple violations simultaneously.
- Crime reports are completed by most, but not all, of the state’s law enforcement agencies, who in turn send them to the New Jersey State Police (NJSP). The NJSP then compile the state’s UCR for submission to the Federal Bureau of Investigation, which shares state-level data for all participating law enforcement agencies in the United States. The number of participating agencies can change over time.
- The quality and accuracy of data collection by each law enforcement agency may vary. For example, New Jersey does not have one consistent policy for how to record race and ethnicity across police departments. Some may ask residents to self-identify their racial and ethnic identities if they are arrested, and others may fill out the information based on a police officer’s assumptions based on the resident’s appearance. For this reason, Hispanic/Latinx residents are often undercounted in arrest data.
- New Jersey’s UCR data storage system does not currently allow for intersectional analysis of data (for example, arrests by age and race; arrests by gender and ethnicity; arrests by race and ethnicity).
- New Jersey’s UCR does not ask for demographic information about sexual orientation or gender identity. Therefore, the data would not show where disparities in arrest for LGBTQ residents exist.
- The demographic category “Asian” is very broad and does not adequately capture the diversities of and differences among New Jersey’s Asian communities. Arrest disparities across Asian communities would be reflected in the data.
- Note that this report does not include analysis on arrest disparities faced by Hispanic/Latinx residents. These disparities are likely underestimated, as Uniform Crime Reports (UCRs) are known to under-record arrests of Hispanic/Latinx residents. New Jersey does not have one consistent policy for how to record race and ethnicity across police departments. Some may ask residents to self-identify their demographic information if they are arrested, and others may fill out the information based on a police officer’s assumptions based on the resident’s appearance, thus undercounting Hispanic/Latinx residents.
Racial disparities at drug war enforcement that follows arrest at the judicial and incarceration steps are not included in this report and warrant further analysis.
Calculation of Corrections Expenditure to Enforce the Drug War
NJPP used “offender statistics” from the New Jersey Department of Corrections to estimate the average percentage of people incarcerated in NJDOC facilities each year for drug-related violations and multiplied that percentage by the total corrections expenditures for this time period. See table 4 of the report. Note that all dollar amounts are given in U.S. 2020 dollars to account for inflation.
Examples of New Jersey Drug War Policies that Contradict Public Health Best Practices
Fines and fees in addition to drug war arrests, prosecutions, and incarcerations.
In New Jersey, the minimum fines and fees for a drug possession arrest add up to $1,008 (not including costs for transportation, missed employment, childcare, or a private attorney).[188] As it stands, four out of ten New Jersey households cannot pay for an unexpected $400 bill.[189] What’s worse, these fees furthered the economic exclusion of Black and Hispanic/Latinx residents, for whom generations of racist and exclusionary economic policies have created a striking racial wealth gap; the average wealth of Black and Hispanic/Latinx households in New Jersey are both under $8,000, while the average wealth for white households is $309,000.[190] By eliminating regressive fines and fees, policymakers can help households dedicate resources to housing, food, and other basic needs, all of which are shown to increase the health and well-being of household members who use drugs.
Failing to distinguish between drug sale and/or distribution and manufacturing large quantities of criminalized substances (N.J. Stat. § 2C:35-5).[191]
A major justification for drug war punishments is to prevent large-scale manufacture and distribution of criminalized substances. [192] However, New Jersey law does not distinguish between drug sale and/or distribution and manufacturing of large quantities of criminalized substances. A major consequence of the broadly written law is that residents are charged for drug sale, or intending to distribute, even if the substance is for personal use and not distribution.[193] What’s worse, the vast majority of law enforcement’s focus is not on drug “kingpins” but on low-level and low-paid workers in a supply chain whose arrest does not disrupt that supply chain.[194]
Drug-induced homicide laws that treat all overdose deaths as a murder.
If a death results from a drug-related overdose, the person who gave or sold the substance can be charged with murder through a policy known as “drug-induced homicide.”[195] Such laws are harmful to public health because they reduce the likelihood of people who use drugs to call 911 in the case of an emergency, especially for Black and Hispanic/Latinx residents with experiences of discrimination and violence at the hands of law enforcement.[196] In practice, drug-induced homicide laws are most likely to punish people who are friends, family, or socially connected to the person who has died, and replicate the drug war’s patterns of racial injustice.[197]
Landlord notification for drug-related guilty pleas (N.J. Stat. § 2C:35-16.1).[198]
New Jersey law calls for landlord notification of guilty pleas of drug-related arrests, often resulting in residents losing housing, a policy that increases the risk of overdose death for people who use drugs.[199] One study found that people experiencing homelessness are nine times more likely to die from an overdose than those who are housed.[200] Overall, stable housing increases the likelihood that a person living with a substance use disorder will enter and continue a drug treatment option and stay connected to a support network that improves their well-being and safety.[201]
Restrictive legislation that limits harm reduction services across New Jersey.
Currently, harm reduction services are only available in seven New Jersey cities, representing less than two percent of the state’s 565 municipalities. All the while, the U.S. Center for Disease Prevention and Control (CDC) finds that people who have access to harm reduction programs are five times more likely to connect to drug treatment and three times more likely to stop chaotic substance use entirely.[202] This limitation is rooted in discrimination against people who use drugs and restrictive legislation that requires a municipal ordinance for harm reduction centers to open in a community.[203]
Proliferation of municipal ordinances adding drug war punishments.
Along with the CDRA, New Jersey launched a Governor’s Council on Alcoholism and Substance Abuse (GCASA) that is funded through fines and fees charged to people arrested for drug war violations. GCASA, in turn, organizes a statewide network of “municipal alliances,” which forms “the largest community-based anti-drug network in the nation.”[204] From their inception through 2018, New Jersey’s municipal alliances have been responsible for the passage of over 1,000 local private property ordinances that add new punishments related to drug and alcohol use.[205] These punishments reduce the likelihood that people will seek help for drug or alcohol poisoning, disproportionately target Black and Hispanic/Latinx residents, and divert resources from harm reduction and drug treatment services.[206]
Child neglect investigations for pregnant people who use drugs.
In New Jersey, newborn babies affected by use of either criminalized drugs or medication for an opioid disorder (e.g., methadone) must be reported to the New Jersey Department of Children and Families, which triggers an investigation of the parents for child abuse and neglect.[207] Abuse and neglect investigations are not automatically triggered for babies affected by alcohol or tobacco, despite similar health impacts for children affected by cocaine or opioids.[208] Public health best practices call for any state involvement in prenatal care for pregnant people who use drugs to be entirely independent of state child welfare investigations, which increases positive health outcomes for both pregnant people and their newborn children.[209]
Discredited drug education curriculum for students.
New Jersey schools are required by an attorney general directive to implement the D.A.R.E. (Drug Abuse Resistance Education) curriculum, founded by the Los Angeles police chief who declared that people who use drugs casually “should be taken outside and shot.”[210] In the ensuing decades, the D.A.R.E. curriculum has been found to result in no positive changes for youth, at times increasing rates of drug use.[211] In 2012, the national D.A.R.E. deemed New Jersey’s curriculum “antiquated” and required updates. Subsequently, New Jersey formally separated from the national program, maintaining its discredited curriculum in schools.[212]
End Notes
[1] Caitlin O’Neill, “Abolish the Drug War Coalition Launch,” filmed January 2021. www.youtube.com/watch?v=3KuaWRSWGeU.
[2] Global Commission on Drug Policy. “War on Drugs: Report of the Global Commission on Drug Policy.”. June 2011. www.globalcommissionondrugs.org/wp-content/uploads/2017/10/GCDP_WaronDrugs_EN.pdf. Pg. 2.
[3] “War on Drugs: Report of the Global Commission on Drug Policy.” Pg. 3.
[4] Michelle Alexander, “The War on Drugs and the New Jim Crow,” Reimagine 17, no. 1 (Spring 2010), https://www.reimaginerpe.org/20years/alexander.
[5] Global Commission on Drug Policy, “The World Drug Perception Problem: Countering Prejudices About People Who Use Drugs.” 2017 Report. www.globalcommissionondrugs.org/wp-content/uploads/2018/01/GCDP-Report-2017_Perceptions-ENGLISH.pdf. Pg. 10.
[6] Carl L. Hart, “Exaggerating Harmful Drug Effects on the Brain Is Killing Black People,” Neuron 107, no. 2. July 2020. https://doi.org/10.1016/j.neuron.2020.06.019. Pg. 216.
[7] American Public Health Association Policy Statement, “Defining and Implementing a Public Health Response to Drug Use and Misuse,” November 2013, https://www.apha.org/policies-and-advocacy/public-health-policy-statements/policy-database/2014/07/08/08/04/defining-and-implementing-a-public-health-response-to-drug-use-and-misuse.
[8] NJPP analysis of New Jersey State Police Uniform Crime Reports; U.S. Census Bureau; National Judicial Reporting Program at the Bureau of Justice; and New Jersey Department of Corrections Offender Statistics.
[9] Loren Siegel (primary author). “Uprooting the Drug War.” Drug Policy Alliance. 2021. https://uprootingthedrugwar.org.
[10] Jonah E. Bromwich, “This Election, a Divided America Stands United on One Topic,” The New York Times, November 5, 2020, sec. Style, https://www.nytimes.com/2020/11/05/style/marijuana-legalization-usa.html.
[11] German Lopez, “Oregon Just Voted to Decriminalize All Drugs.” Vox. November 4, 2020. www.vox.com/2020/11/3/21514828/oregon-drug-decriminalization-measure-110-results
[12] Troy Closson, “Marijuana Is Legal in New Jersey, but Sales Are Months Away,” The New York Times, February 23, 2021, www.nytimes.com/2021/02/22/nyregion/new-jersey-marijuana-legalization.html.
[13] Joe Hernandez, “Recreational Marijuana Is Legal in N.J. What Happens Now?,” WHYY. March 25, 2021. https://whyy.org/articles/recreational-marijuana-is-legal-in-n-j-what-happens-now/.
[14] Elizabeth Brico, “‘There Is No Naloxone for Racism’—Kassandra Frederique Speaks Out,” Filter, June 16, 2020, https://filtermag.org/naloxone-racism-kassandra-frederique/.
Larry Buchanan, Quoctrung Bui, and Jugal K. Patel, “Black Lives Matter May Be the Largest Movement in U.S. History,” The New York Times, July 3, 2020, www.nytimes.com/interactive/2020/07/03/us/george-floyd-protests-crowd-size.html.
Movement for Black Lives. “End the War on Drugs.” Policy Platform. https://m4bl.org/policy-platforms/end-the-war-on-drugs/
[15] Delan Devakumar et al., “Racism, the Public Health Crisis We Can No Longer Ignore,” The Lancet 395, no. 10242 (June 2020): e112–13, https://doi.org/10.1016/S0140-6736(20)31371-4. Pg. 112.
[16] Mark É Czeisler,, “Mental Health, Substance Use, and Suicidal Ideation During the COVID-19 Pandemic — United States, June 24–30, 2020,” MMWR. Morbidity and Mortality Weekly Report 69. U.S. Centers for Disease Prevention and Control. https://doi.org/10.15585/mmwr.mm6932a1.
[17] Susanne Hiller-Sturmhoefel, “People With SUDs Have Increased Risk for COVID-19 and Worse Outcomes,” National Institute on Drug Abuse, January 13, 2021. www.drugabuse.gov/news-events/nida-notes/2021/01/people-with-suds-have-increased-risk-for-covid-19-worse-outcomes.
[18] Global Commission on Drug Policy, “Taking Control: Pathways to Drug Policies That Work,” September 2014, https://www.globalcommissionondrugs.org/wp-content/uploads/2016/03/GCDP_2014_taking-control_EN.pdf. Pg. 11.
[19] Global Commission on Drug Policy, “Taking Control: Pathways to Drug Policies that Work.” Pg. 43.
[20] Loren Siegel (Principal Author), “Uprooting the Drug War.” Drug Policy Alliance. 2021. https://uprootingthedrugwar.org/.
[21] Global Commission on Drug Policy. “Taking Control: Pathways to Drug Policies that Work.” Pg. 43.
[22] Drug Policy Alliance, “It’s Time for the U.S. to Decriminalize Drug Use and Possession” (Drug Policy Alliance, July 2017), https://drugpolicy.org/sites/default/files/documents/Drug-Policy-Alliance-Time-to-Decriminalize-Report-July-2017.pdf. Pg. 2
[23] Drug Policy Alliance. “It’s Time for the U.S. to Decriminalize Drug Use and Possession.” Pg. 5.
[24] Drug Policy Alliance. “It’s Time for the U.S. to Decriminalize Drug Use and Possession.” Pg. 4.
[25] Global Commission on Drug Policy, “Taking Control: Pathways to Drug Policies That Work.” Pg. 43.
[26] Global Commission on Drug Policy, “Regulation: The Responsible Control of Drugs.” 2018. http://www.globalcommissionondrugs.org/wp-content/uploads/2018/09/ENG-2018_Regulation_Report_WEB-FINAL.pdf” Pgs. 15-16, pg. 21.
[27] Carl L. Hart, “Exaggerating Harmful Drug Effects on the Brain Is Killing Black People,” Neuron 107, no. 2. July 2020. https://doi.org/10.1016/j.neuron.2020.06.019. Pg. 216.
[28] Center for Drug Evaluation and U.S. Food and Drug Administration, “Drug.” Drugs@FDA Glossary of Terms. November 2017. www.fda.gov/drugs/drug-approvals-and-databases/drugsfda-glossary-terms.
[29] Global Commission on Drug Policy. “The World Drug Perception Problem: Countering Prejudices About People Who Use Drugs,” 2017. Pg. 9.
[30] David Herzberg, “Entitled to Addiction? Pharmaceuticals, Race, and America’s First Drug War,” Bulletin of the History of Medicine 91, no. 3 (2017): 586–623, https://doi.org/10.1353/bhm.2017.0061.
[31] Drug Policy Alliance, “It’s Time for the U.S. to Decriminalize Drug Use and Possession.” Pg. 2.
[32] Anne-Noël Samaha, “Snorted, Injected or Smoked? It Can Affect a Drug’s Addictiveness,” The Conversation. September 2, 2015. http://theconversation.com/snorted-injected-or-smoked-it-can-affect-a-drugs-addictiveness-45281.
[33] Rebecca Everett, “N.J. Made It Legal for Drug Users to Buy Syringes but Not Possess Them. New Bill Could Fix This Legal Quandary.”NJ.Com, March 29, 2021. www.nj.com/news/2021/03/nj-made-it-legal-for-drug-users-to-buy-syringes-but-not-possess-them-new-bill-could-fix-this-legal-quandary.html.
[34] Global Commission on Drug Policy, “The World Drug Perception Problem: Countering Prejudices About People Who Use Drugs.” Pg. 14.
[35] Global Commission on Drug Policy. “The World Drug Perception Problem: Countering Prejudices About People Who Use Drugs.” Pg. 14.
[36] Sheila P Vakharia and Jeannie Little. “Starting Where the Client Is: Harm Reduction Guidelines for Clinical Social Work Practice.” Clinical Social Work Journal. March 2017. www.researchgate.net/publication/301343562
[37] Alberta Health Services, “Harm Reduction: Spectrum of Substance Use,” August 2019, www.albertahealthservices.ca/assets/info/hrs/if-hrs-spectrum-of-substance-use.pdf.
[38] Alberta Health Services.
[39] Elizabeth Hartney et al., “The Symptoms Used to Diagnose Substance Use Disorders,” Verywell Mind. March 21, 2020, https://www.verywellmind.com/dsm-5-criteria-for-substance-use-disorders-21926.
[40] Hartney et al.
[41] Hartney et al.
[42] Seyyed Salman Alavi et al., “Behavioral Addiction versus Substance Addiction: Correspondence of Psychiatric and Psychological Views,” International Journal of Preventive Medicine 3, no. 4 (April 2012): 290–94, https://www.ncbi.nlm.nih.gov/pmc/articles/PMC3354400/
[43] Changing the Narrative Initiative. “Addict: Stigmatizing Language About Substance Use.” Health in Justice Action Lab at Northeastern University School of Law. 2019. www.changingthenarrative.news/stigmatizing-language
[44] Changing the Narrative. “Hooked on Opioids: The Difference Between Addiction and Dependence.” Health in Justice Action Lab at Northeastern University School of Law. 2019. www.changingthenarrative.news/addiction-vs-dependence
“Tolerance, Dependence, Addiction: What’s the Difference?,” National Institute on Drug Abuse (NIDA), January 12, 2017, https://archives.drugabuse.gov/blog/post/tolerance-dependence-addiction-whats-difference.
[45] Changing the Narrative. “Hooked on Opioids: The Difference Between Addiction and Dependence.” www.changingthenarrative.news/addiction-vs-dependence
[46] Changing the Narrative. “Addicted Babies: Stigmatizing Language about Neonatal Abstinence Syndrome.” Health in Justice Action Lab at Northeastern University School of Law. 2019. www.changingthenarrative.news/neonatal-abstinence-syndrome
[47] “Changing the Narrative Initiative.” www.changingthenarrative.news/addiction-vs-dependence
[48] Fair and Just Prosecution, “Issue Brief: Harm Reduction Responses to Drug Use,” August 2019, https://fairandjustprosecution.org/wp-content/uploads/2019/08/FJP_Brief_HarmReduction.pdf. Pg. 3.
National Harm Reduction Coalition, “Harm Reduction Principles,” https://harmreduction.org/about-us/principles-of-harm-reduction/.
[49] Drug Policy Alliance, “Harm Reduction,” https://drugpolicy.org/issues/harm-reduction.
[50] Interview with NJPP.
[51] Cynthia A. Brown, “Beyond the Money: Expected (and Unexpected) Consequences of America’s War on Drugs,” Lincoln Memorial University Law Review, Volume 4, Issue 2, Spring 2017, 123; Library of Congress, “Immigration to the United States: 1851-1900,” U.S. History Primary Source Timeline, www.loc.gov/classroom-materials/united-states-history-primary-source-timeline/rise-of-industrial-america-1876-1900/immigration-to-united-states-1851-1900/.
[52] Cynthia A. Brown, “Beyond the Money: Expected (and Unexpected) Consequences of America’s War on Drugs,” 124.
[53] Legal Frameworks Group, “ Drugs and Drug Laws: HIstorical and Cultural Contexts,” 11; “Opium Laws Throughout History,” Frontline, 1998, www.pbs.org/wgbh/pages/frontline/shows/heroin/etc/history.html.
[54] Audrey Redford and Benjamin Powell, “Dynamics of Intervention in the War on Drugs: The Build-Up to the Harrison Act of 1914,” 521, www.jstor.org/stable/pdf/44000159.pdf?refreqid=excelsior%3A302e4709c6c911ec84ed672ef737d5d8.
[55] Lily Zheng, “To Dismantle Anti-Asian Racism, We Must Understand its Roots,” Harvard Business Review, May 27, 2021, https://hbr.org/2021/05/to-dismantle-anti-asian-racism-we-must-understand-its-roots.
[56] Cynthia A Brown, “Beyond the Money: Expected (and Unexpected) Consequences of America’s War on Drugs,” 125.
[57] Zheng, Lily. “To Dismantle Anti-Asian Racism, We Must Understand its Roots.” Harvard Business Review. May 27, 2021. https://hbr.org/2021/05/to-dismantle-anti-asian-racism-we-must-understand-its-roots.
[58] Brown, Cynthia. Pg. 125.
[59] Kathleen Auerhahn, “The Split Labor Market and the Origins of Antidrug Legislation in the United States.” Law & Social Inquiry 24, no. 2 (1999). http://www.jstor.org/stable/829103. Pg. 424.
[60] Cynthia A Brown, “Beyond the Money: Expected (and Unexpected) Consequences of America’s War on Drugs,” 127.
[61] Cynthia A Brown, “Beyond the Money: Expected (and Unexpected) Consequences of America’s War on Drugs,” 126-127.
[62] Cynthia A Brown, “Beyond the Money: Expected (and Unexpected) Consequences of America’s War on Drugs,” 127.
[63] Cynthia A Brown, “Beyond the Money: Expected (and Unexpected) Consequences of America’s War on Drugs.”
[64] Global Drug Policy Commission, “The World Drug Perception Problem: Countering Prejudices About People who Use Drugs,” 8.
[65] “How the Young Lords Took Lincoln Hospital, Left a Health Activism Legacy,” Filter, October 30, 2018, https://filtermag.org/how-the-young-lords-took-lincoln-hospital-and-left-a-health-activism-legacy/.
[66] Sarah DeWeerdt, “Tracing the US Opioid Crisis to Its Roots,” Nature 573, no. 7773, September 11, 2019, https://doi.org/10.1038/d41586-019-02686-2; Michael O’Brian, “How Heroin Became an Inner-City Epidemic,” The Groundtruth Project, May 4, 2017, https://thegroundtruthproject.org/the-fix-chapter-one/.
[67] “How the Young Lords Took Lincoln Hospital, Left a Health Activism Legacy,” Filter, October 30, 2018, https://filtermag.org/how-the-young-lords-took-lincoln-hospital-and-left-a-health-activism-legacy/.
[68] Sarah DeWeerdt, “Tracing the US Opioid Crisis to Its Roots,” Nature 573, no. 7773 (September 11, 2019): S10–12, https://doi.org/10.1038/d41586-019-02686-2. O’Brian, Michael. “How Heroin Became an Inner-City Epidemic.” The Groundtruth Project. May 4, 2017. https://thegroundtruthproject.org/the-fix-chapter-one/.
[69] Global Commission on Drug Policy, “The World Drug Perception Problem: Countering Prejudices About People Who Use Drugs.” Pg. 23.
[70] Drug Policy Alliance, “A Brief History of the Drug War.” https://drugpolicy.org/issues/brief-history-drug-war.
[71] Global Commission on Drug Policy, “The World Drug Perception Problem: Countering Prejudices About People Who Use Drugs,” 23; Global Commission non Drug Policy, “War on Drugs: Report of the Global Commission on Drug Policy,” 10.
[72] Dan Baum, “Legalize It All: How to Win the War on Drugs.” Harper’s Magazine. April 2016. https://harpers.org/archive/2016/04/legalize-it-all/.
[73] Dan Baum, “Legalize It All: How to Win the War on Drugs.”
[74] Omarrah Mitchell and Michael S. Caudy, “Examining Racial Disparities in Drug Arrests,” Justice Quarterly 32, no. 2. 2015, 289.
[75] Omarrah Mitchell and Michael S. Caudy, “Examining Racial Disparities in Drug Arrests,” 290.
[76] Omarrah Mitchell and Michael S. Caudy, “Examining Racial Disparities in Drug Arrests,” 290. Percentage increase based on calculation by NJPP.
[77] Omarrah Mitchell and Michael S. Caudy, “Examining Racial Disparities in Drug Arrests,” 291.
[78] Tess Borden, “Every 25 Seconds: The Human Toll of Criminalizing Drug Use in the United States,” Human Rights Watch and American Civil Liberties Union, 2016, 5, www.aclu.org/sites/default/files/field_document/usdrug1016_web.pdf.
[79] Jesselyn McCurdy and Deborah J. Vagins, “Cracks in the System: 20 Years of the Unjust Federal Crack Cocaine Law,” 2009, 2, www.aclu.org/other/cracks-system-20-years-unjust-federal-crack-cocaine-law.
Drug Policy Alliance, “What Is the Difference between Cocaine and Crack?,” https://drugpolicy.org/drug-facts/cocaine/difference-crack.
[80] Michael Coyle, “Race and Class Penalties in Crack Cocaine Sentencing,” The Sentencing Project, 9, www.prisonpolicy.org/scans/sp/RaceandClass.Sentencing.pdf.
[81] Loren Siegel (primary author), “Uprooting the Drug War.”
[82] Loren Siegel (primary author), “Report: The War on Drugs Meets Child Welfare,” Drug Policy Alliance, 2021, 1, www.uprootingthedrugwar.org; Loren Siegel (primary author), “Report: The War on Drugs Meets Immigration,” Drug Policy Alliance, 2021, 6, www.uprootingthedrugwar.org.
[83] Katie McDonough, “Long-Term Study Debunks the Myth of the ‘Crack Baby,’” Salon.Com, July 23, 2013, www.salon.com/2013/07/23/longterm_study_debunks_myth_of_the_crack_baby/.
[84] Editorial Board, “Slandering the Unborn,” The New York Times, December 28, 2018, www.nytimes.com/interactive/2018/12/28/opinion/crack-babies-racism.html; Loren Siegel (primary author), “Uprooting the Drug War.”
[85] German Lopez, “The Deadliness of the Opioid Epidemic Has Roots in America’s Failed Response to Crack,” Vox, October 2017, www.vox.com/identities/2017/10/2/16328342/opioid-epidemic-racism-addiction.
[86] U.S. Centers for Disease Prevention and Control. “Drug Overdose Deaths.” CDC Injury Center. March 25, 2021, https://www.cdc.gov/drugoverdose/data/statedeaths.html.
[87] Laura Jozst, “CDC Data: Life Expectancy Decreases as Deaths From Suicide, Drug Overdose Increase,” American Journal of Managed Care, November 30, 2018, www.ajmc.com/view/cdc-data-life-expectancy-decreases-as-deaths-from-suicide-drug-overdose-increase.
[88] Sarah DeWeerdt, “Tracing the US Opioid Crisis to Its Roots,” Nature 573, no. 7773, September 11, 2019, https://doi.org/10.1038/d41586-019-02686-2; Roge Karma, “‘Deaths of Despair’: The Deadly Epidemic That Predated Coronavirus,” Vox, April 15, 2020, www.vox.com/2020/4/15/21214734/deaths-of-despair-coronavirus-covid-19-angus-deaton-anne-case-americans-deaths.
[89] Dr. Scott Nolan, “African Americans Often Face Challenges Accessing Substance Use Treatment,” Pew Charitable Trust, March 26, 2020, https://pew.org/2UnJ6yW.
[90] Dr. Scott Nolan, “African Americans Often Face Challenges Accessing Substance Use Treatment.”
[91] “Enforcement: Drugs and Crime Facts,” Bureau of Justice Statistics, June 1, 2021, https://bjs.ojp.gov/drugs-and-crime-facts/enforcement.
[92] Bruce D. Stout and Bennett A. Barlyn, “The Human and Fiscal Toll of America’s Drug War: One State’s Experience,” Albany Law Review, 2015, 525-526.
[93] New Jersey Criminal Sentencing and Disposition Commission, “Annual Report,” November 2019, https://www.njleg.state.nj.us/OPI/Reports_to_the_Legislature/criminal_sentencing_disposition_ar2019.pdf. Pg. 13
[94] Bruce D. Stout and Bennett A. Barlyn, “The Human and Fiscal Toll of America’s Drug War: One State’s Experience,” 526.
[95] New Jersey Criminal Sentencing and Disposition Commission, “Annual Report,” 13.
[96] Bruce D. Stout and Bennett A. Barlyn, “The Human and Fiscal Toll of America’s Drug War: One State’s Experience,” 527. Converted to 2020 dollars by NJPP.
[97] Bruce D. Stoutand Bennett A. Barlyn, “The Human and Fiscal Toll of America’s Drug War: One State’s Experience,” 534.
[98] Bruce D. Stout and Bennett A. Barlyn, “The Human and Fiscal Toll of America’s Drug War: One State’s Experience,” 539.
[99] New Jersey Criminal Sentencing and Criminal Disposition Commission, “Annual Report.”
[100] Bruce D. Stout and Bennett A. Barlyn, “The Human and Fiscal Toll of America’s Drug War: One State’s Experience,” 537.
[101] Tess Borden, “Every 25 Seconds: The Human Toll of Criminalizing Drug Use in the United States,” 4.
[102] S.P. Sullivan, “Racial disparity in N.J. prison rates highest in U.S., report finds,” Star-Ledger, June 14, 2016, www.nj.com/politics/2016/06/nj_has_12_times_more_black_prisoners_than_white_on.html.
[103] Tess Borden, “Every 25 Seconds” The Human Toll of Criminalizing Drug Use in the United States,” 3.
[104] Shane Smith, “Drug Prohibition is Here to Stay: The Case of Needle Exchange in New Jersey as Parallel to Efforts to Dislodge Global Drug Prohibition,” Master’s Thesis submitted to The New School, May 2008.
[105] Shane Smith, “Drug Prohibition is Here to Stay: The Case of Needle Exchange in New Jersey as Parallel to Efforts to Dislodge Global Drug Prohibition,” Master’s Thesis submitted to The New School, May 2008.
[106] Shane Smith, “Drug Prohibition is Here to Stay: The Case of Needle Exchange in New Jersey as Parallel to Efforts to Dislodge Global Drug Prohibition,” Master’s Thesis submitted to The New School, May 2008.
[107] Richard G. Jones, “The Last Holdout Reconsiders a Program to Curb H.I.V.,” New York Times, September 25, 2006, www.nytimes.com/2006/09/25/nyregion/25needles.html
[108] Shane Smith, “Drug Prohibition is Here to Stay: The Case of Needle Exchange in New Jersey as Parallel to Efforts to Dislodge Global Drug Prohibition”; Richard G. Jones, “The Last Holdout Reconsiders a Program to Curb H.I.V”
[109] Michael Aron, “Opioid Deaths Down in NJ, Governor Details New or Upgraded Anti-Addiction Efforts,” NJ Spotlight News, January 8, 2020, www.njspotlight.com/video/opioid-deaths-down-in-nj-but-battle-against-epidemic-goes-on/.
[110] Mike Davis and Stacey Barchenger, “NJ weed taxes, revenue for Black communities possible as legislation advances.” Asbury Park Press, November 9, 2020, www.app.com/story/news/local/new-jersey/marijuana/2020/11/09/nj-lawmakers-legal-weed-tax-revenue-systemic-racism/6219826002/.
[111] Senator Cory Booker (@senbooker), “Ban private prisons. Legalize marijuana. End the failed War on Drugs. It’s time we fix our savagely broken criminal justice system and focus on restorative justice,” Twitter, April 21, 2021, https://twitter.com/SenBooker/status/1384946789153869828.
[112] Katharine Q. Seelye, “In Heroin Crisis, White Families Seek Gentler War on Drugs,” The New York Times, October 30, 2015, sec. U.S., https://www.nytimes.com/2015/10/31/us/heroin-war-on-drugs-parents.html; Julie Netherland and Helena B. Hansen, “The War on Drugs That Wasn’t: Wasted Whiteness, ‘Dirty Doctors,’ and Race in Media Coverage of Prescription Opioid Misuse,” Culture, Medicine and Psychiatry 40, no. 4, December 2016, https://doi.org/10.1007/s11013-016-9496-5.
[113] Julie Netherland and Helena B. Hansen, “The War on Drugs That Wasn’t: Wasted Whiteness, ‘Dirty Doctors,’ and Race in Media Coverage of Prescription Opioid Misuse,” 9-10.
[114] Drug war arrests refer to arrests for drug possession, use, sale, and manufacture, which are reported by the FBI Uniform Crime Report (UCR) as “Drug Abuse Violations— Grand Total.” The FBI UCR gives annual arrest data for all participating New Jersey law enforcement agencies. The New Jersey State Police collects this data and reports it to the FBI for four categories of substance: heroin or cocaine and their derivatives; marijuana; synthetic or manufactured drugs; other dangerous non-narcotic drugs. In New Jersey State Police data, arrests for drug sale and manufacture are counted together.
[115] NJPP calculation using FBI Uniform Crime Report (UCR) data on arrests and population for years 1986 and 2019. According to the FBI UCR, 80 percent of law enforcement agencies reported arrest data in 1986, compared to 90 percent in 2019. Because this percentage increase (13.9 percent) is substantially smaller than the increase in drug war-related arrests (63.2 percent), it is unlikely that the increase in arrests per 100,000 residents is attributable to increased reporting by law enforcement agencies alone.
[116] NJPP calculation using FBI UCR data for all non-traffic arrests and arrests for “Drug Abuse Violations — Grand Total” reported by participating New Jersey law enforcement agencies, 1986 and 2019. Available at https://crime-data-explorer.app.cloud.gov/pages/home.
[117] NJPP calculation using FBI UCR data for all non-traffic arrests and arrests for “Drug Abuse Violations — Grand Total” reported by participating New Jersey law enforcement agencies, 1986 and 2019. Available at https://crime-data-explorer.app.cloud.gov/pages/home.
[118] NJPP calculation using FBI UCR data for all non-traffic arrests and arrests for “Drug Abuse Violations — Grand Total” reported by participating New Jersey law enforcement agencies, 1986 and 2019. Available at https://crime-data-explorer.app.cloud.gov/pages/home.
[119] NJPP calculation using FBI UCR data for all non-traffic arrests and arrests for “Drug Abuse Violations — Grand Total” reported by participating New Jersey law enforcement agencies, 1986 and 2019. Available at https://crime-data-explorer.app.cloud.gov/pages/home.
[120] NJPP calculation using FBI UCR data for all non-traffic arrests and arrests for “Drug Abuse Violations — Grand Total” reported by participating New Jersey law enforcement agencies, 2019. Available at https://crime-data-explorer.app.cloud.gov/pages/home.
[121] NJPP calculation using FBI UCR data for total non-traffic arrests and arrests for drug possession offenses reported by participating New Jersey law enforcement agencies, 1986 and 2019. Available at https://crime-data-explorer.app.cloud.gov/pages/home.
[122] NJPP calculation using FBI UCR data for total non-traffic arrests and arrests for drug possession offenses reported by participating New Jersey law enforcement agencies, 1986 and 2019. Available at https://crime-data-explorer.app.cloud.gov/pages/home.
[123] NJPP calculation using FBI UCR data for total non-traffic arrests and arrests for drug possession offenses reported by participating New Jersey law enforcement agencies, 2019. Available at https://crime-data-explorer.app.cloud.gov/pages/home.
[124] NJPP analysis of overall arrests from FBI UCR data for participating New Jersey law enforcement agencies, 2010-2019, avaialble at https://crime-data-explorer.app.cloud.gov/pages/home. NJPP analysis of drug-specific arrests from New Jersey State Police arrest data, 2010-2019, available by request from New Jersey State Police.
[125] NJPP analysis of FBI UCR data for participating New Jersey law enforcement agencies, 2010-2019, available at https://crime-data-explorer.app.cloud.gov/pages/home.
[126] NJPP calculation using data from U.S. Census Bureau, State and Local Government Finances by Level of Government and by State, 2010-2018/
[127] Jeffrey Miron and Katherine Waldock, “The Budgetary Effects of Ending Drug Prohibition,” Tax and Budget Bulletin, Cato Institute, July 2018, 9. https://www.cato.org/sites/cato.org/files/pubs/pdf/DrugProhibitionWP.pdf
[128] “Offenders by Base Offense,” New Jersey Department of Corrections, 2011-2019. www.state.nj.us/corrections/pages/OffenderInformation.html
[129] Commissioner Gary M. Lanigan, “Annual Report,” State of New Jersey Department of Corrections, 2010, pg. 36. https://dspace.njstatelib.org/xmlui/handle/10929/29225
[130] Interview with NJPP
[131] NJPP analysis using 2019 expenditure amounts in the New Jersey Governor’s Fiscal Year 2021 Detailed Budget, B4-5, availiable at www.nj.gov/treasury/omb/publications/21budget/pdf/FY21GBM.pdf. Comparison made in U.S. 2020 dollars.
[132] NJPP analysis uses the FY2019 expenditure, rather than that for FY2020, so that the budgetary comparison does not include any COVID-related budgetary changes, and because 2019 is the final year of the decade included in this toreport’s analysis. For comparison, FY2019 budget amounts are adjusted to 2020 dollars to account for inflation.
[133] NJPP analysis using 2019 expenditure amounts in the New Jersey Governor’s Fiscal Year 2021 Detailed Budget, D140-141, availiable at www.nj.gov/treasury/omb/publications/21budget/pdf/FY21GBM.pdf. Includes both State-Aid and Grant-in-Aid appropriation for Division of Mental Health and Addiction Services in 2020 dollars.
[134] NJPP analysis using 2019 expenditure amounts in the New Jersey Governor’s Fiscal Year 2021 Detailed Budget, D146-147, availiable at www.nj.gov/treasury/omb/publications/21budget/pdf/FY21GBM.pdf. Includes both State-Aid and Grant-in-Aid appropriation for Division of Mental Health and Addiction Services.
[135] NJPP analysis using 2019 expenditure amounts in the New Jersey Governor’s Fiscal Year 2021 Detailed Budget, D48. includes expenditure on Shelter Assistance, Prevention of Homelessness, State Rental Assistance Program, and Camden Coalition Housing First Pilot.
[136] NJPP analysis using 2019 expenditure amounts in the New Jersey Governor’s Fiscal Year 2021 Detailed Budget, D146-147. Includes both State-Aid and Grant-in-Aid expenditure for Community Health Services in 2020 dollars.
[137] NJPP analysis using 2019 expenditure amounts in the New Jersey Governor’s Fiscal Year 2021 Detailed Budget (Syringe Access Program), D147, availiable at www.nj.gov/treasury/omb/publications/21budget/pdf/FY21GBM.pdf
[138] NJPP analysis using 2019 expenditure amounnts in the New Jersey Governor’s Fiscal Year 2021 Detailed Budget, D162.
[139] Sheila Reynertson and Brandon McKoy, “Years of Disinvestment Hamper New Jersey’s Pandemic Response,” n.d., 5. https://www.njpp.org/publications/report/years-of-disinvestment-hamper-new-jerseys-pandemic-response/
[140] Sheila Reynertson and Brandon McKoy, “Years of Disinvestment Hamper New Jersey’s Pandemic Response.”
[141] Brendan Burns et al., “Addressing New Jersey’s Rental Housing Affordability Crisis: Recommendations for the New Jersey Housing and Mortgage Finance Agency,”Princeton School of Public Issues and International Affairs Graduate Policy Workshop, January 2020, 23, https://issuu.com/woodrowwilsonschool/docs/affordable_housing_policy_workshop_report
[142] “Abolishing the Racist War on Drugs in New Jersey,” New Jersey Policy Perspective (blog), July 27, 2020, https://www.njpp.org/publications/blog-category/abolishing-the-racist-war-on-drugs-in-new-jersey/.
[143] NJPP calculation using data from the New Jersey Department of Health Overdose Data Dashboard, available at www.state.nj.us/health/populationhealth/opioid/.
[144] Jenna Mellor ,“If They Won’t Quit Using Drugs, Let’s Help Them Use Drugs Safely, Ex-Outreach Team Manager Says,” Guest Editorial, Star Ledger, ” June 29, 2019, www.nj.com/opinion/2019/06/if-they-wont-quit-using-drugs-lets-help-them-use-drugs-safely-ex-outreach-team-manager-says.html. www.nj.com/opinion/2019/06/if-they-wont-quit-using-drugs-lets-help-them-use-drugs-safely-ex-outreach-team-manager-says.html..
[145] NJPP analysis using CDC Wonder data on overdose deaths by population, available at wonder.cdc.gov.
[146] NJPP analysis using arrest data from the New Jersey State Police Uniform Crime Report, 2010-2019, available by request from the New Jersey State Police.
[147] Drug Policy Alliance, “It’s Time for the U.S. to Decriminalize Drug Use and Possession,” 8; Global Commission on Drug Policy, “The World Drug Perception Problem: Countering Prejudices About People Who Use Drugs.”
[148] Office of Planning, Research, Evaluation, Prevention, and Olmstead, “Substance Abuse Overview: 2019, Statewide.” New Jersey Division of Human Services, Division of Mental Health and Treatment Services, October 2020, 13, www.state.nj.us/humanservices/dmhas/publications/statistical/Substance%20Abuse%20Overview/2019/Substance%20Abuse%20Overview%20Statewide%20Report%20-%20%202019.pdf.
[149] NJPP calculation based on information from New Jersey Department of Health, available at www.nj.gov/health/hivstdtb/sap.shtml#:~:text=The%20New%20Jersey%20Harm%20Reduction,of%20child%20bearing%20age%2C%20vaccinations%2C.
[150] NJPP analysis using data from National Survey of Drug Use and Health, 2018-2019, available at https://rdas.samhsa.gov/#/. Estimates adjusted upward to account for underreporting, as previously used in NJPP calculations (see: Brandon McKoy and Ari Rosmarin, “Marijuana Legalization and Taxation: Positive Revenue Implications for New Jersey,” New Jersey Policy Perspective, May 2016, www.njpp.org/wp-content/uploads/2016/05/NJPPNJUMRRevenueMay2016.pdf.)
[151] NJPP Interview.
[152] “War on Drugs: Report of the Global Commission on Drug Policy” (Global Commission on Drug Policy, June 2011), http://www.globalcommissionondrugs.org/wp-content/uploads/2017/10/GCDP_WaronDrugs_EN.pdf.
[153] Global Commission on Drug Policy, “The World Drug Perception Problem: Countering Prejudices About People Who Use Drugs,” 2017, http://www.globalcommissionondrugs.org/wp-content/uploads/2018/01/GCDP-Report-2017_Perceptions-ENGLISH.pdf.
[154] NJPP analysis using data from National Survey of Drug Use and Health, 2018-2019, available at https://rdas.samhsa.gov/#/.
[155] NJPP analysis using data from National Survey of Drug Use and Health, 2018-2019, available at https://rdas.samhsa.gov/#/.
[156] Dr. Carl Hart, “Exaggerating Harmful Drug Effects on the Brain Is Killing Black People,” 216.
[157] Global Commission on Drug Policy, “The World Drug Perception Problem: Countering Prejudices About People Who Use Drugs,” 14.
[158] Jane Liebschutz, et. al, “The relationship between sexual and physical abuse and substance abuse consequences,” Journal of Substance Abuse Treatment 22(3), 2002, https://doi.org/10.1016/s0740-5472(02)00220-9; Pantea Farahmand, Arslaan Arshed, and Mark V. Bradley, “Systemic Racism and Substance Use Disorders,” Psychiatric Annals 50, no. 11, November 2020, 496, https://doi.org/10.3928/00485713-20201008-01;.Hortensia Amaro, Mariana Sanchez, Tara Bautista, Robynn Cox, “Social vulnerabilities for substance use: Stressors, socially toxic environments, and discrimination and racism,” Neuropharmacology, Volume 188, 2021, ISSN 0028-3908, https://doi.org/10.1016/j.neuropharm.2021.108518.
[159] NJPP analysis using NJ Transit fleet information from Nasheen Rajan, “Roadmap to Electrifying New Jersey’s Public Bus Fleet,” New Jersey Policy Perspective, March 31, 2021, www.njpp.org/publications/report/roadmap-to-electrifying-new-jerseys-public-bus-fleet.
[160] NJPP analysis of arrest data from the New Jersey Uniform Crime Report, 2010-2019, available by request from the New Jersey State Police.
[161] Joseph Kennedy, Isaac Unah, & Kasi Wahlers., “Sharks and Minnows in the War on Drugs: A Study on Quantity, Race, and Drug Type in Drug Arrests.” UC Davis Law Review, Vol. 53: 729-801. 2018. Pg. 732.
[162] Edward Porter, “Numbers Tell the Failure of the Drug War,” New York Times and CNBC, July 4, 2012, www.cnbc.com/2012/07/04/numbers-tell-of-failure-in-drug-war.html.
[163] Leo Beletsky and Corey Davis, “Today’s Fentanyl Crisis: Prohibition’s Iron Law, Revisited,” International Journal of Drug Policy 46, 2017, 158, http://fileserver.idpc.net/library/IDPC-guide-3-SPA/Todays-fentanyl-crisis-prohibitions-iron-law-revisited.pdf.
[164] Michael Collins and Sheila Vakharia. “Criminal Justice Reform in the Fentanyl Era: One Step Forward, Two Steps Back,” Drug Policy Alliance. January 2020, 7, https://drugpolicy.org/sites/default/files/dpa-cj-reform-fentanyl-era-v.3_0.pdf.
[165] Michael Collins and Sheila Vakharia. “Criminal Justice Reform in the Fentanyl Era: One Step Forward, Two Steps Back,” Drug Policy Alliance. January 2020, 14, https://drugpolicy.org/sites/default/files/dpa-cj-reform-fentanyl-era-v.3_0.pdf.
[166] Global Commission on Drug Policy, “The World Drug Perception Problem: Countering Prejudices About People Who Use Drugs,” 2017, www.globalcommissionondrugs.org/wp-content/uploads/2018/01/GCDP-Report-2017_Perceptions-ENGLISH.pdf.
[167] Leo Beletsky and Corey Davis, “Today’s Fentanyl Crisis: Prohibition’s Iron Law, Revisited.”
[168] “War on Drugs: Report of the Global Commission on Drug Policy” (Global Commission on Drug Policy, June 2011), http://www.globalcommissionondrugs.org/wp-content/uploads/2017/10/GCDP_WaronDrugs_EN.pdf. Pg. 14.
[169] “Drug Courts are Not the Answer: Toward a Health-Centered Approach to Drug Use.” Drug Policy Alliance. https://drugpolicy.org/sites/default/files/Drug%20Courts%20Are%20Not%20the%20Answer_Final2.pdf. Pg. 16.
[170] Michael Collins, “No Gentler War on Drugs,” Text, Boston Review, April 9, 2019, http://bostonreview.net/forum/how-race-made-opioid-crisis/michael-collins-no-gentler-war-drugs.
“Drug Courts are Not the Answer: Toward a Health-Centered Approach to Drug Use,” 16.
[171] Katie Stone, “The Evidence for Harm Reduction Is Overwhelming,” December 14, 2018, www.opensocietyfoundations.org/voices/overwhelming-evidence-favor-harm-reduction.
[172] U.S. Centers for Disease Prevention and Control, “Syringe Services Programs (SSP) Factsheet,” July 2019, www.cdc.gov/ssp/syringe-services-programs-factsheet.html.
[173] NJPP analysis using arrest data from New Jersey Uniform Crime Report, 2010-2019, available by request from New Jersey State Police;. Carl L. Hart, “Exaggerating Harmful Drug Effects on the Brain Is Killing Black People.”
[174] Drug Policy Alliance, “Drug Decriminalization in Portugal: Learning from a Health and Human-Centered Approach,” 2018, https://drugpolicy.org/sites/default/files/dpa-drug-decriminalization-portugal-health-human-centered-approach_0.pdf.
[175] Drug Policy Alliance, “Drug Decriminalization in Portugal: Learning from a Health and Human-Centered Approach.”
[176] Drug Policy Alliance, “Drug Decriminalization in Portugal: Learning from a Health and Human-Centered Approach.”
[177] Natasha Lennard, “Oregon’s Decriminalization Vote Might Be Biggest Step Yet to Ending War on Drugs,” The Intercept, November 4, 2020, https://theintercept.com/2020/11/04/oregon-drugs-decriminalization/.
[178] “DPA’s Principles of Substance Use Disorder Treatment,” Drug Policy Alliance, https://drugpolicy.org/issues/principles-sud-treatment.
[179] Peter Reuter, “Can Heroin Maintenance Help Baltimore? What Baltimore Can Learn from the Experience of Other Countries,”The Abell Foundation, January 2009, https://abell.org/sites/default/files/publications/cja_HeroinMaintenance_0209.pdf.
[180] “Heroin Assisted Treatment,” Drug Policy Alliance, https://drugpolicy.org/issues/HAT.
[181] “Heroin Assisted Treatment,” Drug Policy Alliance.
[182] Taylor Knopfh, “Switzerland Fights Heroin with Heroin,” North Carolina Health News, January 28, 2019., www.northcarolinahealthnews.org/2019/01/28/switzerland-fights-heroin-with-heroin/.
[183] Marie Longo, Wendy Wickes, Matthew Smout, Sonia Harrison, Sharon Cahill, and Jason M. White, “Randomized controlled trial of dexamphetamine maintenance for the treatment of methamphetamine dependence,” Addiction, 105, 2010, https://doi.org/10.1111/j.1360-0443.2009.02717.
[184]Sean Paul Mahoney, “Why is Meth Left Out of Medication-Assisted Treatment?,” WorkIt Health, February 11, 2020, www.workithealth.com/blog/why-is-meth-left-out-of-medication-assisted-treatment.
[185] San Francisco Department of Homelessness and Supportive Housing, “Navigation Centers Presentation,” Slideshow, March 2019, https://hsh.sfgov.org/wp-content/uploads/2019/03/HSH-Nav-Slideshow-FINAL.pdf.
[186] Joe Colletti, “Defining and Designing Navigation Centers According to Current California Legislation,” Homeless and Housing Strategies for California, June 24, 2018, https://homelessstrategy.com/defining-and-designing-navigation-centers-according-to-current-california-legislation.
[187] Joe Colletti, “Defining and Designing Navigation Centers According to Current California Legislation.
[188] “Municipal Court Operations, Fines, and Fees.,” n.d., 85.
[189] “ALICE: A Study of Financial Hardship in New Jersey,” NJHI – New Jersey Health Initiatives, February 28, 2019, https://www.njhi.org/our-impact/resources/alice-a-study-of-financial-hardship-in-new-jersey/.
[190] New Jersey Institute for Social Justice, Reclaiming the American Dream: Expanding Financial Security and Reducing the Racial Wealth Gap Through Matched Savings Accounts, April 2019. https://d3n8a8pro7vhmx.cloudfront.net/njisj/pages/1235/attachments/original/1554236355/Reclaiming_the_American_Dream_Digital_compressed.pdf?1554236355
[191] Legal analysis by Allora Richey, Rutgers Law School
[192] Phil Dixon,. “Sharks, Minnows, and the Drug War,” NC Criminal Law Blog, UNC Chapel Hill School of Government, April 16, 2019, https://nccriminallaw.sog.unc.edu.
[193] Alyssa Stryker, “Rethinking the ‘Drug Dealer,” Drug Policy Alliance, 2019.
[194] Phil Dixon,. “Sharks, Minnows, and the Drug War.”
[195] Lindsay LaSalle, “A Homicide is Not a Murder: Why Drug-Induced Homicide Laws are Unproductive and Inhumane,” Drug Policy Alliance. November 2017, 2, https://drugpolicy.org/sites/default/files/dpa_drug_induced_homicide_report_0.pdf.
[196] Lindsay LaSalle, “A Homicide is Not a Murder: Why Drug-Induced Homicide Laws are Unproductive and Inhumane,” 3.
[197]Lindsay LaSalle, “A Homicide is Not a Murder: Why Drug-Induced Homicide Laws are Unproductive and Inhumane,” 3.
[198] Legal analysis by Allora Richey, Rutgers Law School.
[199] Siegal, Loren. “The War on Drugs Meets Housing.” Drug Policy Alliance. 2021. Pg. 1. www.uprootingthedrugwar.org.
[200] National Healthcare for the Homeless Council, “Addressing the Opioid Crisis: How the Opioid Crisis Affects Homeless Populations,” Fact Sheet, 2017, https://nhchc.org/wp-content/uploads/2019/08/nhchc-opioid-fact-sheet-august-2017.pdf.
[201] Loren Siegel. “The War on Drugs Meets Housing,” 1.
[202] U.S. Centers for Disease Prevention and Control, “Syringe Services Programs (SSP) Factsheet,” July 2019, www.cdc.gov/ssp/syringe-services-programs-factsheet.html. NJPP analysis based on information from New Jersey Department of Health, available at www.nj.gov/health/hivstdtb/sap.shtml#:~:text=The%20New%20Jersey%20Harm%20Reduction,of%20child%20bearing%20age%2C%20vaccinations%2C.
[203] Shane Smith, “Drug Prohibition Is Here to Stay: The Case of Needle Exchange in New Jersey as Parallel to Efforts to Dislodge Drug Prohibition,” Master’s Thesis, New York, NY, The New School Graduate Program in International Affairs, 2008.
[204] “GCADA — Governor’s Council on Alcoholism and Drug Abuse,” accessed May 24, 2021, https://gcada.nj.gov/home/.
[205] NJPP analysis of municipal ordinances related to alcohol use and “rowdy houses” private property between program launch and 2018.
[206] American Public Health Association Policy Statement, “Defining and Implementing a Public Health Response to Drug Use and Misuse,” November 2013, www.apha.org/policies-and-advocacy/public-health-policy-statements/policy-database/2014/07/08/08/04/defining-and-implementing-a-public-health-response-to-drug-use-and-misuse.
[207] New Jersey Department of Children and Families, “Plan of Safe Care for Infants Identified at Birth and Affected by Substance Use or Drug Withdrawl – CPP-II-C-2-800,” www.nj.gov/dcf/policy_manuals/CPP-II-C-2-800_issuance.shtml; New Jersey Department of Children and Families and New Jersey Department of Health,“Public Comments and Agency Responses for Adopted New Rules: N.J.A.C. 3A:26 and Adopted Amendments: N.J.A.C. 8:43A-1.3 and 28.7 and 8:43G-1.2 and 2.13,” December 2017, https://nj.gov/health/legal/documents/adoption/DCF%20and%20DOH%203A_26.pdf.
[208] Loren Siegel, “Uprooting the Drug War.”
[209] “Pregnancy and Substance Use: A Harm Reduction Toolkit,” National Harm Reduction Coalition, https://harmreduction.org/issues/pregnancy-and-substance-use-a-harm-reduction-toolkit/.
[210] Ronald Ostrow, “Casual Drug Users Should Be Shot, Gates Says,” Los Angeles Times, September 6, 1990, https://www.latimes.com/archives/la-xpm-1990-09-06-mn-983-story.html. Michael McGrath, “Nancy Reagan and the Negative Impacts of the ‘Just Say No’ Anti-Drug Campaign,” The Guardian, March 8, 2016, https://www.theguardian.com/society/2016/mar/08/nancy-reagan-drugs-just-say-no-dare-program-opioid-epidemic. Statewide Narcotics Plan.
[211] McGrath, “Nancy Reagan and the Negative Impacts of the ‘Just Say No’ Anti-Drug Campaign.”
[212] Forand, Rebecca. | For NJ.com, “D.A.R.E. Program in N.J. as You Know It Is Gone,” nj, May 20, 2015, www.nj.com/south/2015/05/dare_to_be_different_njs_anti-drug_program_had_new.html.
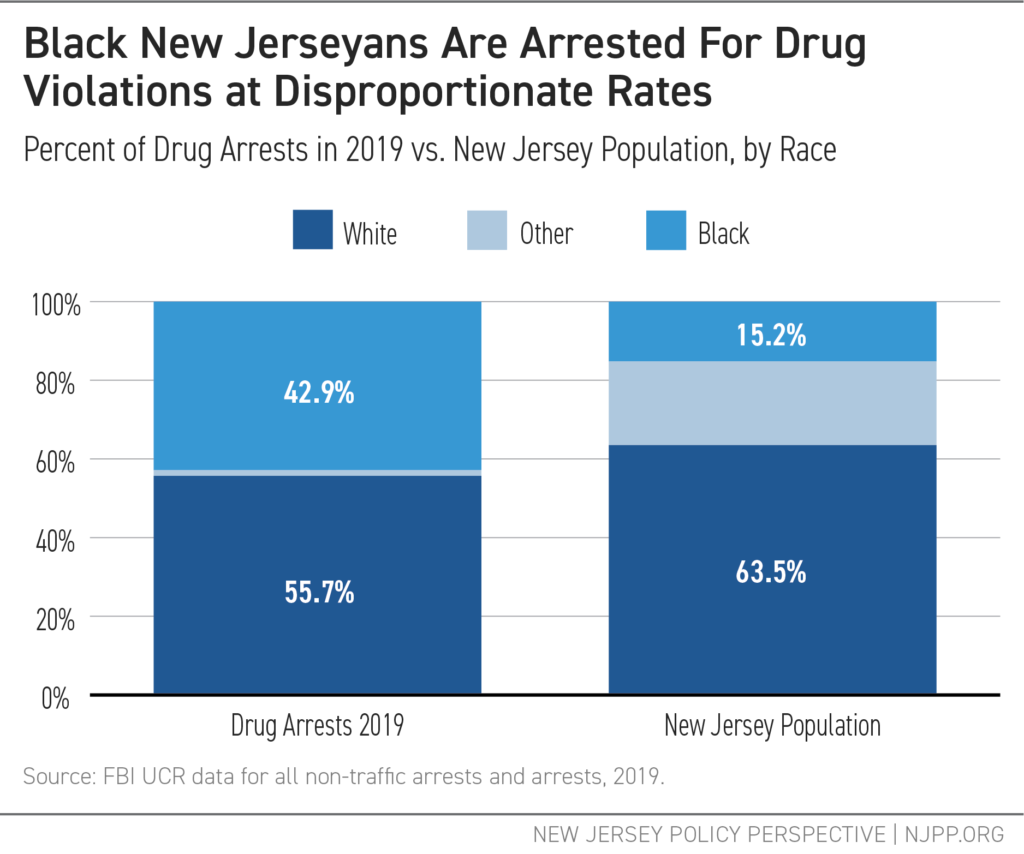
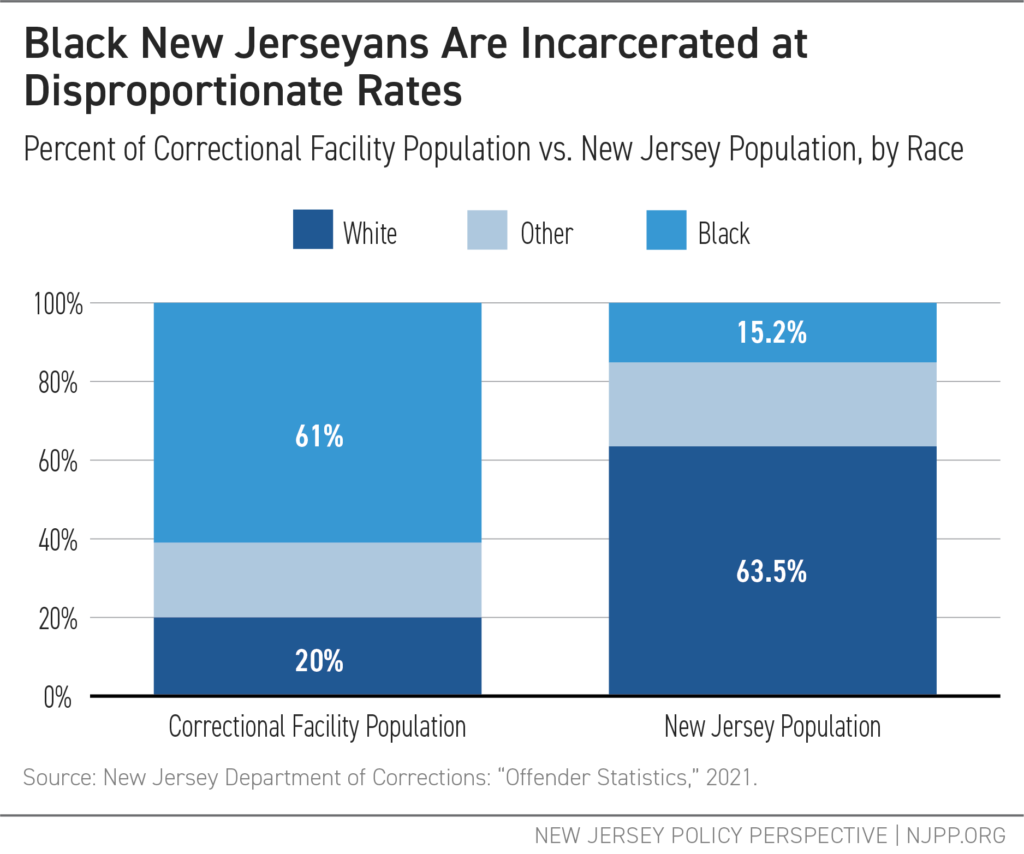
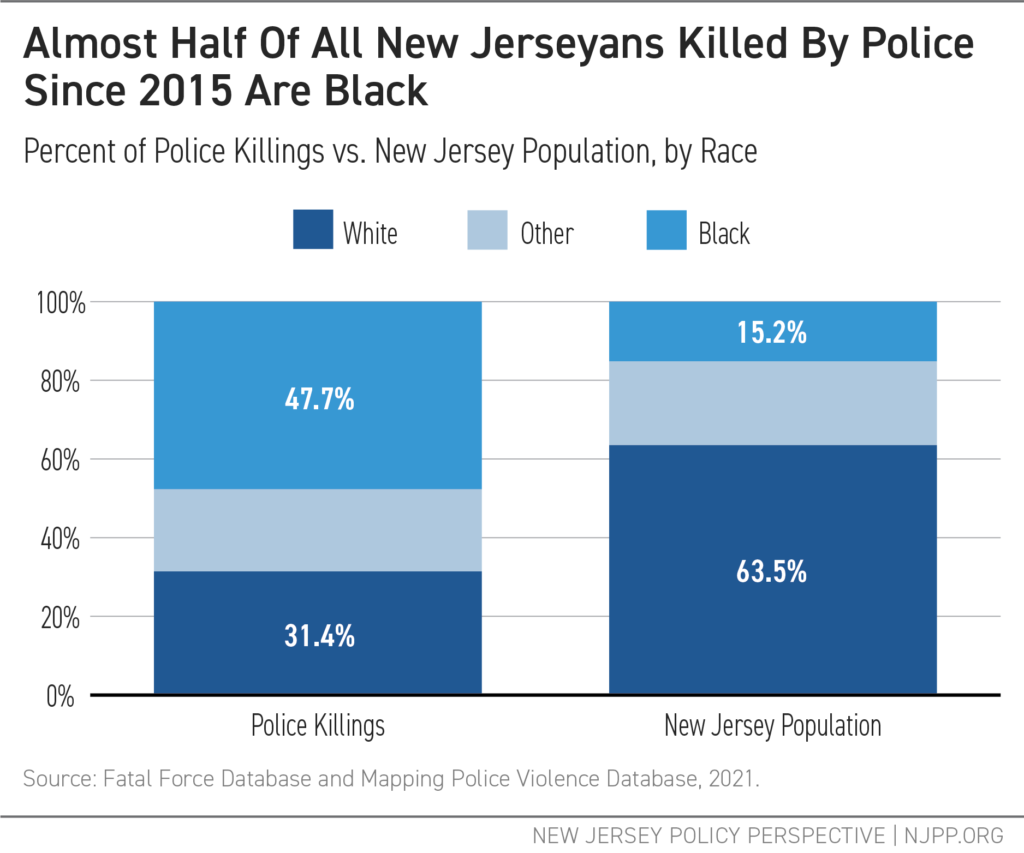
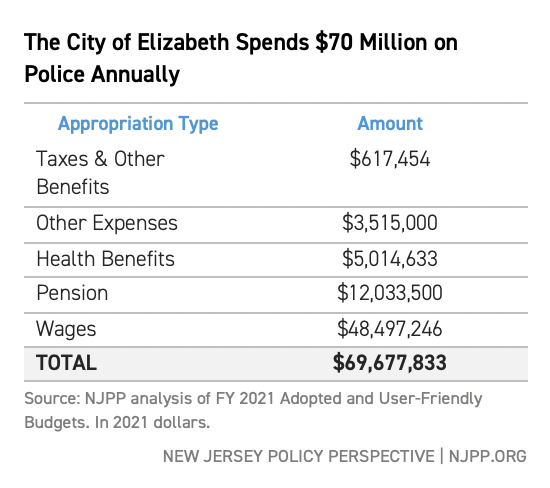
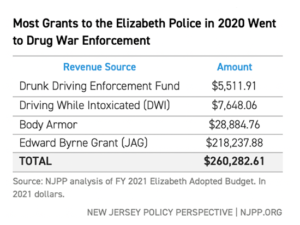
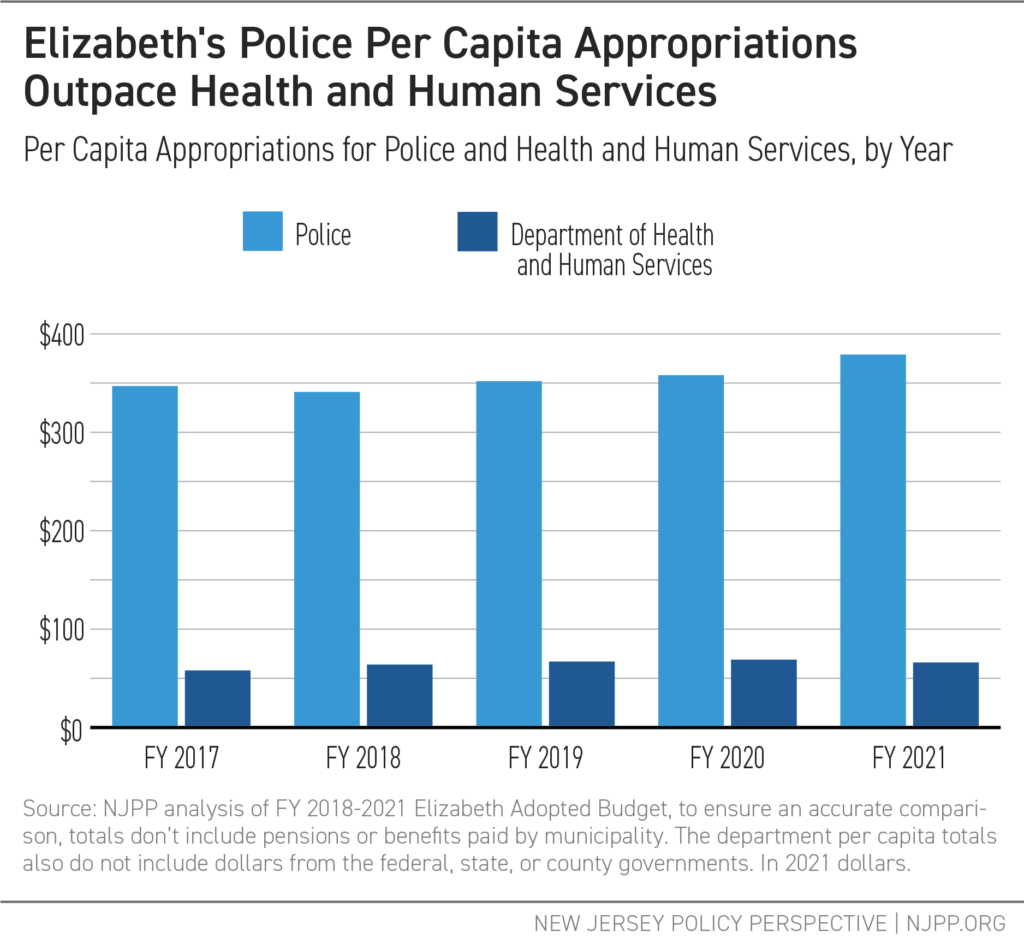
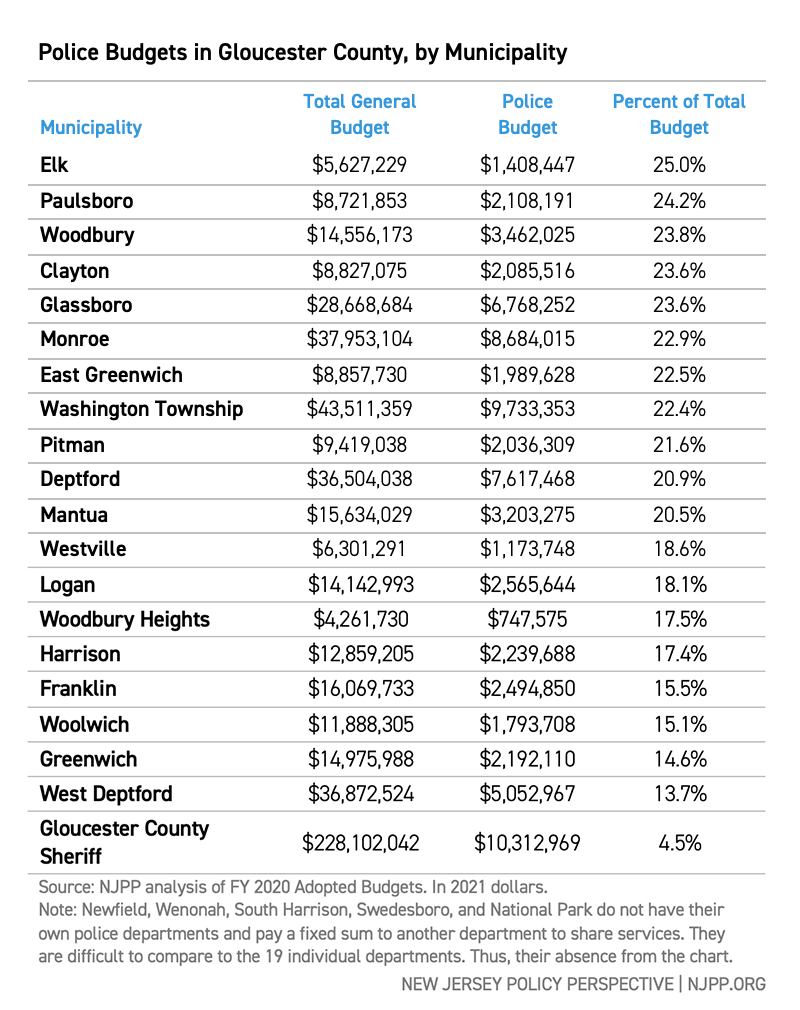
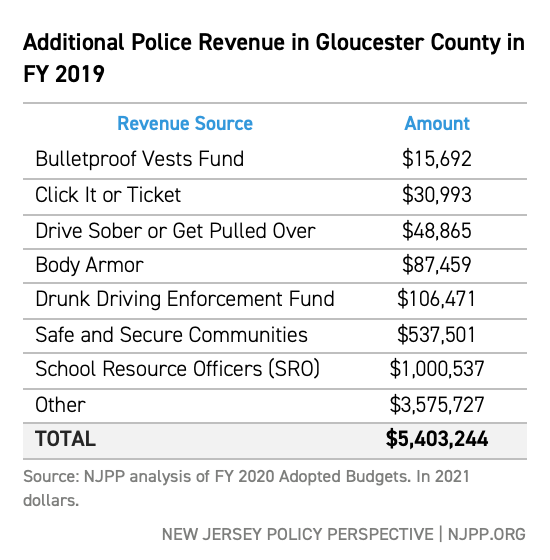
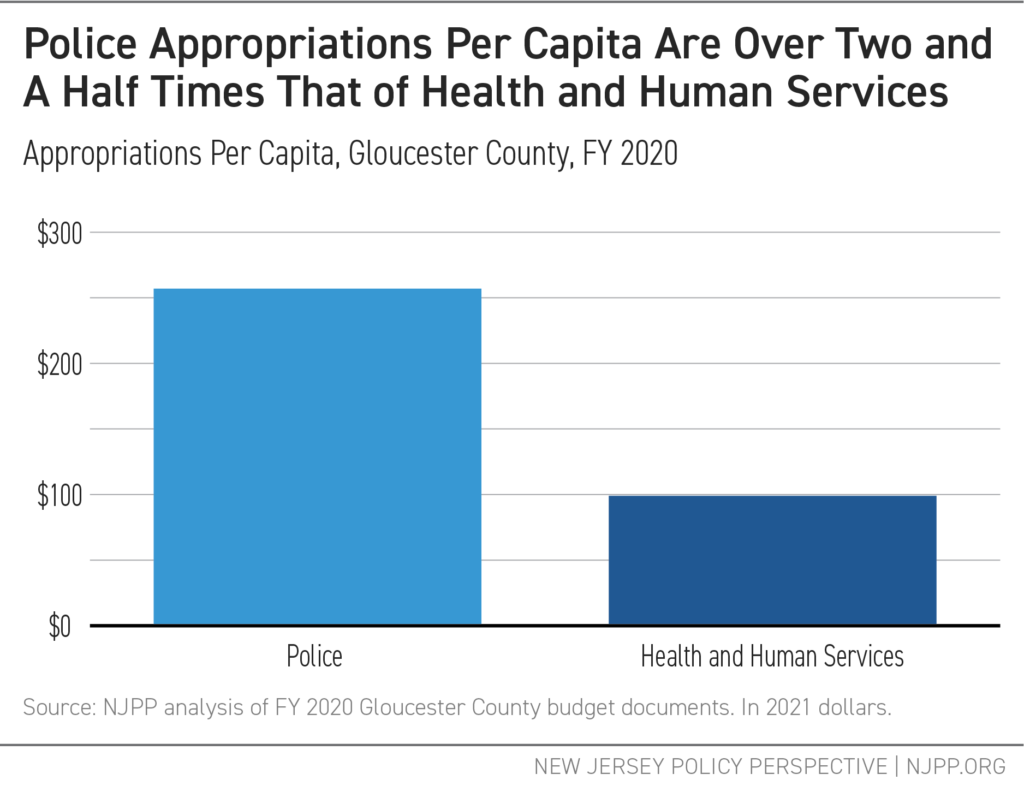
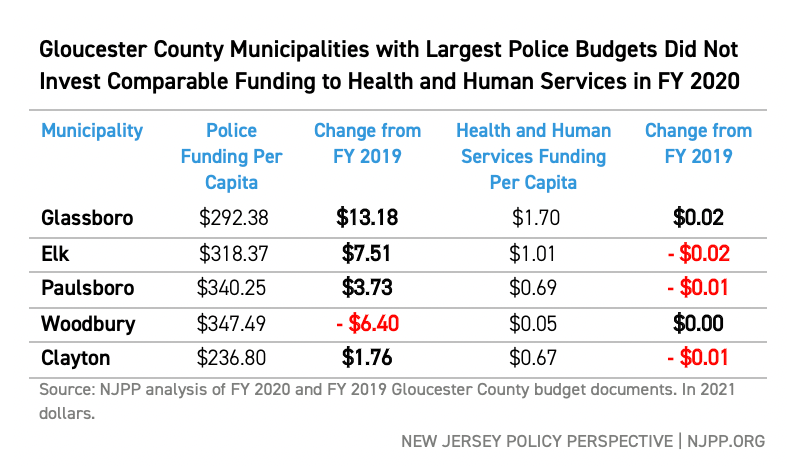
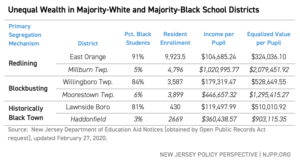
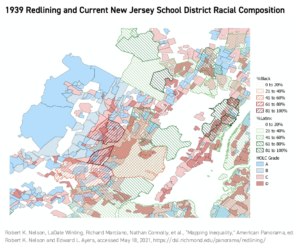
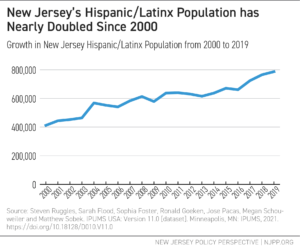
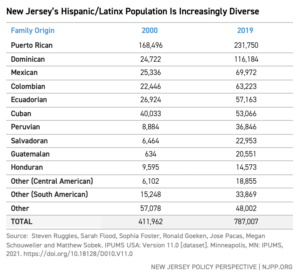
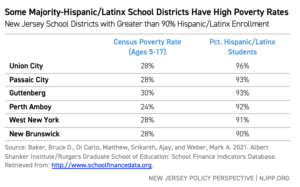
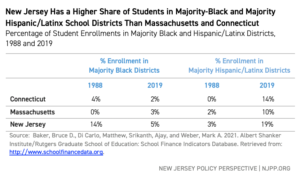
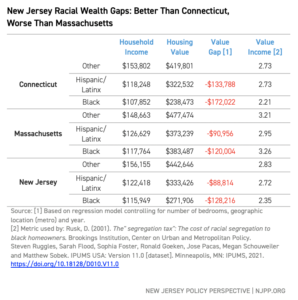
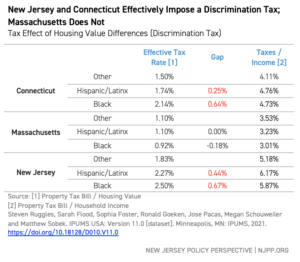
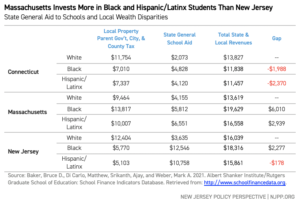
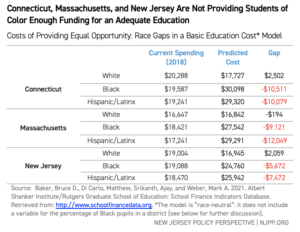
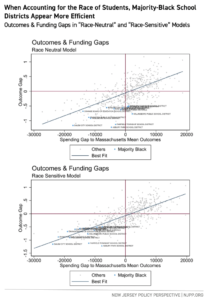
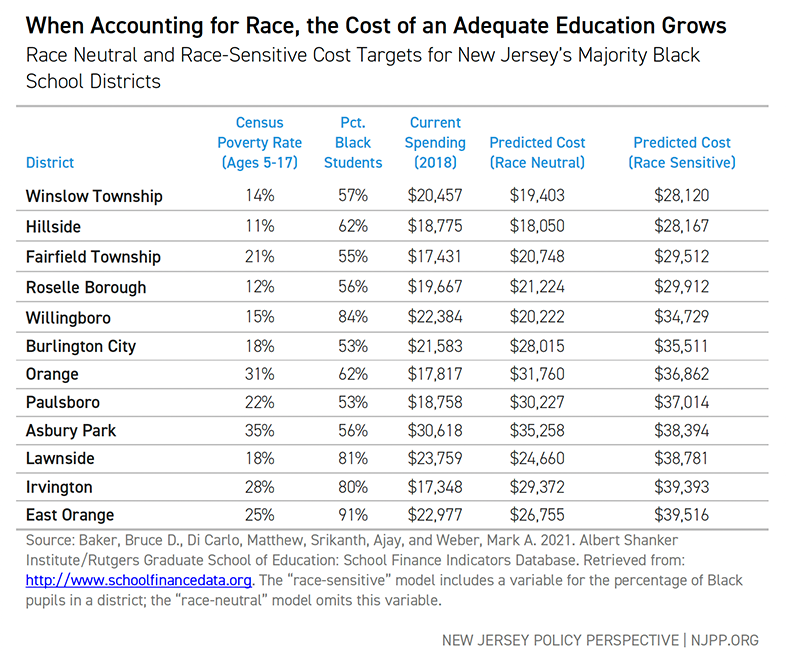
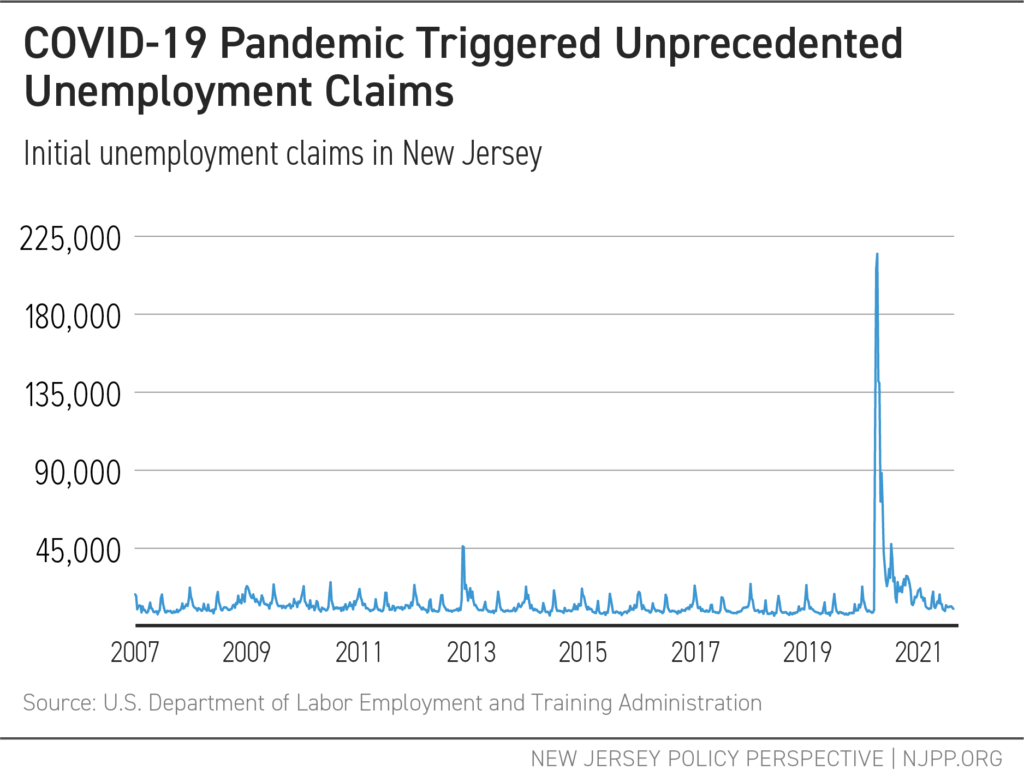
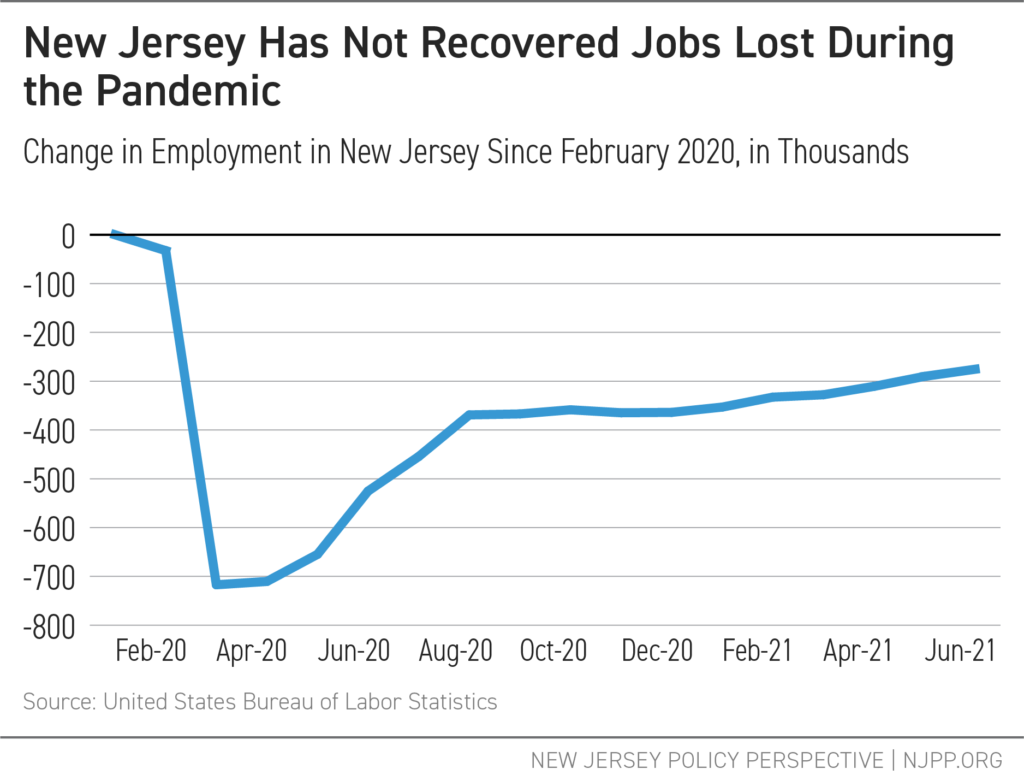
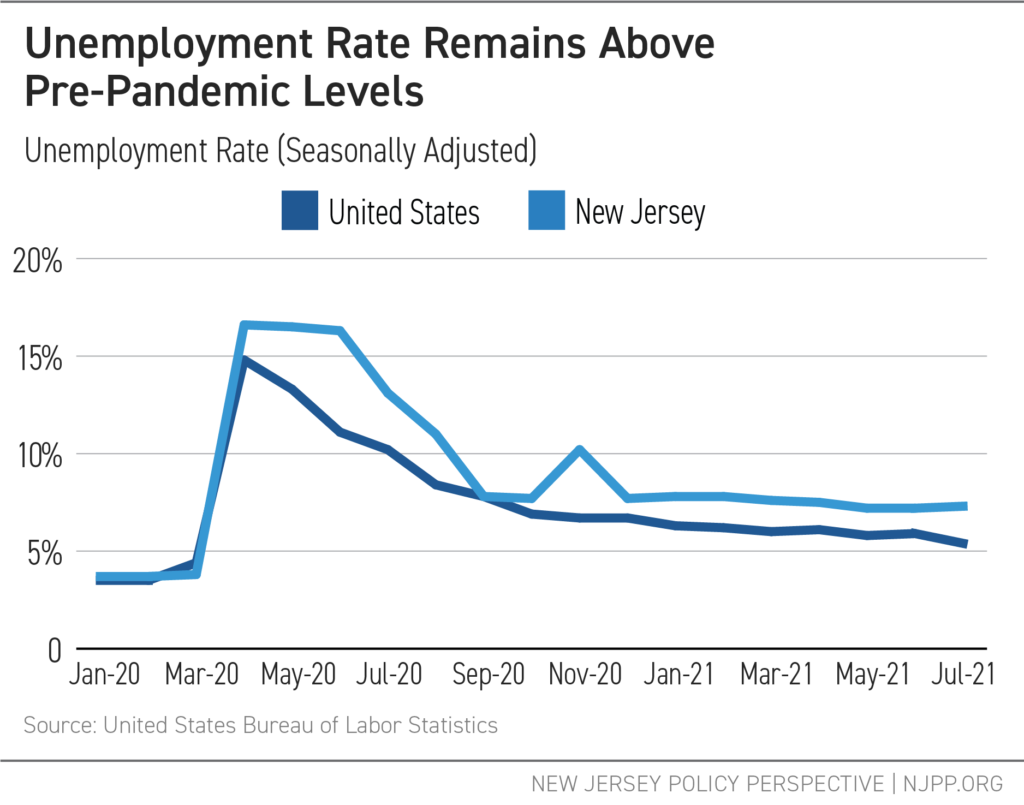
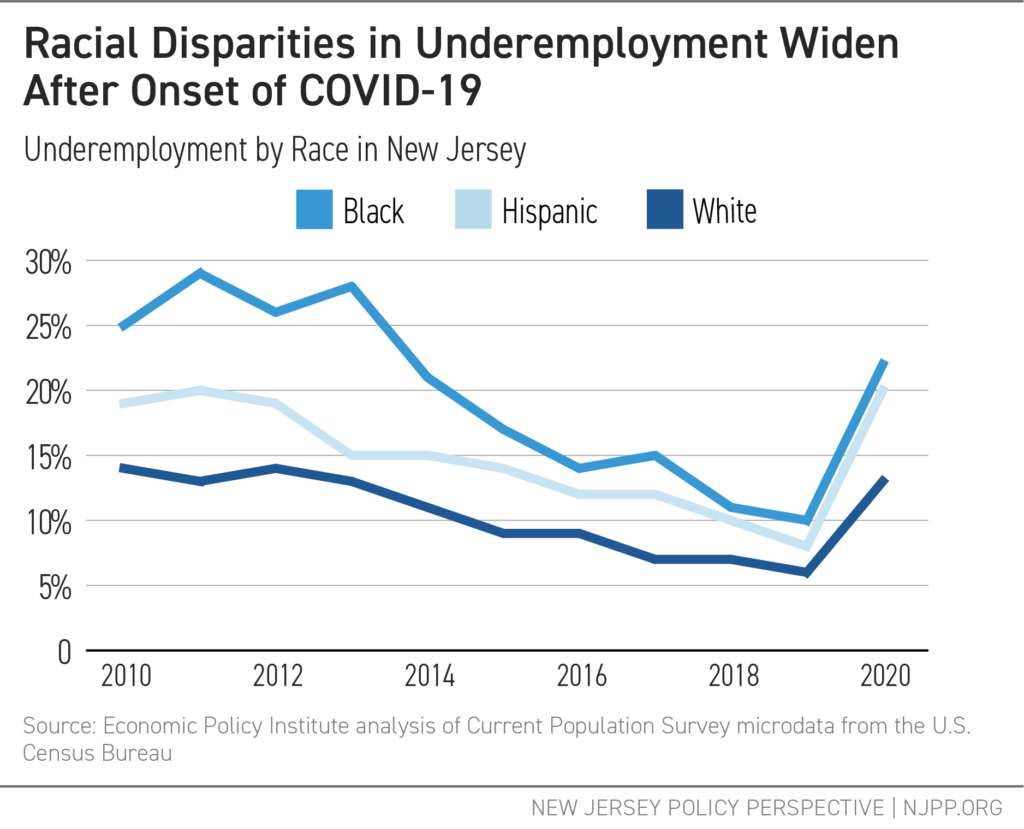
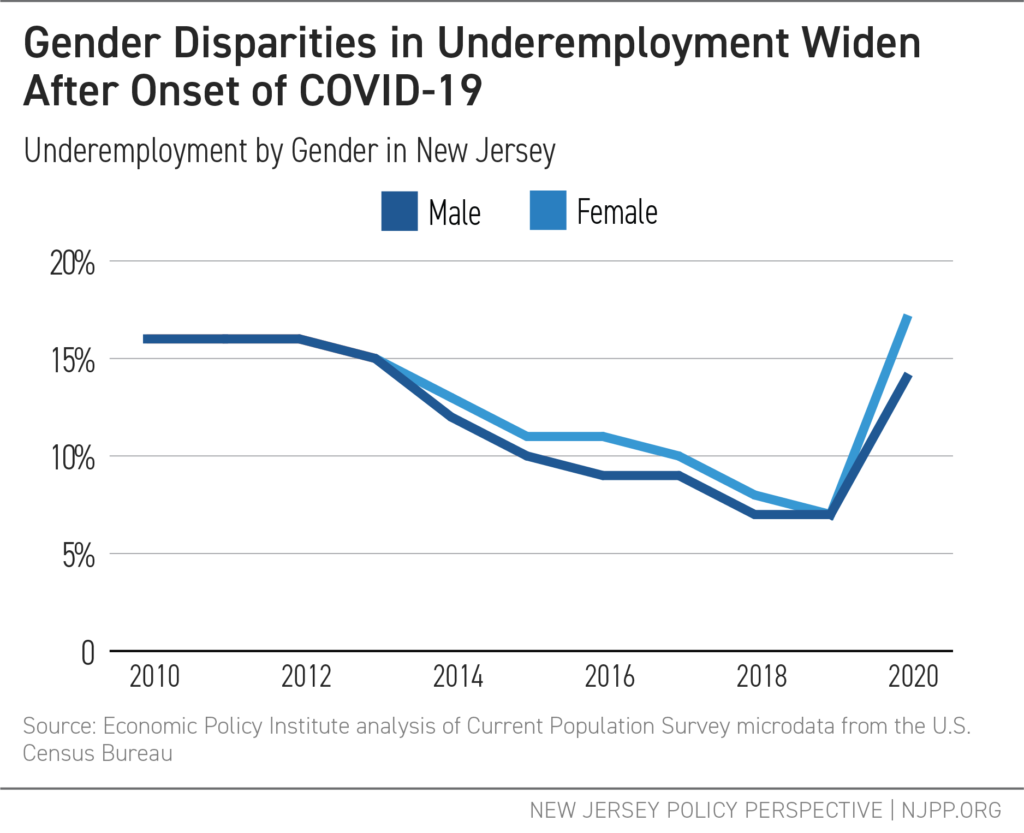
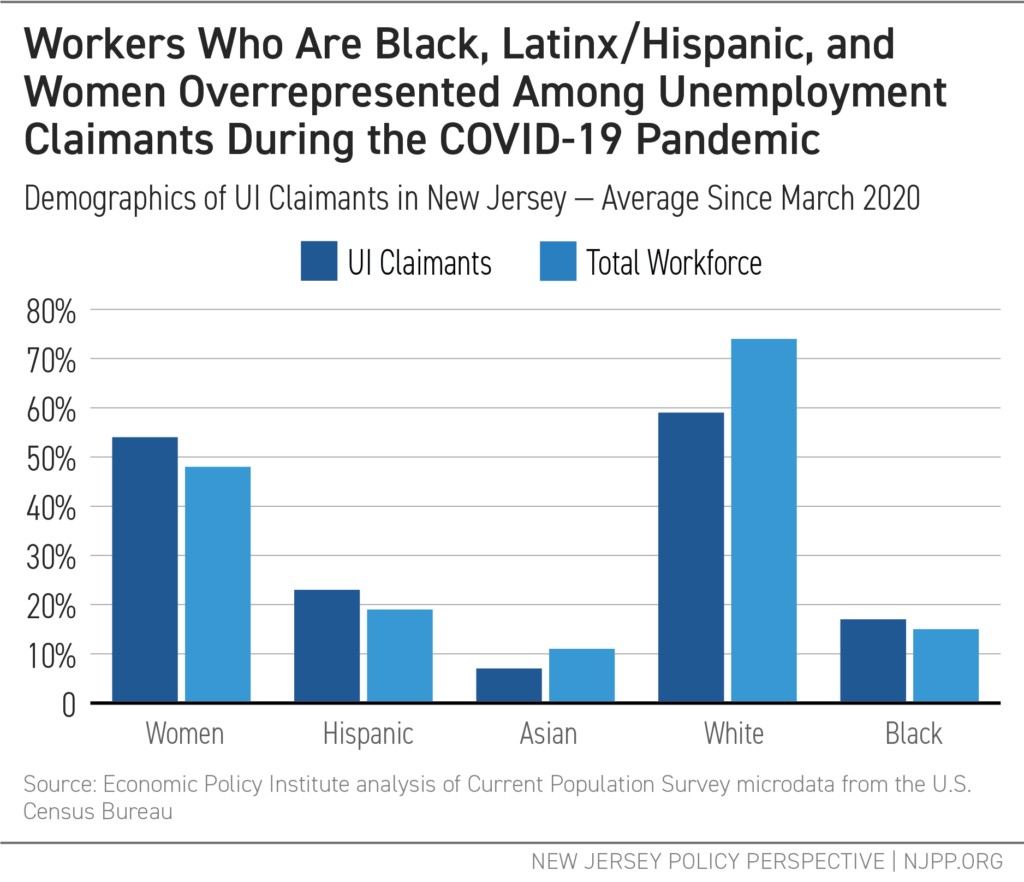
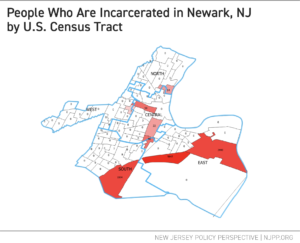
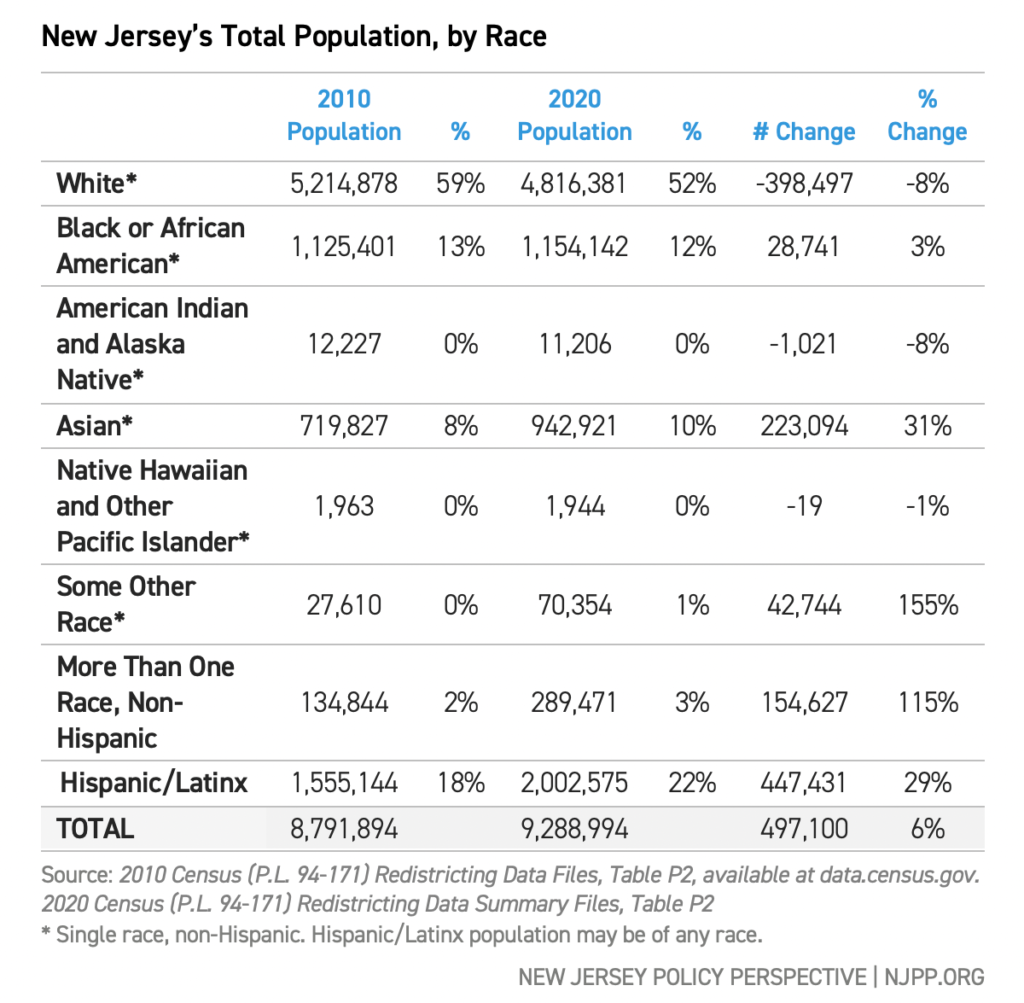 Child Population