Expanding the Child and Dependent Care is a Great First Step in Addressing New Jersey’s Child Care Crisis

Earlier today, the New Jersey Senate and Assembly passed S4065/A6071, expanding the state Child and Dependent Care Tax Credit by making it fully refundable so that low-income residents can receive a cash refund even if the credit amount is higher than their annual income. In response to the Legislature passing the bill, New Jersey Policy Perspective (NJPP) releases the following statement.

Peter Chen, Senior Policy Analyst, NJPP:

“This legislation will help working families meet the high price of child care in New Jersey and balance work-family obligations that often seem insurmountable. Expanding the child and dependent care tax credit will put money back in the pockets of parents and caretakers who face staggering annual childcare costs, which are often as high as in-state college tuition.

“Although this is only a one-year change and a small part of addressing New Jersey’s child care crisis, the expanded credit is a critical lifeline for families struggling to care for the state’s youngest children — and a step toward making this a more just and equitable state that treats working people with dignity.”

###

New Jersey Can Use American Rescue Plan Funds to Invest in Non-Police Approaches to Public Safety

New Jersey — and other states — can invest in proven, community-based approaches to public safety through the American Rescue Plan (ARP), according to a new report from the Center on Budget and Policy Priorities. By shifting away from law enforcement-based approaches to issues of mental health, substance abuse, school safety, and traffic safety, states can achieve better outcomes for everyone.

Decades of punitive policy making have made the United States one of the most incarcerated countries in the world, while ballooning police and corrections spending, even amid declines in violent and property crime rates.

The ARP is an unprecedented opportunity to invest in programs that will increase public health and safety while decreasing the need for police intervention. Signed into law in March 2021, the $1.9 trillion package offers flexibility for state and local governments to fund a wide range of programs that can be catered to the unique needs of communities.

States can address racial and other inequities in the criminal legal system, reducing unnecessary police stops that too often result in arrests and incarceration, and reducing acts of police violence, which disproportionately harm people of color and communities that have been pushed behind by decades of exclusionary policies.

New Jersey, specifically, has some of the worst Black-white disparities in police use of force and incarceration in the country. The state also prioritizes investments in law enforcement, which outpace investments in health and human services, as outlined in the NJPP report released earlier this year, To Protect and Serve: Investing In Public Safety Beyond Policing.

We can create safer communities, lower police violence, and reduce arrests, incarceration, and related costs by investing ARP funds in:

  • Mental health: The ARP’s additional Medicaid resources and $3 billion in funding for mental health and substance use disorders can help states prevent related arrests and incarceration. Many communities send police instead of health care professionals to respond to mental health crises or drug-related cases, which disproportionately harm people of color. Nationwide, approximately 10 percent of police contacts involve individuals with mental health needs, and 23 percent of people killed by police have a mental health need.
  • Education: School districts and state education departments can use the ARP’s $122 billion in mostly flexible education funds to replace school police with alternative interventions for students. Positive behavioral supports, trauma-informed training for staff, and restorative justice can reduce involvement in the criminal legal system, especially for students of color.
  • Housing: States can use the ARP’s targeted housing funds to prevent evictions, increase affordable housing, and reduce homelessness — all of which contribute to lower crime and stronger communities.
  • Traffic safety: State and local governments can use ARP funds to create new non-police units that focus on traffic safety instead of traffic enforcement, reducing the most common police interaction with the public, which disproportionately targets people of color.
  • Other interventions: States and localities can use federal funding to invest in violence interrupters and crisis response teams, which respond to crises with mental health professionals rather than armed police officers. Other interventions also include out-of-school programs, nutrition assistance, job training, and subsidized jobs. All of these investments have been shown to reduce crime.


For more information, read the new report by the Center on Budget and Policy Priorities, Using Federal Relief Funds to Invest in Non-Police Approaches to Public Safety.

Expanding the Child and Dependent Care Services Tax Credit Enables Children, Families, and the Economy to Succeed

Good morning. I’m Peter Chen and am a Senior Policy Analyst at New Jersey Policy Perspective (NJPP).

I am testifying today in support of A-6071, which expands the child and dependent care tax credit to a wider range of households, many of whom will now see more money back to assist with high child care costs. NJPP commends the Legislature for its commitment to helping families meet the high cost of child care, and for recognizing the critical role child care plays in enabling children, families, and New Jersey’s overall economy to succeed.

However, I would like to highlight a few areas where this legislation could be improved, either in this session or in revisions in a later session. These suggestions focus on four key areas: 1) focusing the credit’s benefits more heavily on low-income families, 2) permitting easier filing for those claiming informal care expenses, 3) ensuring permanent implementation (as opposed to the Senate version which was voted out of committee), and 4) do not sunset the credit after one year.

1. Focus on low-income families’ expenses

Although child-care expenses are high across all income ranges, there is a remarkably high floor for any child care that complies with basic health and safety standards.

The state’s most recent child-care market rate study (required by federal law to help establish appropriate child care subsidy payment rates) indicates that even in the lowest-cost “cluster” of communities, a median infant care provider cost $800 per month, or nearly $10,000 annually.[i]

It should come as no surprise, then, that low-income families pay a much higher percentage of their income towards child care.

Income relative to federal poverty level Average weekly child care expenditures Share of families’ income spent on child care

Less than 200% FPL

~$50k for family of four

$188 35%
200-399% FPL

~$50-100k for family of four

$197 14%

400-599% FPL

~$100-150k for family of four

$224

10%

Source: Rasheed Malik, Center for American Progress, Working Families Are Spending Big Money on Child Care (2019).

The above table shows how low-income families spend a much higher percentage of income on child care, and spend only marginally less on child care than their moderate-income peers.

However, based on the proposed legislation, people in the lowest levels of poverty, earning less than $20,000 annually, would be eligible for the same percentage of the federal credit as they did the year before. Meanwhile, households in the upper-income ranges of eligibility, who would not previously have qualified, could receive substantial benefits, especially with the larger federal credit under the American Rescue Plan.

NJPP acknowledges that middle-income and upper-income families also need state investment in child care in order to manage their high costs, and that these families rarely qualify for other child care assistance. Nonetheless, the harshest impacts of child care costs largely fall on the lowest-income New Jerseyans, who benefit only slightly from this new legislation.

2. Expand coverage of informal care

Because New Jersey’s credit builds on the federal, we rely on the federal definition for child care expenses. Yet these definitions and administrative requirements may leave out home-based, relative, or informal providers, who low-income families disproportionately employ for cost, flexibility, or availability.

For example, in order to claim the federal credit, a household must identify the tax identification number of the child care provider. Failure to furnish a correct number may result in a penalty for the provider.[ii] Additionally, an informal provider is less likely to provide the kinds of receipts and paperwork that licensed centers provide.

A more equitable child and dependent care tax credit should more flexibly define what qualifies as a care-related expense.

3. Build in tax outreach for potentially eligible households

Given extensive provision of family and child benefits through the tax code, the importance of easy tax filing without red tape for low- and moderate-income families has never been higher. Estimates suggest that up to 40 percent of eligible New Jersey families may be missing out on Child Tax Credit benefits, blunting the anti-poverty effects and highlighting the lack of tax filing assistance capacity and outreach for these families.

Even under the current definition of child care expenses, many households may have expenses that they do not realize qualify them for substantial benefits, particularly families who are non-filers or who do not realize that informal care can still qualify for the credit as long as the household can document those expenses.

A robust outreach effort (along the lines of paid family leave, the state health insurance marketplace, and other state-run programs focused on maximum usage) through child care providers and other community-based organizations could increase the impact of the tax credit for low-income families.

4. Do not sunset the credit at one year

Family child care expenses will not end when tax year 2021 ends. Indeed, all signs indicate continued upwards growth in child care expenses. It was therefore disappointing to see the Senate version approve a one-year sunset on these changes. NJPP urges the committee to leave the credit for future years, as part of a broader set of tax credit reforms to help all families succeed.

Thank you for this opportunity to testify today.


[i] Jeounghee Kim & Myungkook Joo, 2017 New Jersey Child Care Market Rate Price Study, at p. 26, available at https://www.childcarenj.gov/getattachment/Resources/Reports-and-Statistics/2017-New-Jersey-Child-Care-Market-Price-Study-pdf.pdf.aspx?lang=en-US

[ii] See Internal Revenue Service, Form W-10, https://www.irs.gov/pub/irs-pdf/fw10.pdf

It’s Time to Decriminalize Syringes and Expunge Past Records

Good morning, Chairman Mukherji, Vice-Chairwoman Murphy, and members of the committee. My name is Marleina Ubel and I am a Policy Analyst at New Jersey Policy Perspective (NJPP). Thank you for this opportunity to submit testimony on New Jersey’s decriminalization of syringes and expungement of past records (A5458).

As I am sure you are aware, NJPP works to create a more equitable state for New Jersey residents through research and advocacy. In line with this mission, we support A5458. This bill is a step towards breaking the cycle of punishment, debt, and stigma for people living with a substance use disorder.

Syringes are also public health tools. Access to new syringes reduces the risk of skin infections and infectious diseases, such as, HIV/AIDS and Hepatitis C. Criminalizing syringes also puts first responders at greater risk for infections because people have to hide or improperly dispose of syringes due to fear of arrest.

Despite New Jersey law legalizing the purchase of syringes without a prescription, New Jerseyans continue to be charged for syringe possession, creating a system where people are arrested for possessing public health supplies that were legally purchased.

The Legislature can take steps to break the cycle of criminalization and reduce the spread of infectious disease by voting yes on A5458.

Thank you for your time and the opportunity to testify.

Expanding the Child and Dependent Care Tax Credit Will Help More New Jerseyans Meet the High Costs of Child Care

Earlier today, the Assembly Appropriations Committee unanimously passed A6071, making the state Child and Dependent Care Tax Credit refundable so that low-income residents can receive a cash refund if the credit amount is in excess of their gross income tax liability. In response to A6071 advancing out of committee, New Jersey Policy Perspective (NJPP) releases the following statement.

Peter Chen, Senior Policy Analyst, NJPP:

“Expanding the Child and Dependent Care Tax Credit will help more low- and middle-income families and their children meet the back-breaking costs of child care. Among low-income households nationally, average child care expenses eat up 34 percent of income.

“However, this legislation is only a first step towards meeting the broad range of costs facing families with children requiring care. Lower-income families with children spend a higher percentage of their income on child care and should receive a fairer share of the tax credit’s benefits. Child care assistance should more broadly reflect the financial needs of families, as well as covering informal child care, which makes up the bulk of non-parent child care. 

“New Jersey families can’t wait for relief from high child care costs, and a more equitable Child and Dependent Care Tax Credit is a good start. But a one-year bill will continue to treat child care expenses as one-off extraordinary events, rather than a core part of any family raising children in New Jersey.”

# # #

To Protect and Serve: Investing in Public Safety Beyond Policing

Introduction

After the murder of George Floyd, millions of people across all 50 states protested against police brutality and racial injustice.[i] Floyd’s death followed a long history of police violence against Black people and was heavily covered in the national media along with the police murders of Breonna Taylor, Elijah McClain, and Tony McDade.

Models of public safety that center police are premised on punishment and have far-reaching consequences, especially for young Black men.[ii] Beyond police brutality, which is the most life-threatening and visible failure of the current criminal justice system, frequent police interactions are linked to adverse mental health outcomes, including anxiety, depression, and posttraumatic stress disorder.[iii] These outcomes are exacerbated in communities of color. Due in part to a history of racial profiling, Black men in particular experience high levels of depression and anxiety over the very possibility of encounters with police.[iv] Taken together, these harms have prompted a widespread examination of the actions of law enforcement and a close evaluation of the role that budgets, which are a measure of municipalities’ values and priorities, play in funding ineffective and deadly practices that disproportionately target Black residents.

This report examines how New Jersey can create a safer, healthier, and more equitable state for all by reimagining public safety and exploring crisis response models that are not led by police. The first sections of this report provide important historical context on how policing evolved into the system seen today. In short, the racialized history of criminal justice policies and practices, such as “broken windows” policing and the War on Drugs, encouraged aggressive policing tactics, skyrocketing incarceration rates, and larger police budgets.

Next, this report examines police budgets in two distinct geographical areas — the City of Elizabeth and Gloucester County — to highlight how, regardless of the geographic region, local governments invest vast resources on law enforcement while essential health and human service programs are underfunded. Elizabeth is a diverse, vibrant city in Northern New Jersey. Its police budget makes up 19 percent of the total municipal budget and has increased by an average of $1.8 million each year since 2018. In comparison, Gloucester County is a more rural area in Southern New Jersey that, while not lacking in racial and ethnic diversity, has a more segregated population than Elizabeth.[v] Across the county, local police budgets vary from about 14 percent to 25 percent of the total municipal budget, with an average of 20 percent. In total, local governments in Gloucester County appropriated over $77 million to police departments in Fiscal Year (FY) 2020 alone.[vi] The report then puts police budgets in context by comparing them to local investments in health and human service programs, which promote public safety more broadly by addressing the structural root causes of crime.

Finally, this report proposes alternative models to public safety that are centered on harm reduction and a broader vision for a safer and more just New Jersey. This includes a range of public health policies designed to minimize negative social, emotional, and physical outcomes for all residents. The policy recommendations included in this report were crafted with input from residents directly harmed by police violence, as well as faith and community leaders.

Policing in the United States: A Primer

Policing and race have always intersected in the United States. From the horrors of slavery, to the terror of Jim Crow, to the modern era of mass incarceration, the U.S. has systematically used public policy and the criminal legal system to disempower and subjugate Black residents. Policies that define criminal behavior or “crime” have changed over the years and, as demonstrated below, are often racialized and used to maintain social control rather than to promote public safety. Whether expressly or implicitly, police departments are the enforcement arm of these public policies. The following section examines the link between racism and law enforcement and the role policing plays in creating and maintaining racial inequities.

Slave Patrols (1700s–1800s)

Most modern police departments can trace their roots directly to slave patrols, which were organized, government-sanctioned groups of armed men who monitored and, by use of violence, regulated the activity of people who were enslaved. Indeed, historians describe slave patrols as the first publicly funded police departments in the South.[vii]

Slave patrols were first established in the early 1700s to enforce slave codes, or laws that defined enslaved people as property.[viii] The patrols served three main functions: chase down those who had escaped, “provide a form of organized terror to deter slave revolts,” and punish any enslaved worker who was alleged to have violated the rules of a plantation.[ix]

Historical evidence suggests the beating and terrorizing of enslaved people by patrollers was officially justified as a civic duty.[x] In many states, serving on these patrols was required of all able-bodied white men.[xi]

After the end of the Civil War, slave patrols evolved into police departments, carrying over many aspects of the patrol, including the systematic surveillance of Black communities.[xii] In the years that followed slavery, the primary role of police departments was to enforce Black Codes, an extension of the slave codes, and Jim Crow segregation laws, both of which were designed to deny Black residents equal rights and maintain the de facto structure of slavery.[xiii] 

The Great Migration and Segregation (1900s–1970s)

Due, in part, to the brutal enforcement of segregation laws in the South, millions of Black residents moved from Southern states to Northern states between 1916 and 1970, a population shift known as the Great Migration.[xiv] People who migrated, however, would come to find that segregation and systemic racial violence were also woven into the fabric of Northern states. Contrary to popular belief, segregation began in Northern abolitionist states with the country’s first racially separate railcar operating in 1838.[xv]

In Northern states, police departments did not develop as a response to crime but, rather, “disorder.”[xvi] Governments tasked police with the surveillance and control of disenfranchised people: poor workers, immigrants, and Black people.[xvii] Again, police were encouraged to use force against these disenfranchised communities, and police violence was commonplace in the early 1900s.[xviii]

At this time, police were required to enforce segregation and keep order by squashing any unrest, or perceived unrest, among Black communities. By the 1940s, police in Northern states had earned a reputation for protecting whites at the expense of the Black population.

“[Police] used ‘persuasion’ rather than firm action with white rioters, while against Negroes they used the ultimate in force: nightsticks, revolvers, riot guns, sub-machine guns, and deer guns.”

-Thurgood Marshall, describing the experience of protests that erupted in Detroit over police brutality and racial animus due to the increasing Black population, “The Gestapo in Detroit,” The Crisis, 1943

New Jersey, now known as one of the most progressive states in the nation, also played a role in the systemic subjugation of Black residents. Black New Jerseyans could not enjoy summers at the shore, lived in segregated neighborhoods, and were barred from most entertainment and social venues until the passage of federal civil rights legislation in 1965.[xix] De facto segregation and hostility towards Black people, however, continued.

In the summer of 1967, residents of Newark rebelled after witnessing white police officers brutally attack John Smith, a Black cab driver.[xx] While this instance of racial violence was a breaking point for many, the rebellion emerged also in response to rising tensions over “urban renewal” policies that sought to raze and redevelop neighborhoods without input from Black residents as well as and the ongoing abuse and killing of Black people by police.[xxi] After several days, 700 people were injured and 26 died, most of whom were Black.[xxii]

The rebellion lasted less than a week, but its legacy still looms large today, where the relationship between police and the general public remains strained by decades of violence.

“There are still some emotional trauma and other things we haven’t recovered from and social conditions that led to the rebellion itself. And it hasn’t been fully addressed.”

-Newark Mayor Ras Baraka, in response to whether or not the city of Newark had recovered from the 1967 riots, The New York Times, 2017

The War on Drugs and Mass Incarceration (1970s–2000s)

The Civil Rights movement brought inequities faced by Black and brown people to the forefront of public consciousness and won major legislative battles in the 1960s, namely the Civil Rights Act of 1964 and the Voting Rights Act of 1965. However, these wins did not prevent policymaking that criminalized and otherwise harmed Black and brown communities. The War on Drugs, 1990s-era crime bills, and the expansion of police powers in recent decades have arguably become an extension of Jim Crow-era policies criminalizing Black people.[xxiii]

The War on Drugs officially began in 1971 when President Richard Nixon introduced a wave of drug enforcement policies, declaring a “full-scale attack” on drug use.[xxiv] Since then, the drug war has led to a slew of federal, state, and local anti-drug policies that militarized police departments, expanded police powers, and ordered aggressive enforcement.[xxv] Nationwide, state and local police spending doubled from $131 per capita to $260 per capita between 1992 and 2008 to support the drug war, even as crime rates decreased.[xxvi] War on Drugs policing strategies also increased rates of police brutality with tactics like “stop and frisk” that encouraged the targeting of people of color.[xxvii]

The War on Drugs also resulted in mass incarceration. The number of people imprisoned in the U.S. increased roughly 6 to 8 percent per year from 1972 to 2000,[xxviii] drug arrests more than doubled between 1980 and 1989, and incarceration rates grew sharply in the 1980s even as violent crime rates fell.[xxix] In 2020, the 2.3 million people incarcerated in the U.S.[xxx] was seven times the number of people incarcerated in 1972.[xxxi]

Moreover, racial disparities in arrest and prosecution after 1972 produced high incarceration rates for Black people but not white people.[xxxii] From 1980 to 1990, Black people were imprisoned at a rate of 6.5 to 6.8 times that of white people,[xxxiii] despite white people both using and selling drugs at similar or higher rates.[xxxiv] By 2021, despite being 13 percent of the U.S. population,[xxxv] Black residents accounted for about 38 percent of all inmates.[xxxvi]

“We knew we couldn’t make it illegal to be either against the war or blacks, but by getting the public to associate the hippies with marijuana and blacks with heroin and then criminalizing them both heavily, we could disrupt those communities. We could arrest their leaders, raid their homes, break up their meetings, and vilify them night after night in the evening news. Did we know we were lying about the drugs? Of course we did.”

-John Ehrlichman, Nixon’s domestic policy advisor in a 1994 interview in response to what the drug war was “really about.”[xxxvii]

The Legacy Continues Today

Now that the history of policing in the United States has been outlined, we can better understand the present state of affairs. This section reviews current Black arrest and incarceration rates, deadly and non-deadly use of police force on Black residents, and how the system of policing, beyond the actions of individual officers, reinforces the rates of racial disparities and violence seen today.

Arrest and Incarceration

The U.S. is home to nearly 20 percent of the world’s prison population despite making up a mere four percent of the global population.[xxxviii] This high rate of incarceration does not indicate that U.S. residents are committing more crimes than their international peers; rather, it points to, in part, the overly harsh consequences of drug convictions. And despite an increased recognition from Democratic and Republican lawmakers alike that we cannot arrest ourselves out of drug use, enforcement of the drug war continues: in 2019 alone, approximately 1.6 million people in the U.S. were arrested, prosecuted, incarcerated, and placed under supervision and/or deported on a drug law violation.[xxxix]

Like the rest of the nation, New Jersey excessively enforces the drug war. Drug violations account for a large portion of arrests across the state, totaling approximately 21 percent of all arrests in 2019.[xl] Drug war arrests have also increased over the past 30 years. In 1986, New Jersey made 398 drug war arrests per 100,000 residents; in 2019, New Jersey made 626 drug war arrests per 100,000 residents — an increase of 57 percent.[xli] To learn more about drug war arrests and the associated social and economic costs, see NJPP’s report, A War on Us: How Much New Jersey Spends Enforcing the War on Drugs.

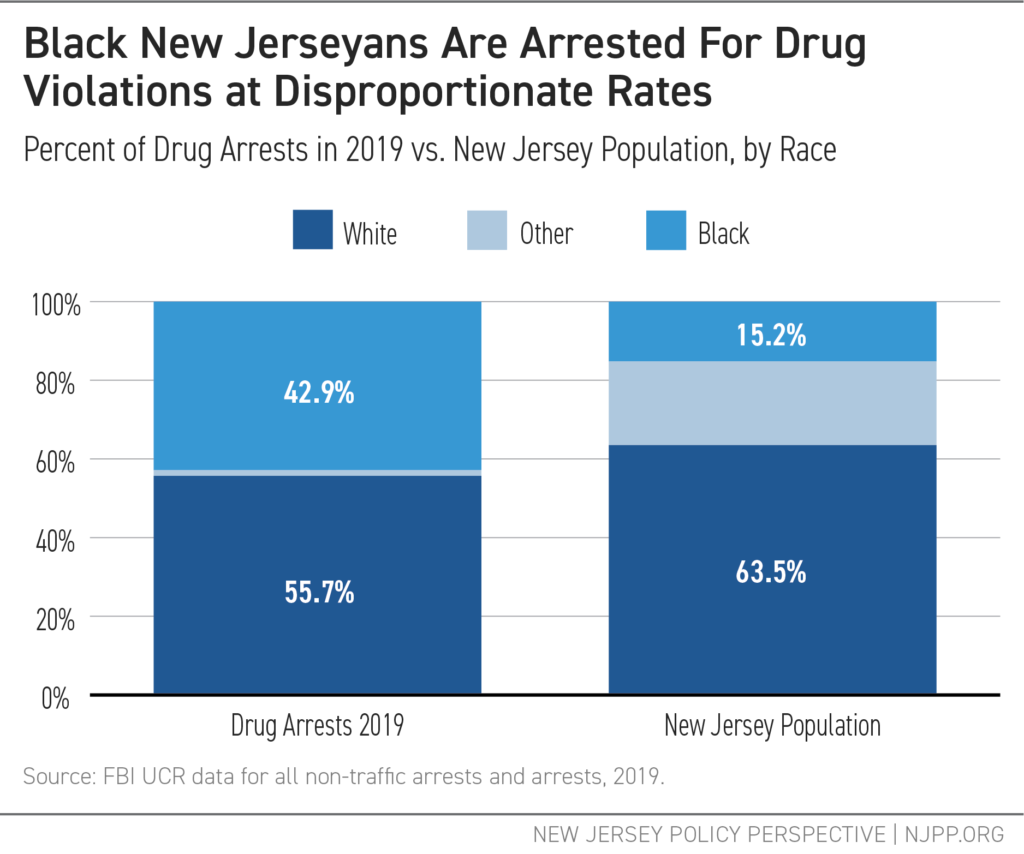
Of those arrested in 2019 in New Jersey for drug violations, 43 percent were Black[xlii] despite Black residents making up 15 percent of New Jersey’s population and national survey data showing that Black residents are no more likely to use or sell drugs than white residents.[xliii]

Black New Jerseyans are Arrested For Drug Violations at Disproportionate Rates - Graph

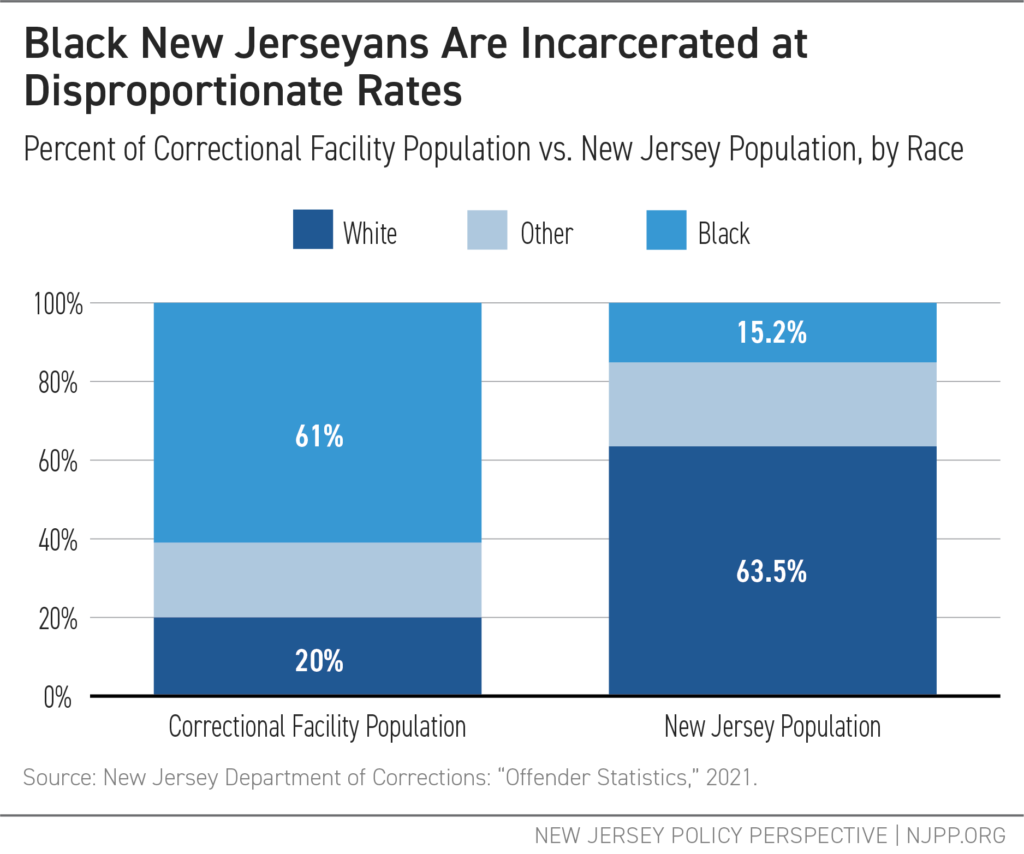
As of January 2021, Black New Jerseyans represent about 61 percent of the state’s correctional population,[xliv] even though they make up about 15 percent of the state population.[xlv] In contrast, white New Jerseyans account for 20 percent of the correction population, while representing 64 percent of the state population.[xlvi]

Black New Jerseyans Are Incarcerated at Disproportionate Rates - Graph

Use of Force

The Movement for Black Lives (M4BL), arguably the largest social movement in recent U.S. history, brought increased attention to the murders of Black residents at the hands of the police and the role that the drug war plays in militarizing police forces, providing pretexts for police brutality.[xlvii]

What M4BL amplifies and what the data show are that police officers are more likely to use force on people of color than other populations. Broadly, use of force is contact that goes beyond what is usually required to make an arrest, including physical force such as striking, kicking, or tackling, and mechanical force, meaning the use of a weapon.[xlviii] Use of force is permitted under specific circumstances, such as in self-defense or in defense of another individual or group.[xlix] But here is where the problem lies: police officers do not receive uniform guidance about when situations necessitate use of force or how much force is appropriate.[l] This is true across the country and in the Garden State, making it difficult to determine police fault in excessive use of force incidents that result in injury or death.

As a result of this ambiguity, use of force has become routine and unchecked. In fact, the following data likely underestimate the magnitude of law enforcement violence given that comprehensive information on deaths, physical injuries, and frequency of encounters is limited and underreported.[li] Based on available New Jersey data, between October 2020 and February 2021, there have been over 5,000 documented incidents of police force across the state, or roughly 37 incidents per day.[lii] Of these incidents, at least 44 percent involved Black individuals, and 63.5 percent involved individuals that were documented as showing signs of being under the influence or having a mental illness.[liii]

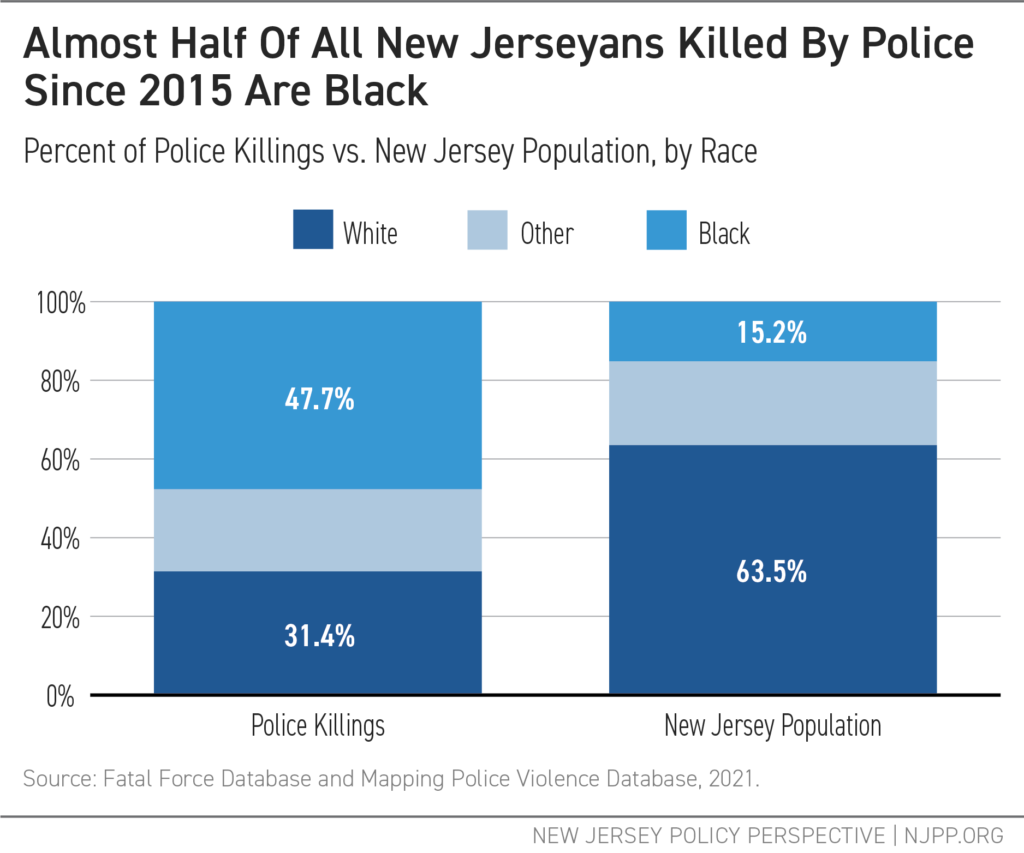
Far too often, police encounters result in not only injury but in death. Since 2015, police in the U.S. have shot and killed more than 5,000 people.[liv] Black people were killed at more than twice the rate of white people.[lv] In New Jersey, there have been 86 known deaths at the hands of police since 2015, with 14 of the people killed documented as showing symptoms of mental illness at the time of their death.[lvi] Almost half, 48 percent, of those killed were Black.[lvii] Consequently, New Jersey has one of the highest racial disparities among victims of police violence in the country: Black New Jerseyans are killed at a rate 8.3 times higher than white residents as compared to the national rate of three times higher.[lviii]

Almost Half of All New Jerseyans Killed By Police since 2015 are Black - Graph

Civilians are not the only ones that can be harmed by the current system of policing. These same policies put police officers into situations for which they are not sufficiently trained or trained at all. For instance, police are often the first responders to calls for mental health emergencies, even though they are not trained mental health professionals. Because of this, there is increased risk of escalation and tragic results, contributing to the stigma, shame, fear, and criminalization of mental illness.[lix] Looking at training more broadly, police in New Jersey can work for 18 months before receiving even full basic police training.[lx]

Many instances of police violence stem from calls where an armed police response may not be the most appropriate. Roughly 58 percent of all police killings escalated from nonviolent situations, such as traffic stops, mental health checks, and domestic disputes.[lxi] One-fourth of all fatal police encounters involve individuals who have a mental illness, making those with mental illness more likely to be killed by a police officer.[lxii]

Despite the high stakes of police encounters, there is little oversight. Police oversight and accountability mechanisms are internal, with investigations often conducted by close colleagues, leaving room for bias. In other words, officers “police” themselves, and based on how police departments are structured historically, there is little guidance, a lack of external oversight, and few consequences.[lxiii] Of the 86 total killings by police in New Jersey between 2015 and 2021, only four officers have been charged with wrongdoing.[lxiv] Of those killed, 14 percent were documented as having no weapon whatsoever, and fewer than half were recorded as having a gun.[lxv]

Further, internal investigations rarely rule in favor of people who file civilian complaints, showing a lack of accountability for police violence more broadly. For example, from 2016 to 2018, the Elizabeth police department received 47 complaints accusing officers of excessive force, wrongful arrest, or other crimes.[lxvi] The internal investigations did not substantiate a single claim despite Elizabeth police officers’ using force at a rate that is 90 percent higher than other departments in New Jersey, including those in larger cities.[lxvii]

In sum, the history of policing in the United States shows a system conceived to surveil and control Black people, and one that has continued to do so well beyond the Civil Rights era of the 1960s. The result has been, at best, ineffectual policing for specific and delicate individual and communal crises and, at worst, active harm against the communities being policed, particularly communities of color. This system is fed by budgetary appropriations at multiple levels.

The Budget

Municipal budgets are much more than line items of revenues and expenses. Where investments are made — and where they are not — highlights what leaders value most. To better inform the ongoing and future debates about police budgets in New Jersey, this section analyzes the police budgets for the urban City of Elizabeth and the more rural Gloucester County. These case studies highlight the similarities and differences between two distinct areas, creating the opportunity to explore flexible recommendations that will not be one-size-fits-all. It also shows that investments in police departments are significant across the state, not just in densely populated areas. Please note that, from here on out, references to Gloucester County or Gloucester refer to the combined police budgets and departments of all of the municipalities within the county, as well as the Gloucester County Sheriff’s Office.

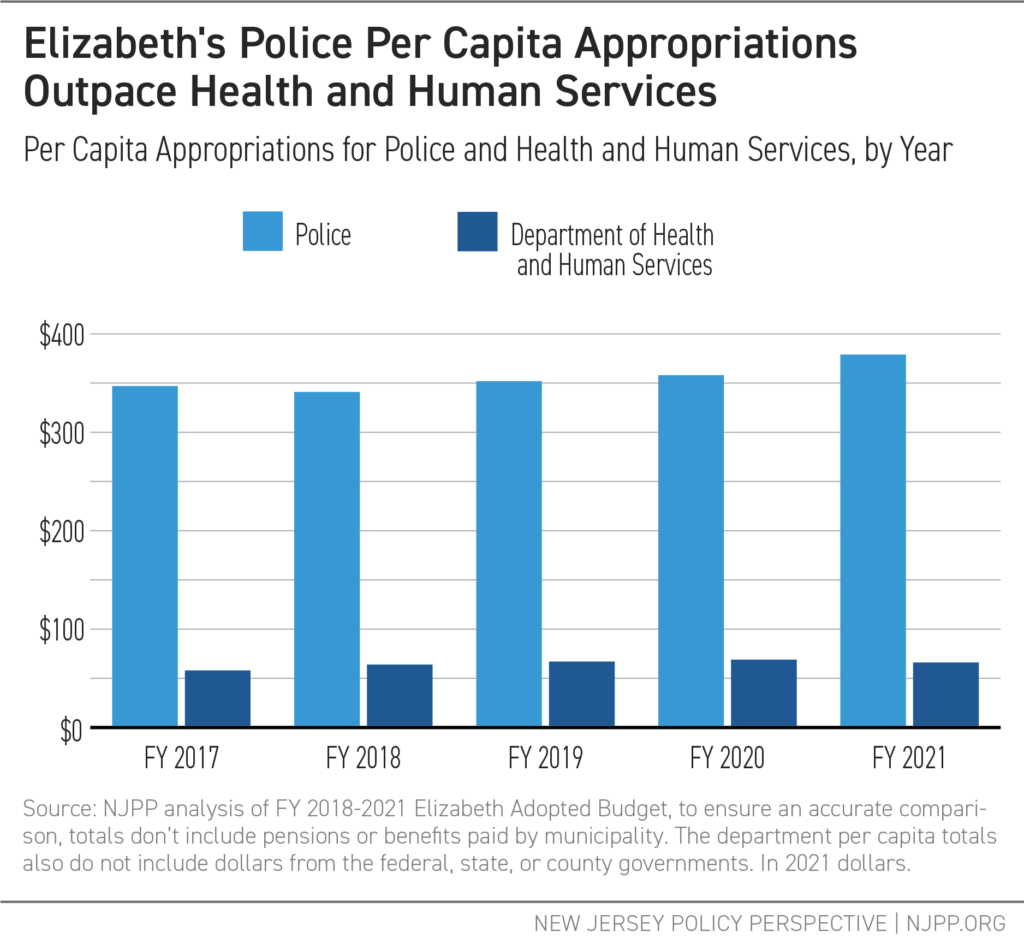
The budgetary analysis that follows shows both Gloucester County and Elizabeth spend more on policing than other vital municipal departments, such as health and human services. In Elizabeth, the police budget is over five times that of the Department of Health and Human Services. In Gloucester County, the combined county and municipal police budgets are more than two and a half times that of all the funding for health and human services departments in the county. Gloucester County allocates an average of 20 percent of their total municipal budgets to police, and Elizabeth allocates 19 percent. This is likely an underestimate, as it does not include pension payments, health benefits, and dollars that flow to police departments from other sources such as state and federal grant programs and other departments for police services.

Police Budgets 101

Police budgets in New Jersey vary from municipality to municipality, but they all have basic line-items. A New Jersey police budget typically includes funding for:

  • Salaries and wages, including a set amount for anticipated overtime compensation
  • Non-personnel costs including equipment maintenance, office supplies, travel, and training


The following are not included in police budgets, but account for significant expenses:

  • Overtime compensation funded through grant programs[lxviii]
  • Pension payments made by a municipality
  • Health benefits and insurance costs paid by a municipality
  • Most equipment upgrades or acquisitions, often found in capital improvements sections of municipal budgets
  • Compensated absences, like unused paid time off that can be cashed out upon departure from the department, paid from a special reserve fund
  • Additional funding and equipment to police departments from other sources, such as state and federal grant programs


City of Elizabeth

The City of Elizabeth is New Jersey’s fourth most populous municipality with more than 137,000 residents.[lxix] Roughly 20 percent of Elizabeth’s residents identify as Black, higher than the state’s 15 percent average.[lxx] The city also has almost double New Jersey’s poverty rate at nearly 18 percent, with a median household income of about $48,331 a year.[lxxi] As of 2021, the Elizabeth Police Department employs 365 law enforcement officers.[lxxii]

Police Appropriations

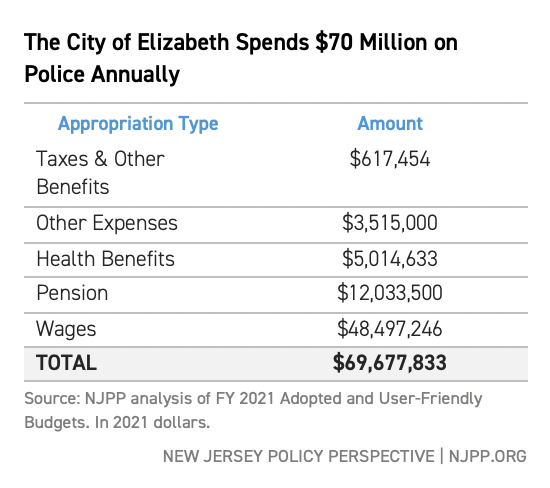
Elizabeth’s municipal police budget, which largely is allocated to base wages, is about $52 million, or about 19 percent of the city’s total budget, for Fiscal Year (FY) 2021.[lxxiii] The total budget includes $1.75 million for police overtime pay,[lxxiv] roughly $5,000 per officer.[lxxv] Over the last three years, Elizabeth’s police budget has increased by an average of 9.2 percent, or $1.8 million, each year.[lxxvi]

However, with pensions, health benefits, employment taxes, and other benefits included, Elizabeth’s police appropriations are about $69.7 million.[lxxvii] This is $507 per capita, and 25 percent of Elizabeth’s total budget.

The City of Elizabeth Spends $70 Million on Police Annually

In addition to pensions and health benefits, the municipality added additional funding for Elizabeth’s police department in FY 2021, such as:

  • Compensated Absences: The city added $1.0 million to a fund that pays for compensated absences, or sick days, for all qualified municipal employees.[lxxviii] The current liability, or what the municipality potentially owes, for police officers is $9.8 million.[lxxix] Moreover, if a police officer takes no sick days for an entire year, they get a bonus of $1,500 with an additional $1,000 the following year if they can keep it up.[lxxx] These bonuses may have to be taken from elsewhere in the budget or bonded if a large number of officers qualify at the same time.
  • Capital Improvements: Elizabeth also authorized $4.4 million in capital improvements amidst the global pandemic to upgrade the Elizabeth Police Department’s gym, showers, bathrooms, and conference room.[lxxxi] $200,000 of this will be taken from the capital improvement fund and the remaining $3.8 million will be taken on as debt. Capital improvement funding generally comes from a broader municipal fund to support large infrastructure projects that are expected to be paid for over multiple years. Examples include acquisition, construction, improvement and/or renovation of buildings, roads, utilities, or structures and acquisition or development of land.[lxxxii] Capital projects can also include acquisitions of major equipment, which is how many police departments receive funding for new technology.

Additional Revenue

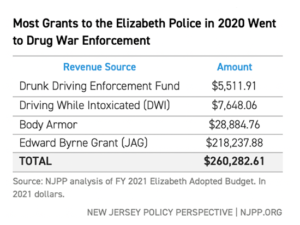
In addition to local revenue, New Jersey police departments receive funds from federal, state, and private grants. For example, Elizabeth received about $260,300 in state and federal grants for programs and resources in FY 2020, per the latest available data.[lxxxiii] The bulk of the grants — 84 percent — went to police enforcement of the drug war.

The Elizabeth Police Department received $218,200 from the Byrne Grant (also known as JAG) in FY 2020. JAG is a drug war-era federal program that provides grants for police resources to be used at the discretion of the police department. JAG is linked to increased arrest rates and racial disparities in policing, despite attempts to rectify such disparities.[lxxxiv] For every $100 increase in Byrne Grant funding since 1987, drug-related arrests increased by roughly 22 per 100,000 white residents and by 101 arrests per 100,000 Black residents.[lxxxv]

The remaining grant funds, roughly 19 percent, went to body armor purchases for police officers and Drunk Driving Enforcement, which consists of overtime pay for increased numbers of police in certain locations and incentives for ticket writing. Additionally, police departments are entitled to $95 of the $100 surcharge resulting from a drunk driving conviction in their community, per New Jersey State Statute 39:4-50.8.[lxxxvi]

Most Grants to the Elizabeth Police in 2020 Went to Drug War Enforcement

In addition to the funding listed above, the Elizabeth police department can also receive funding from Municipal Alliances, which are local organizations composed of various stakeholders, including teachers, school staff, social service agency representatives, government officials, and police. Funding is collected from fines and fees from drug offenses to be used to fund programs at the discretion of the Alliance.[lxxxvii] Union County’s Municipal Alliances, the county in which Elizabeth is located, typically uses some of these funds for programs run by police, such as Drug Abuse Resistance Education (D.A.R.E.), Law Enforcement Against Drugs (L.E.A.D.), and Cops in Schools, all of which provide dollars to police departments.[lxxxviii] In FY 2020, Elizabeth’s Municipal Alliance received about $57,000 dollars.[lxxxix]

Municipal Alliances are also responsible for the passage of over 1,000 local private property ordinances across the state that add new punishments related to drug and alcohol use, indirectly funneling money to police departments by increasing arrest rates and police activity.[xc] Moreover, programs like D.A.R.E. that promote abstinence have not curbed drug use.[xci]

Police Budget in Context

Elizabeth’s municipal police budget of $52 million, about $379 per capita, is 5.7 times greater than the city’s Department of Health and Human Services’ (DHS) $9.1 million budget.[xcii] The appropriations for the entire DHS equate to a mere $66 per capita.[xciii]

As of FY 2021, DHS employs 96 full-time and 44 part-time employees in numerous divisions and offices.[xciv] The city’s DHS provides various programs and services, including opportunities for rental assistance, help with prescription drug payments for struggling residents, and burial assistance for those who cannot afford funerals for their loved ones.[xcv] They also provide free health clinics, vaccines, and screenings for the under- or uninsured through the Public Health Nurses Division.[xcvi] Between FY 2020 and FY 2021, the police budget increased by $2.8 million (or 5.8 percent), while the funding for DHS decreased by $401,000 (or 4.2 percent).[xcvii] This is an increase of approximately $20 per capita for police.

Despite increased police funding, Elizabeth has not seen a significant increase in police performance or public safety. A standard measure of police performance is the clearance rate, which is the percentage of crimes that result in police locating and bringing charges against a likely suspect. In 2020, the latest available data states that the Elizabeth Police Department had a clearance rate of 13.2 percent,[xcviii] a rate that has remained stable since at least 2017, despite increases in funding.[xcix]

Gloucester County

Gloucester County is a predominately white, more-rural county that is home to roughly 300,000 people.[c] The county is comprised of 24 municipalities which vary tremendously in population size, density, demographic diversity, and income levels. These municipalities have a total of 19 local police departments, as well as a county-level sheriff’s office.[ci]

Police Appropriations

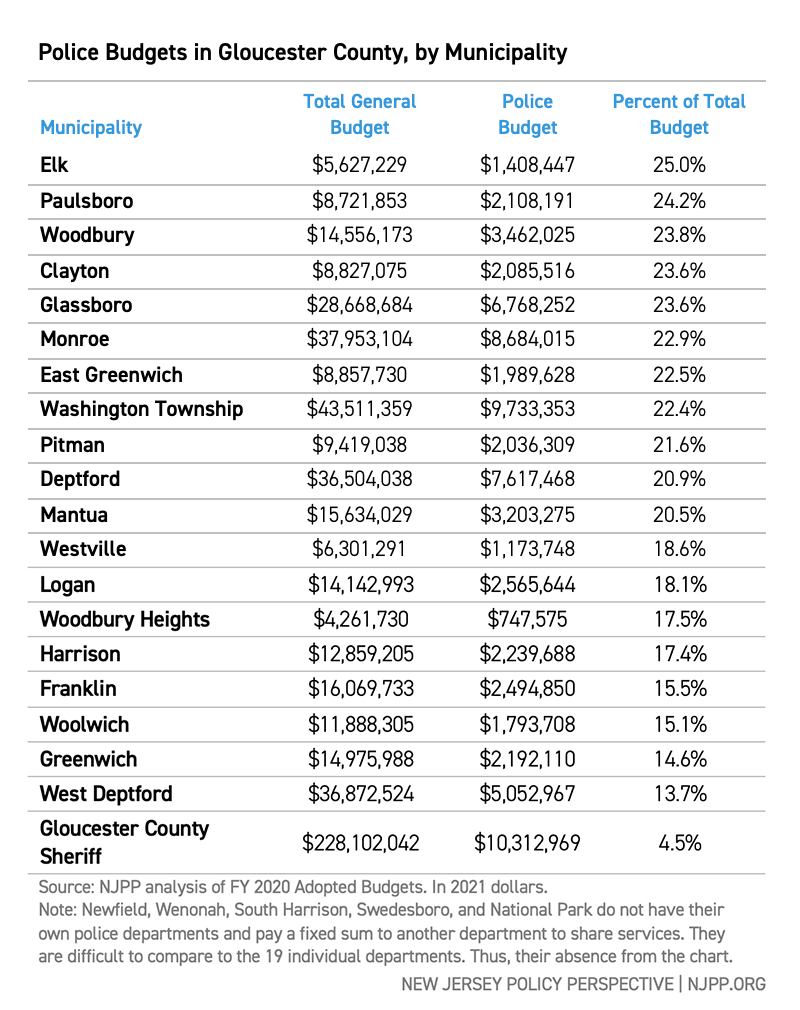
In FY 2020, the 19 local police departments and county-level sheriff’s office in Gloucester County received more than $77 million in funding, according to the most recent data available.[cii] This averages $257 per capita,[ciii] with the average municipal police budget at about 20 percent of its respective municipal budget, ranging from about 14 percent to 25 percent across municipalities. Please note that the police budget totals below do not include payments made for pensions and other benefits for police officers.

Police Budgets in Gloucester County, by Municipality

Additional Revenue

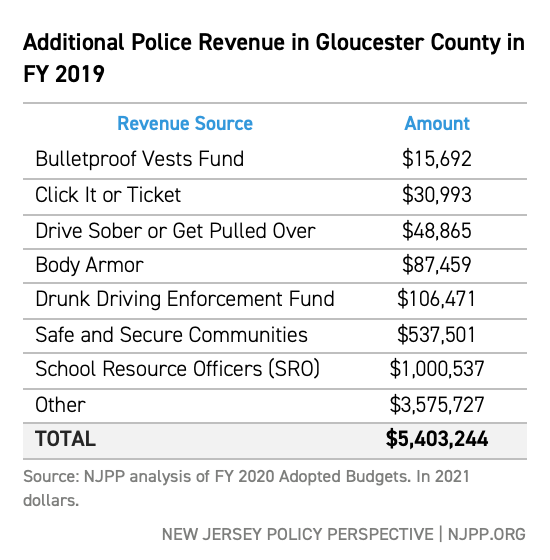
In addition to local revenue, law enforcement agencies in Gloucester County received revenue through a variety of grant programs in FY 2019. Notably, the “Click It or Ticket” (CIOT) and the “Drive Sober or Get Pulled Over” (DSOGPO) programs provide grant funding for an increased, “highly-visible” police presence.[cv] Specifically, the programs fund overtime enforcement to improve the “threat of a traffic ticket.”[cvi] In addition to the unavoidable time spent on court appearances or paperwork, overtime is used to make police more visible by putting additional officers in certain targeted areas, especially during holidays. Each campaign spans approximately two weeks per year, during which police track how many citations they were able to issue.

In FY 2019, Gloucester County’s police departments received over $79,000 and issued 4,163 citations in a total of just over four weeks through these programs.[cvii] All of the county’s police departments participated except Franklin.[cviii]

Programs like these engage in a strategy known as “proactive policing,” specifically “hot spots” policing,[cix] which involves preemptively sending officers to targeted areas to deter and reduce crime.[cx] However, the increased volume of police results in more ticketing and traffic stops, and a higher frequency of interactions between police and civilians in targeted locations, which are typically areas with higher rates of Black and brown people and poverty.[cxi] Increased police stops and ticketing also significantly increases the possibility of escalation. In 2020, nearly 11 percent of all U.S. police killings began with a routine traffic stop.[cxii]

Other sources of police funding in Gloucester County include:

  • School boards using education-dedicated dollars to pay for police presence at schools, School Resource Officers (SROs), which provided about $1 million to Gloucester County police departments in FY 2019
  • Grants from private companies or institutions: In FY 2020, Walmart gave Monroe’s police department and community affairs $6,073 in the form of a “Community Grant.”[cxiii]
  • State and federal programs that pay for or provide police resources: For example, in FY 2019, municipalities in Gloucester County received about $100,000 in state and federal grants for bulletproof vests and body armor alone.[cxiv]


The chart below shows the dollars Gloucester County received in FY 2019, the most recent comprehensive data, that were authorized to fund policing.[cxv] These funds, totaling over $5.4 million, are outside of the dedicated funds in the police budgets.[cxvi]

Additional Police Revenue in Gloucester County in FY 2019

Additionally, various Municipal Alliances in Gloucester County received a total of $247,428 in funding in FY 2019.

As noted in the analysis of Elizabeth’s budget, police departments also have access to new technology or equipment through capital improvement funding. Capital improvement funds are set aside to be used for parks, municipal buildings, and other community improvements. Typically, these projects take years to implement and, as such, are funded over a number of years. Some notable projects for police departments in Gloucester County include:

  • $70,860 for tasers, long guns, and new radar for police vehicles for Monroe, in FY 2020.[cxvii] $3,543 will be taken from the capital improvement fund while the remaining $67,317 is authorized to be taken on as debt.
  • $133,622 for police equipment for Mantua in FY 2020.”[cxviii] $6,681 will be taken from the capital improvement fund while the remaining $126,941 is authorized debt.
  • $956,996 for various police projects in Washington Township, including body cameras, ballistic shields, vehicles, and other expenses noted in the budget as “technology” in FY 2019.[cxix] $47,850 was taken from the capital improvement fund while the remaining $909,147 was authorized debt.


Police Budget in Context

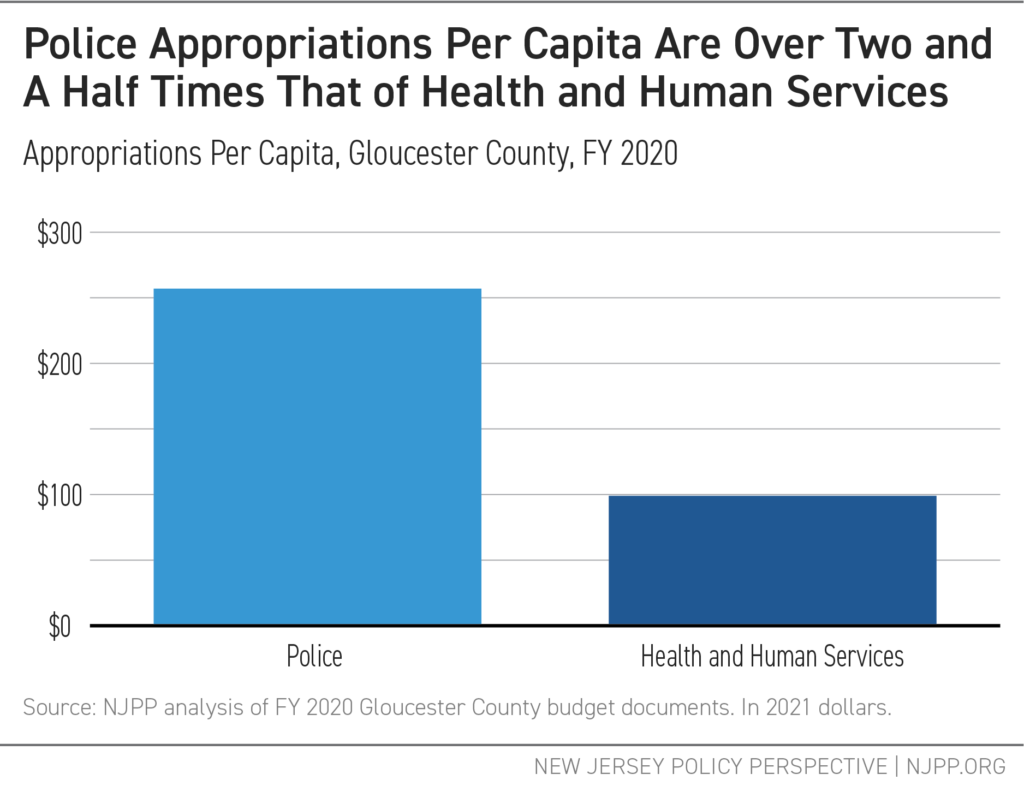
Gloucester County invests a high proportion of its budgets for policing, and the opportunity costs of this investment are significant. In FY 2020, total police appropriations were more than two and a half times that of total health and human services (HHS) budgets across the county, with police appropriations averaging about $257 per capita and HHS averaging $99 per capita.[cxx]

Police Appropriations Per Capita are over Tow and Half Times That of Health and Human Services

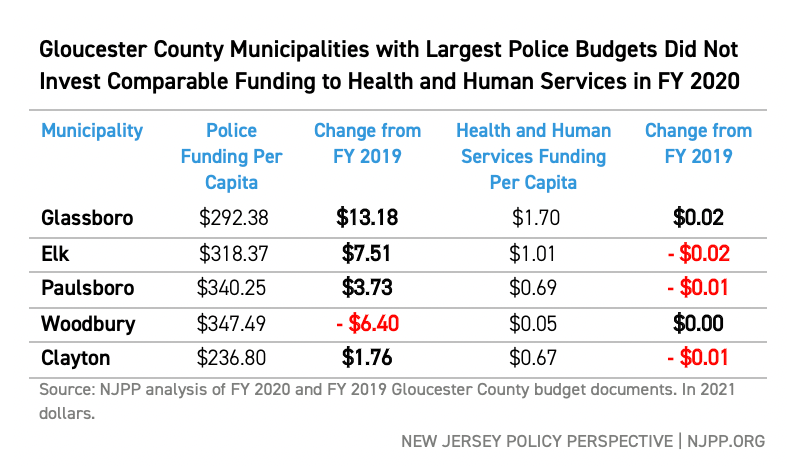
As the table below shows, Gloucester County municipalities with the largest share of their budgets going to police departments tend to increase funding for police while funding for health and human services remains stagnant or decreases.[cxxi]

Gloucester County Municipalities with Largest Police Budgets Did Not Invest Comparable Funding to Health and Human Services in FY 2020

Despite increased funding and resources, Gloucester County police departments reported a clearance rate of 25 percent on average in 2020,[cxxii] meaning that of the crimes reported, only 25 percent of them resulted in police locating and charging likely suspects. In 2017, the rate was just over 37 percent, since then it has remained stagnant with an average of 25 percent.[cxxiii]

A Way Forward: Policy Recommendations

The current system of public safety relies on a model of justice that disproportionately funds and prioritizes policing, rather than communities. This model continues to target Black residents through racial profiling, aggressive policing, and mass incarceration.[cxxiv] This also forces police officers to handle issues for which they often are not trained, such as in mental health, domestic violence, and substance use disorder.[cxxv]

This section offers two main strategies that must be taken together to provide safer and healthier communities.

Invest in Communities

Although local governments have historically used policing and incarceration as primary crime reduction strategies, methods to strengthen communities and address the structural roots of crime that have proved more effective do exist. One major way to promote safe and healthy communities and get to the root cause of crime is to invest in health and human services. Broader investments in communities will also be required. Some examples include investments in:

Health care
There is a strong correlation between health care access and involvement in the criminal justice system. Research from the City of Camden demonstrates a significant relationship between high use of hospital emergency departments and frequent arrests, suggesting that a holistic approach to health care may reduce arrest rates.[cxxvi] Moreover, broader access to health care, especially substance use disorder treatment, is consistently linked to crime reduction.[cxxvii] Across the U.S., increased health care access reduced violent crime by 5.8 percent and property crime by 3 percent, with an estimated savings of $13 billion to taxpayers due to crime reduction.[cxxviii]

Neighborhood restoration
With community support and input, investments in parks, green spaces, and the restoration of blighted or vacant land can have positive outcomes on public safety. Increasing access to green spaces is shown to reduce violent crime[cxxix] and improve health outcomes for residents.[cxxx] Restoring vacant lots is also shown to reduce violence in urban areas.[cxxxi] Maintenance of the physical environment in a community also strengthens the social environment, fostering a sense of connectedness that creates a willingness to intervene and social contracts that have been shown to prevent crime.[cxxxii]

Quality early childhood education
Early childhood education is shown to have positive outcomes for children and parents by providing stable child care and increasing access to other opportunities. Access to early childhood education correlates with increased academic achievement, stronger parent-child relationships, and a significant reduction in the likelihood of being charged with a crime.[cxxxiii]

Community centers and nonprofits
An increased number of local organizations actively working to reduce violence and strengthen communities have demonstrated positive outcomes, including crime reduction. For example, drawing on a panel of 264 cities spanning more than 20 years, every ten additional organizations focusing on crime and community life leads to a 9 percent reduction in the murder rate, a 6 percent reduction in the violent crime rate, and a 4 percent reduction in the property crime rate, a 2017 study found.[cxxxiv]

Community-based violence interruption programs
Informal and formal social networks are effective crime prevention tools. That’s because building strong community relationships and mutual trust among residents has been shown to reduce crime.[cxxxv] Community-based violence interruption programs incorporate this knowledge by having trusted neighbors and community members partnered with trained staff, and some programs have proven effective in preventing violence.[cxxxvi] The Newark Community Street Team (NCST) can serve as a model for this kind of program in New Jersey.[cxxxvii]

Invest In Alternative Response Teams

Police are first responders to situations for which they don’t have sufficient training, such as in areas of domestic violence, mental health, substance use disorders, and housing insecurity. These encounters between the police and people in crisis too often end in arrest, violence, or emergency room transport, and without needed referral to long-term support.

Thankfully, there are alternative models to support people in crisis that do not center policing.

Some of these models include teams of health care professionals and social workers that respond to calls for service instead of police. Other models include a social worker and a police officer responding in tandem.

These models are not new. Beginning at least 40 years ago, research has consistently shown the effectiveness of alternative response teams.[cxxxviii] For instance, a three-year study from 1974 looked at an alternative service model involving a team of police and social workers whose objective was crisis intervention, not arrest. There was a marked reduction in referrals to court and lowered recidivism rates.[cxxxix] It was also noted in these studies that there was a need for community services among the recipients of interventions, such as access to stable housing, employment service, and an emergency petty cash fund.[cxl]

Today, many localities are exploring alternative models based on successful models (see box below). Ithaca, New York is considering replacing the city’s entire 63-officer, $12.5 million-per-year department with a “Department of Community Solutions and Public Safety.”[cxli] This department would include armed “public safety workers” and unarmed “community solution workers,” all of whom will report to a civilian director instead of a police chief.[cxlii] Further, California is considering the C.R.I.S.E.S. Act, which would provide funding to community-based emergency response teams to serve as alternatives to police for a wide range of issues, including domestic disputes and mental health crises.[cxliii]

There is also evidence that police departments are open to alternative models so they can be more effective and increase community trust. In Minnesota, 69 percent of police chiefs surveyed across 40 different departments reported that collaboration with social workers or other mental health service providers would reduce avoidable casualties and build or increase police-community trust.[cxliv]

Examples of Successful Programs

Communities around the country have successfully implemented crisis response teams that serve as an alternative to and work in tandem with the police. These programs can serve as examples of how to reimagine public safety through person-centered responses.

CAHOOTS

The Crisis Assistance Helping Out on the Streets (CAHOOTS) program, serving Eugene, Oregon since 1989, provides an innovative community-based public safety system that deploys crisis response teams. Each team consists of a medical professional and a crisis worker with training in mental health interventions.[cxlv]

According to the most recent program evaluation, CAHOOTS diverted 5 to 8 percent of 911 calls from the Eugene Police Department between January 1, 2019 and December 31, 2019.[cxlvi] This means that up to 8 percent of the calls placed to dispatch that would normally involve police being sent to the scene result in no police or police resources arriving on the scene at all.[cxlvii] If calls for service directly to CAHOOTS are taken into account rather than just 911 calls, the diversion rate could be as high as 20 percent.[cxlviii]

The CAHOOTS program saved the City of Eugene an estimated average of $8.5 million in annual public safety spending between 2014 and 2017.[cxlix]

STAR

In 2020, Denver launched the Support Team Assisted Response (STAR) pilot program closely modeled on CAHOOTS, where specific kinds of 911 calls were approved for an alternative, non-police response. Calls that involved injuries, weapons, threats, or any other types of violence were excluded.

Data gathered during the pilot period revealed that the STAR program could reduce Denver police calls by almost 3 percent.[cl] Of the calls the STAR team responded to, 61 percent of individuals served were identified as having a mental health condition, and 41 percent of individuals served were transported to other support sites such as shelters or mental health crisis centers.[cli] These individuals were able to receive specialized care or transportation to needed service providers through STAR. Due to the positive response, the City of Denver plans to expand the STAR program in 2021.[clii]

Newark Community Street Team

The Newark Community Street Team (NCST) is a trauma-informed approach to public safety that centers health and prevention in Newark, New Jersey. The program began in 2015 with the support of Mayor Ras Baraka. NCST provides Safe Passage at schools, operates a Trauma Recovery Center, and has a robust victim services program, including a partnership with University Hospital’s Hospital-Based Violence Intervention Program. NCST also engages in High Risk Intervention (HRI) in Newark.[cliii] NCST is also currently leading efforts to create a harm reduction centered alternative emergency response to overdose in Newark, building off its community-based model of care and intervention.

The HRI team responds to reports of violence from the community or law enforcement.[cliv] HRI connects those involved to supportive counseling, crisis intervention assessment and mediation, and referrals to outside resources to restore peace and avoid arrest and incarceration.[clv] From 2016 to 2020, there have been record-low homicide rates in Newark.[clvi] This trend correlates with the existence of the NCST.[clvii] In 2018, Mayor Baraka credited NCST with not only the reduction of crime but also increased economic development.[clviii] The NCST offers a model for what decreased police intervention could look like in New Jersey.

Conclusion

New Jersey’s local governments, from counties to urban centers to small municipalities,  spend a large share of their budgets on policing in the name of public safety. However, evidence shows that many policing policies and outcomes harm civilians, especially Black residents.

New Jersey has the opportunity to be a leader in the fight for equity and justice. But to do so, the state must respond to and invest in the unique needs of historically marginalized communities by exploring alternative models to policing. These models, like police departments, may look a little different in every community. Elizabeth would likely need their own response team, while municipalities across Gloucester County could share services. Yet, whatever the model, the throughline remains a directive to invest in resources like mental health counseling, affordable housing, and employment opportunities, to build and restore communities and center harm reduction while developing real police accountability measures.


End Notes

[i] USA Today. (2020). Tracking protests across the USA in the wake of George Floyd’s death. https://www.usatoday.com/in-depth/graphics/2020/06/03/map-protests-wake-george-floyds-death/5310149002/

[ii] Geller, A., Fagan, J., Tyler, T., & Link, B. G. (2014). Aggressive policing and the mental health of young urban men. American Journal of Public Health, 104(12), 2321–2327. https://doi.org/10.2105/AJPH.2014.302046

[iii] American Public Health Association  (APHA). (2018). Addressing Law Enforcement Violence As A Public Health Issue. https://www.apha.org/policies-and-advocacy/public-health-policy-statements/policy-database/2019/01/29/law-enforcement-violence

[iv] American Public Health Association (APHA). (2020). Mass Incarceration Supplement. https://www.apha.org/news-and-media/news-releases/ajph-news-releases/2020/mass-incarceration-supplement

[v] Data obtained from Washington Post Segregation Database found: Williams & Emamdjomeh. (2018). America is more diverse than ever — but still segregated. Washington Post. https://www.washingtonpost.com/graphics/2018/national/segregation-us-cities/

[vi] All appropriations in this report have been adjusted to 2021 dollars.

[vii] Walker, S. (1980) Popular Justice: A History of American Criminal Justice. Pg. 20. New York, NY: Oxford University Press.

[viii] Hasset-Walker. (2021). How Your Start is How You Finish? The Slave Patrol and Jim Crow Origins of Policing. Human Rights Magazine, The American Bar Association. https://www.americanbar.org/groups/crsj/publications/human_rights_magazine_home/civil-rights-reimagining-policing/how-you-start-is-how-you-finish/

[ix] Potter. (2003). The History of Policing in the United States. EKU School of Justice Studies. Pg. 3. https://plsonline.eku.edu/sites/plsonline.eku.edu/files/the-history-of-policing-in-us.pdf

[x] Hansen. (2019). Slave Patrols: An Early Form of American Policing. National Law Enforcement Museum. https://nleomf.org/slave-patrols-an-early-form-of-american-policing/ /

[xi] Lepore. (2020). The Invention of Police. The New Yorker.  https://www.newyorker.com/magazine/2020/07/20/the-invention-of-the-police

[xii] Ibid.

[xiii] Hasset-Walker. (2021). How Your Start is How You Finish? The Slave Patrol and Jim Crow Origins of Policing. Human Rights Magazine, The American Bar Association. https://www.americanbar.org/groups/crsj/publications/human_rights_magazine_home/civil-rights-reimagining-policing/how-you-start-is-how-you-finish/

[xiv] Walker, S. (1980) Popular Justice: A History of American Criminal Justice. Pg. 20. New York, NY: Oxford University Press.

[xv] Luxenberg, S. (2019) The Jim Crow Car: The North, the South and the forgotten origins of racial separation. The Washington Post. https://www.washingtonpost.com/news/magazine/wp/2019/02/20/feature/the-forgotten-northern-pre-civil-war-origins-of-jim-crow/. There is also a book on this subject: https://wwnorton.com/books/separate/

[xvi] Potter. (2003). The History of Policing in the United States. EKU School of Justice Studies. Pg. 3. https://plsonline.eku.edu/sites/plsonline.eku.edu/files/the-history-of-policing-in-us.pdf

[xvii] Ibid. Pg. 3-5

[xviii] Robinson, M. (2017). From the Slave Codes to Mike Brown: the brutal history of African Americans and law enforcement. USAPP– American Politics and Policy. Pg. 1-2. http://eprints.lse.ac.uk/85472/1/usappblog-2017-10-05-from-the-slave-codes-to-mike-brown-the-brutal.pdf

[xix] Goldberg, D. (2016) The Retreats of Reconstruction: Race, Leisure, and the Politics of Segregation at the New Jersey Shore. Fordham University Press.

[xx] Rojas & Atkinson. (2017). Five Days of Unrest that Shaped and Haunted Newark. New York Times. https://www.nytimes.com/2017/07/11/nyregion/newark-riots-50-years.html

[xxi] Ibid.

[xxii] Ibid.

[xxiii] Alexander. (2010). The New Jim Crow: Mass Incarceration in the Age of Colorblindness. The New Press.

[xxiv] Nixon. (1971). Special Message to the Congress on Drug Abuse Prevention and Control. Online by Gerhard Peters and John T. Woolley, The American Presidency Project. https://www.presidency.ucsb.edu/documents/special-message-the-congress-drug-abuse-prevention-and-control

[xxv] Cooper. (2015). War on Drugs Policing and Police Brutality. Substance use & misuse, 50(8-9), 1188–1194. https://www.ncbi.nlm.nih.gov/pmc/articles/PMC4800748/#R27

[xxvi] Lynch, M. (2012). Theorizing the role of the “war on drugs” in US punishment. Theoretical Criminology. Pg. 16. https://socialecology.uci.edu/sites/socialecology.uci.edu/files/users/lynchm/tc_war_on_drugs_final.pdf ; Urban Institute. (2020). Criminal Justice Expenditures: Police, Corrections, and Courts. https://www.urban.org/policy-centers/cross-center-initiatives/state-and-local-finance-initiative/state-and-local-backgrounders/criminal-justice-police-corrections-courts-expenditures#Question3Police

[xxvii] Cooper. (2015). War on Drugs Policing and Police Brutality. Substance use & misuse, 50(8-9), 1188–1194. https://www.ncbi.nlm.nih.gov/pmc/articles/PMC4800748/#R27

[xxviii] National Research Council. (2014). The Growth of Incarceration in the United States: Exploring Causes and Consequences. Washington, DC: The National Academies Press. doi: 10.17226/18613. Pg. 34-36. https://www.nap.edu/read/18613/chapter/4#34

[xxix] Ibid. Pg. 46-47.

[xxx] Wagner & Bertram. (2020) “What percent of the U.S. is incarcerated?” (And other ways to measure mass incarceration). Prison Policy Initiative. https://www.prisonpolicy.org/blog/2020/01/16/percent-incarcerated/

[xxxi] National Research Council. (2014). The Growth of Incarceration in the United States: Exploring Causes and Consequences. Washington, DC: The National Academies Press. doi: 10.17226/18613. Pg. 34-36. https://www.nap.edu/read/18613/chapter/4#34

[xxxii] National Research Council. (2014). The Growth of Incarceration in the United States: Exploring Causes and Consequences. Washington, DC: The National Academies Press. doi: 10.17226/18613. Pg. 58. https://www.nap.edu/read/18613/chapter/4#34

[xxxiii] Ibid.

[xxxiv] Borden, T. (2016)  Every 25 Seconds: The Human Toll of Criminalizing Drug Use in the United States. Human Rights Watch. Pg. 4. https://www.hrw.org/report/2016/10/12/every-25-seconds/human-toll-criminalizing-drug-use-united-states

[xxxv] U.S. Census Bureau. (2019). https://www.census.gov/quickfacts/fact/table/US/RHI225219

[xxxvi] Federal Bureau of Prisons. (2021) Inmate Statistics. https://www.bop.gov/about/statistics/statistics_inmate_race.jsp

[xxxvii] Baum. (2016). Legalize It All. Harper’s Magazine. https://harpers.org/archive/2016/04/legalize-it-all/

[xxxviii] Walmsley, R. (2018) World Prison Population List: Twelfth Edition. Institute for Criminal Policy Research. Pg. 6. https://www.prisonstudies.org/sites/default/files/resources/downloads/wppl_12.pdf. Note that some countries may not report complete prison/detention lists.

[xxxix] FBI: UCR Crime in the United States 2019 data table. https://ucr.fbi.gov/crime-in-the-u.s/2019/crime-in-the-u.s.-2019/tables/table-29

[xl] NJPP calculation using FBI UCR data for all non-traffic arrests and arrests for “Drug Abuse Violations — Grand Total” reported by participating New Jersey law enforcement agencies, 1986 and 2019. Available at https://crime-data-explorer.app.cloud.gov/pages/home.

[xli] Mellor. (2021). A War on Us: How Much New Jersey Spends Enforcing the War on Drugs. New Jersey Policy Perspective. https://www.njpp.org/publications/report/a-war-on-us-how-much-new-jersey-spends-enforcing-the-war-on-drugs/ ; NJPP calculation using FBI UCR data for all non-traffic arrests and arrests for “Drug Abuse Violations — Grand Total” reported by participating New Jersey law enforcement agencies, 1986 and 2019. Available at https://crime-data-explorer.app.cloud.gov/pages/home.

[xlii] NJPP calculation using FBI UCR data for all non-traffic arrests and arrests for “Drug Abuse Violations — Grand Total” reported by participating New Jersey law enforcement agencies, 1986 and 2019. Available at https://crime-data-explorer.app.cloud.gov/pages/home.

[xliii] Substance Abuse and Mental Health Services Administration. (2018). National Survey on Drug Use and Health. https://www.samhsa.gov/data/sites/default/files/cbhsq-reports/NSDUHDetailedTabs2018R2/NSDUHDetailedTabs2018.pdf

[xliv] State of New Jersey Department of Corrections. (2021) Offender Statistics. p.36. https://www.state.nj.us/corrections/pdf/offender_statistics/2021/Entire%20Offender%20Characteristics%202021.pdf

[xlv] Data for New Jerseyans that identify as “Black or African American alone or in combination,” (2020). Census Bureau.  https://www.census.gov/library/visualizations/interactive/race-and-ethnicity-in-the-united-state-2010-and-2020-census.html Note that Census data for Black or African American alone or in combination includes Black/African American residents identifying as Hispanic, whereas the corrections data splits Hispanic out as a separate category.

[xlvi] Ibid. This includes white New Jerseyans that identify as more than one race or ethnicity.

[xlvii] Mellor. (2021). A War on Us: How Much New Jersey Spends Enforcing the War on Drugs. New Jersey Policy Perspective. Pg. 4. https://www.njpp.org/publications/report/a-war-on-us-how-much-new-jersey-spends-enforcing-the-war-on-drugs/ ;

Movement for Black Lives. “End the War on Drugs.” Policy Platform. https://m4bl.org/policy-platforms/end-the-war-on-drugs/

[xlviii] Office of the Attorney General. (2020). Use of Force Policy. The State of New Jersey. Pg. 6. https://www.nj.gov/oag/force/docs/UOF-2020-1221-Use-of-Force-Policy.pdf

[xlix] National Institute of Justice. Overview of Police Use of Force. (2020). https://nij.ojp.gov/topics/articles/overview-police-use-force

[l] University of Chicago Law School – Global Human Rights Clinic. (2020). Deadly Discretion: The Failure of Police Use of Force Policies to Meet Fundamental International Human Rights Law and Standards. Global Human Rights Clinic. Pg. 2 https://chicagounbound.uchicago.edu/cgi/viewcontent.cgi?article=1014&context=ihrc ;

US Commission on Civil Rights (2018). Police Use of Force: An Examination of Modern Policing Practices. Pg. 15. https://www.usccr.gov/files/pubs/2018/11-15-Police-Force.pdf

[li] American Public Health Association  (APHA). (2018). Addressing Law Enforcement Violence As A Public Health Issue. https://www.apha.org/policies-and-advocacy/public-health-policy-statements/policy-database/2019/01/29/law-enforcement-violence

[lii] NJPP analysis of AG’s Use of Force Database.

[liii] Ibid.

[liv] The Washington Post. Fatal Force Database (2021). https://www.washingtonpost.com/graphics/investigations/police-shootings-database/?nid

[lv] The Washington Post. Fatal Force Database (2021). https://www.washingtonpost.com/graphics/investigations/police-shootings-database/?nid

[lvi] NJPP analysis of The Washington Post. Fatal Force Database (2021). https://www.washingtonpost.com/graphics/investigations/police-shootings-database/?nid  & Mapping Police Violence Database (2021). https://mappingpoliceviolence.org/

[lvii] Ibid.

[lviii] Data from Mapping Police Violence: https://public.tableau.com/profile/ssinyangwe#!/vizhome/PoliceViolenceperPD/PoliceKillingsbyState

[lix] Gur, O. (2010). Persons with mental illness in the criminal justice system: Police interventions to prevent violence and criminalization. Journal of Police Crisis Negotiations. Pg. 3. 17-18. https://doi.org/10.1080/15332581003799752

[lx] The Institute for Criminal Justice Training Reform. (2021).

https://www.trainingreform.org/state-police-training-requirements

[lxi] Graph from an analysis of The Washington Post. Fatal Force Database (2021). https://www.washingtonpost.com/graphics/investigations/police-shootings-database/?nid & Mapping Police Violence Database (2021). https://mappingpoliceviolence.org/ – data is between 1/2015 and 4/2021. Note that there may be variation across the reporting of domestic disputes that could classify some involving assault as nonviolent.

[lxii] Fuller, Lamb, Biasatti, & Snook. (2015). Overlooked in the Undercounted: The Role Of Mental Illness In Fatal Law Enforcement Encounters. Pg. 1. Treatment Advocacy Center. https://www.treatmentadvocacycenter.org/storage/documents/overlooked-in-the-undercounted.pdf

[lxiii] ACLU of New Jersey. (2013). The Crisis Continues Inside Internal Affairs. https://www.aclu-nj.org/files/3413/6059/3876/ACLU_NJ_Internal_Affairs.pdf ;

Reilly. (2015). Here’s What Happens When You Complain to Cops About Cops. Huffpost. https://www.huffpost.com/entry/internal-affairs-police-misconduct_n_5613ea2fe4b022a4ce5f87ce

[lxiv] NJPP analysis of The Washington Post. Fatal Force Database (2021). https://www.washingtonpost.com/graphics/investigations/police-shootings-database/?nid & Mapping Police Violence Database (2021). https://mappingpoliceviolence.org/ – data is between 1/2015 and 4/2021.

[lxv] Ibid.

[lxvi] Sullivan & Everett. (May 2019). Residents say this troubled N.J. police department ignores excessive force complaints. Records reveal it hasnʼt upheld a case in years. NJ.com. https://www.nj.com/politics/2019/05/residents-say-this-troubled-nj-police-department-ignores-excessive-force-complaints-records-show-it-hasnt-upheld-a-case-in-years.html

[lxvii] Ibid.

[lxviii] Police get additional overtime compensation from private citizens and companies for a variety of reasons, including monitoring the street during construction projects or during special events. These dollars would not be accounted for in the municipal budget.

[lxix] New Jersey Demographics, data linked to US Census. https://www.newjersey-demographics.com/cities_by_population

[lxx] U.S. Census Bureau. (2021). New Jersey. https://www.census.gov/quickfacts/fact/table/elizabethcitynewjersey,NJ/PST045219

[lxxi] Ibid. All dollars taken from the census data are 2021 dollars and have been adjusted from 2019 dollars.

[lxxii] Elizabeth Municipal Ordinance. 2.56.110 – Police Department Administration and Personnel. (2021). https://library.municode.com/nj/elizabeth/codes/code_of_ordinances?nodeId=TIT2ADPE_CH2.56PODE_ARTIIADPE_2.56.110ADPE

[lxxiii] NJPP analysis of FY2021 Adopted Budget

[lxxiv] NJPP analysis of Elizabeth’s FY 2021 User Friendly Budget personnel costs

[lxxv] Ibid. This calculation is based on the number of officers employed at the time, which was

[lxxvi] NJPP analysis of FY2018 – FY2021 Adopted Budgets. All dollars used in analysis are in 2021 dollars.

[lxxvii] NJPP analysis of total police personnel costs in Elizabeth’s FY2021 User Friendly Budget

[lxxviii] NJPP analysis of FY 2021 User Friendly Budget.

[lxxix] Ibid.

[lxxx] Contract Between City of Elizabeth and PBA4. Pg. 23. https://assets.documentcloud.org/documents/20472639/elizabeth-and-pba-loc-4-2018.pdf

[lxxxi] NJPP analysis of FY 2021 Adopted Budget – capital improvements

[lxxxii] Local Finance Board – Capital Budgets And Capital Improvement Programs. https://www.nj.gov/dca/divisions/dlgs/resources/rules_docs/5_30/njac_5304.pdf

[lxxxiii] NJPP analysis of FY 2021 Adopted Budget. In 2021 dollars. Note that these grants are not listed as “anticipated” for FY 2021.

[lxxxiv] Cox & Cunningham. (August 2017). Financing the War on Drugs: The Impact of Law Enforcement Grants on Racial Disparities in Drug Arrests. Pg. 26-27. http://dx.doi.org/10.2139/ssrn.3035640

[lxxxv] Ibid.

[lxxxvi] NJ Department of Law and Public Safety. (2021). Drunk Driving Enforcement Fund. https://www.nj.gov/oag/hts/grants/index.html

[lxxxvii] Governor’s Council on Alcoholism and Drug Abuse. https://gcada.nj.gov/alliance/

[lxxxviii] Union County, New Jersey. Municipal Alliance Programs. https://ucnj.org/departments/human-services/alliance-to-prevent-alcoholism-and-drug-abuse/municipal-alliances/municipal-alliance-programs/

[lxxxix] NJPP analysis of FY 2021 Elizabeth Adopted Budget.

[xc] Mellor. (2021). A War on Us: How Much New Jersey Spends Enforcing the War on Drugs. New Jersey Policy Perspective. https://www.njpp.org/publications/report/a-war-on-us-how-much-new-jersey-spends-enforcing-the-war-on-drugs/

[xci] West, S. L., & O’Neal, K. K. (2004). Project D.A.R.E. outcome effectiveness revisited. American Journal Of Public Health. https://doi.org/10.2105/ajph.94.6.1027

[xcii] NJPP analysis of FY 2021 Adopted Budget, In order to make an apples-to-apples comparison, this section compares the municipal police budget itself, without additional police revenue.

[xciii] This does not include federal or state dollars for programs like TANF or SSI. This comparison is salaries and wages and day-to-day operating expenses of the departments.

[xciv] NJPP analysis of FY 2021 Adopted Budget. Pg. 129. https://www.elizabethnj.org/ArchiveCenter/ViewFile/Item/75

[xcv] Department of Health and Human Services. City of Elizabeth. https://www.elizabethnj.org/323/Human-Services

[xcvi] Public Health Nursing. City of Elizabeth. https://www.elizabethnj.org/328/Public-Health-Nursing

[xcvii] NJPP analysis of FY 2021 Adopted Budget for Elizabeth

[xcviii] 2020 Uniform Crime Report. https://www.njsp.org/ucr/uniform-crime-reports.shtml

[xcix] NJPP analysis of 2017-2020 Uniform Crime Reports. Note clearance rates do not track important information like if the person who was arrested was the person who committed the crime, drug and other nonviolent crime, and many police initiated encounters.

[c] U.S. Census Bureau. (2019) Gloucester County, New Jersey. https://www.census.gov/quickfacts/fact/table/gloucestercountynewjersey,US/RHI225219

[ci] NJPP analysis of municipal documents. This does not include the Prosecutor’s Office, Department of Corrections, or Rowan University’s police department in Glassboro.

[cii] NJPP analysis of FY 2020 municipal budgets. This number does not include the budgets for the Department of Corrections or the County Prosecutor’s Office.

[ciii] This is an underestimate given that the dollars for shared service agreements are not included.

[civ] Newfield, Wenonah, South Harrison, Swedesboro, and National Park do not have their own police departments and pay a fixed sum to another department to share services. They are difficult to compare to the 19 individual departments. Thus, their absence from the chart.

[cv] New Jersey Department of Public Safety, Division of Traffic Safety. (2019). Drive Sober or Get Pulled Over. https://www.nj.gov/oag/hts/youlose.html

[cvi] New Jersey Department of Public Safety, Division of Traffic Safety. (2019). Click It Or Ticket. https://www.state.nj.us/oag/hts/clickitorticket.html

[cvii] “Click it or Ticket,” p. 12: https://www.state.nj.us/oag/hts/downloads/CIOT_2019_Final_Report.pdf; “Drive Sober or Get Pulled Over,” p. 11: https://www.nj.gov/oag/hts/downloads/2019_DSOGPO_Report-WEB.pdf

[cviii] Ibid.

[cix] National, A. O. S. E. A., Division, O. B. A. S. S., Committee, O. L. A. J., & Committee, O. P. P. E. O. (2018). Proactive policing : Effects on crime and communities. Pages 1-3. ProQuest Ebook Central

[cx] Ibid.

[cxi] American Public Health Association  (APHA). (2018). Addressing Law Enforcement Violence As A Public Health Issue. https://www.apha.org/policies-and-advocacy/public-health-policy-statements/policy-database/2019/01/29/law-enforcement-violence

[cxii] Mapping Police Violence Database (2021). https://public.tableau.com/app/profile/ssinyangwe/viz/PoliceViolenceperPD/KillingsbyEncounterType

[cxiii] NJPP analysis of municipal budget. More information for Walmart’s community grant program: https://walmart.org/how-we-give/local-community-grants. In 2021 dollars.

[cxiv] NJPP analysis of Gloucester County municipal budgets. In 2021 dollars.

[cxv] Dollars from the MAADA grants are eligible to be used in other ways aside from policing and not all these dollars go to police departments, but there is no explicit breakdown in the municipal budgets to illustrate what share of these dollars go to programs outside of police departments.

[cxvi] This includes dollars given to police departments from municipalities that do not have their own police department as a contribution for the shared service.

[cxvii] NJPP analysis of FY2020 Adopted Budget for Monroe, Gloucester County. In 2021 dollars. Total estimated costs are over $200,000, but the remainder is to be funded in future years.

[cxviii] NJPP analysis of FY2020 Adopted Budget for Mantua, Gloucester County. In 2021 dollars. Total estimated costs are over $640,000, but the remainder is to be funded in future years.

[cxix] NJPP analysis of FY2019 Adopted Budget for Washington Township, Gloucester County. In 2021 dollars.

[cxx] NJPP analysis of various FY2020 municipal and county budget documents for Gloucester County.

[cxxi] NJPP Analysis of FY 2019 and FY 2020 Adopted Budgets. All adjusted for 2021 dollars.

[cxxii] 2020 Uniform Crime Report. https://www.njsp.org/ucr/uniform-crime-reports.shtml

[cxxiii] NJPP analysis of 2017-2020 Uniform Crime Reports. Note clearance rates do not track important information like if the person who was arrested was the person who committed the crime, drug and other nonviolent crime, and many police initiated encounters.

[cxxiv] Sawyer, W. (2020). Ten key facts about policing: Highlights from our work. Prison Policy Initiative. https://www.prisonpolicy.org/blog/2020/06/05/policingfacts/

[cxxv] Stemen. (2017). The Prison Paradox: More Incarceration Will Not Make Us Safer. The Vera Institute. https://storage.googleapis.com/vera-web-assets/downloads/Publications/for-the-record-prison-paradox-incarceration-not-safer/legacy_downloads/for-the-record-prison-paradox_02.pdf

[cxxvi] Milgram, A., et al. (2018). Integrated Health Care and Criminal Justice Data — Viewing the Intersection of Public Safety, Public Health, and Public Policy Through a New Lens: Lessons from Camden, New Jersey. Harvard Kennedy School. https://www.hks.harvard.edu/sites/default/files/centers/wiener/programs/pcj/files/integrated_healthcare_criminaljustice_data.pdf

[cxxvii] Wen, H. (2017). The effect of Medicaid expansion on crime reduction: Evidence from HIFA-waiver expansions. Journal of Public Economics, 154, 67–94. https://doi.org/10.1016/j.jpubeco.2017.09.001;

Volger, J. (2017) Access to Health Care and Criminal Behavior: Short-Run Evidence from the ACA Medicaid Expansions. SSRN. https://onlinelibrary.wiley.com/doi/abs/10.1002/pam.22239

[cxxviii] Volger, J. (2017) Access to Health Care and Criminal Behavior: Short-Run Evidence from the ACA Medicaid Expansions. SSRN. https://papers.ssrn.com/sol3/papers.cfm?abstract_id=3042267

[cxxix] Shepley, M., et al. (2019). The Impact of Green Space on Violent Crime in Urban Environments: An Evidence Synthesis. International Journal of Environmental Research and Public Health. https://doi.org/10.3390/ijerph16245119; Hoffman, A. (2020). Community service activities reducing hate crimes and extremism: A “green intervention” approach. Journal of Prevention & Intervention in the Community, 48(3), 207–209. https://doi.org/10.1080/10852352.2019.1625606

[cxxx] Kondo, M., Fluehr, J., McKeon, T., & Branas, C. (2018). Urban Green Space and Its Impact on Human Health. International Journal of Environmental Research and Public Health, 15(3), 445–. https://doi.org/10.3390/ijerph15030445

[cxxxi] Moyer, R., MacDonald, J., Ridgeway, G., & Branas, C. (2019). Effect of Remediating Blighted Vacant Land on Shootings: A Citywide Cluster Randomized Trial. American Journal of Public Health (1971), 109(1), 140–144. https://doi.org/10.2105/AJPH.2018.304752

[cxxxii] David-Ferdon, C. et al. (2016). A comprehensive technical package for the prevention of youth violence and associated risk behaviors. CDC. Pg. 31. https://www.cdc.gov/violenceprevention/pdf/yv-technicalpackage.pdf

[cxxxiii] Giovanelli, A., Hayakawa, M., Englund, M., Reynolds, A. (2018). African-American Males in Chicago: Pathways From Early Childhood Intervention to Reduced Violence, Journal of Adolescent Health, Pg. 80-86,

https://doi.org/10.1016/j.jadohealth.2017.08.012 ;

National Bureau of Economic Research. (2001). Favorable Long Term Effects of Head Start. NBER.  https://www.nber.org/digest/aug01/favorable-long-term-effects-head-start

[cxxxiv] Sharkey, P., Torrats-Espinosa, G., & Takyar, D. (2017). Community and the Crime Decline: The Causal Effect of Local Nonprofits on Violent Crime. American Sociological Review, 82(6), 1214–1240. https://doi.org/10.1177/0003122417736289

[cxxxv] Weisburd, D., White, C., Wire, S., & Wilson, D. (2021). Enhancing Informal Social Controls to Reduce Crime: Evidence from a Study of Crime Hot Spots. Prevention Science, 22(4), 509–522. https://doi.org/10.1007/s11121-020-01194-4

[cxxxvi] David-Ferdon, C. et al. (2016). A comprehensive technical package for the prevention of youth violence and associated risk behaviors. CDC. Pg. 33. https://www.cdc.gov/violenceprevention/pdf/yv-technicalpackage.pdf

[cxxxvii] To learn more about NCST see the box contained examples of successful programs and visit them at https://www.newarkcommunitystreetteam.org/

[cxxxviii] Watson, A., et al. (2019). Crisis Response Services for People with Mental Illnesses or Intellectual and Developmental Disabilities: A Review of the Literature on Police-based and Other First Response Models. Vera Institute. https://www.vera.org/downloads/publications/crisis-response-services-for-people-with-mental-illnesses-or-intellectual-and-developmental-disabilities.pdf ;

Batko, S., et al. (2020) Alternatives to Arrests and Police Responses to Homelessness: Evidence-Based Models and Promising Practices. Urban Institute. Pg. 22-25. https://www.urban.org/sites/default/files/publication/103158/alternatives-to-arrests-and-police-responses-to-homelessness.pdf

[cxxxix] Treger, T. (1974). A Police-Social Work Team Model: Some Preliminary Findings and Implications for System Change. Crime and Delinquency. https://doi.org/10.1177/001112877402000308

[cxl] Ibid.

[cxli] Lowery, W. (2021). The Most Ambitious Effort Yet to Reform Policing May Be Happening In Ithaca, New York. GQ. https://www.gq.com/story/ithaca-mayor-svante-myrick-police-reform

[cxlii] Ibid.

[cxliii] French, P. (2021). California Bill That Promotes Alternatives To Policing Is Back Despite Governor’s Veto. The Appeal. https://theappeal.org/politicalreport/california-crises-act-2021/

[cxliv] Lamin, T. (2016). Police social work and community policing. Cogent Social Sciences, 2(1). https://doi.org/10.1080/23311886.2016.1212636

[cxlv] White Bird Clinic. (2020) CAHOOTS. https://whitebirdclinic.org/category/programs/cahoots/

[cxlvi] CAHOOTS Program Analysis. (2019). Pg. 8. https://www.eugene-or.gov/DocumentCenter/View/56717/CAHOOTS-Program-Analysis

[cxlvii] Ibid.

[cxlviii] Ibid.

[cxlix] White Bird Clinic. (2020) CAHOOTS. https://whitebirdclinic.org/what-is-cahoots/

[cl] STAR Program Evaluation. (2020). https://wp-denverite.s3.amazonaws.com/wp-content/uploads/sites/4/2021/02/STAR_Pilot_6_Month_Evaluation_FINAL-REPORT.pdf

[cli] Ibid.

[clii] McRae, J. (2021). STAR Program In Denver Expands To Respond To Calls Seven Days A Week. CBS Denver.  https://denver.cbslocal.com/2021/08/31/star-program-mental-health-denver-police/

[cliii] Newark Community Street Team. (2021). What We Do. https://www.newarkcommunitystreetteam.org/what-we-do/ Note that homicide rates increased in 2021.

[cliv] Ibid.

[clv] Ibid.

[clvi] Newark Community Street Team Narrative Evaluation. (2020). Pg. 58 – 60.  https://www.newarkcommunitystreetteam.org/wp-content/uploads/2021/02/NCST-Evaluation_FINAL.pdf

[clvii] Ibid.

[clviii] Ibid.

Pandemic Relief Reduced Poverty in 2020

Despite New Jersey’s reputation as a high-wealth state, poverty remains pervasive, with roughly 1 in 10 New Jersey residents living in poverty. New Census data show that 871,000 New Jersey residents were living in poverty between 2018 and 2020 based on the Supplemental Poverty Measure, a more comprehensive Census measure of poverty.

Nationally, New Jersey ranks 25th in the percentage of its population living in poverty. Considering New Jersey residents’ median income is routinely among the top in the nation, its poverty rate shows how inequality remains a large problem in the state.

Bold Public Investments Help Reduce Poverty

Although the poverty figures are three-year estimates, the new data show how the COVID-19 pandemic led to a striking decline in household incomes nationally. With historic job losses and unemployment, many people struggled to make ends meet. However, effective government stimulus programs helped mitigate this economic cost and keep families out of poverty. These programs included: expanded unemployment insurance, direct aid checks, refundable tax credits, suspensions of evictions, and forbearance of mortgage and student loan payments.

Federal stimulus checks alone kept nearly 12 million Americans out of poverty, with millions more helped by expanded unemployment and refundable tax credits (see figure below).

Unfortunately, many of these poverty-reducing programs are ending soon or have already ended, despite continued economic turmoil for New Jersey’s low-income residents. As NJPP’s recent employment report details, the economic hardship caused by the pandemic still weighs heavily on low-wage workers and the unemployed, who are disproportionately Black and Hispanic/Latinx.

And it was precisely these populations for whom the anti-poverty effects of COVID-19 were strongest, reducing the percentage of people in poverty nationally by:

  • 7.4 percentage points for those without a high school diploma
  • 4.7 percentage points for those who worked part-time or did not have work at least part of the year
  • 1.7 percentage points for white, non-Hispanic residents
  • 4.3 percentage points for Black residents
  • 4.9 percentage points for Hispanic/Latinx residents

Please note that NJPP is presenting poverty data based on the Supplemental Poverty Measure, which more accurately reflects basic needs of households better than the “official” poverty measure:

  • The “official” poverty measure compares a family’s cash income to the cost of a minimum food diet from more than 50 years ago, failing to account for other household costs like housing or utilities and failing to adjust for geographic differences.
  • The Supplemental Poverty Measure includes a wider range of cash and non-cash benefits and costs, including taxes and tax credits, food assistance, work or medical expenses, and child support, while also accounting for more costs like clothing, shelter, and utilities.


Even the Supplemental Poverty Measure fails to account fully for the high cost of living in New Jersey, as noted in a recent report from Legal Services of New Jersey on the true cost of poverty. Based on the “official” poverty measure, New Jersey’s poverty rate between 2018 and 2020 was 7.6 percent, compared to the Supplemental Poverty Measure of 10.0 percent.

For more information on the supplemental poverty measure, see here>.

Separate and Unequal: Racial and Ethnic Segregation and the Case for School Funding Reparations in New Jersey

Reinforced by racial segregation and income inequality, the U.S. public schooling system is one of the most unequal in the industrialized world – and New Jersey is no exception. Earlier NJPP reports on education find that the state makes a relatively strong effort to fund its schools, leading to many districts exceeding national averages on test scores.[1] Yet, too many students aren’t given the resources they need to ensure equal educational opportunity.[2] Overwhelmingly, these are Black and Hispanic/Latinx children, living in communities with lower property values and, consequently, lower local capacity to raise revenues to fund schools.

It is no accident that New Jersey’s Black and Hispanic/Latinx students are enrolled in school districts with lower tax capacity: racist practices such as “redlining” and “block busting” have created segregated communities with artificially lower property values.[3] These practices cannot be simply dismissed as sins of the past: the generational wealth taken from the residents of these communities has profound effects on school funding today.

The COVID-19 pandemic further exposes these patterns of institutionalized racism that have resulted in poverty-related education disparities and substantial racial inequities in school resources. For example, NJPP reported last year that children of color were much less likely to have access to a school that offered in-person instruction during the pandemic.[4] Unquestionably, this inequity was due, in part, to disparities in school funding: the better-funded a school district, the more likely it was to have school buildings open to students. But it would be a mistake to suggest school funding capacity, by itself, accounts for all of New Jersey’s chronic inequities in educational resources.

This report examines the history, policies, and practices that negatively affect Black and Hispanic/Latinx students in New Jersey. Included in the following analysis is discussion of the plight of Hispanic/Latinx populations both because many of the mechanisms of discrimination used to disadvantage Black students and families in the past were similarly applied to Hispanic/Latinx populations, and because our own recent work reveals even more substantial school funding disparities affecting Hispanic/Latinx communities.[5]

The report concludes by making a case for school funding reform as a reparation for the racist housing practices that have negative effects on taxpayers and students of color even today. New Jersey should recalibrate its school funding law to account for the additional costs of educating students in racially isolated schools, both to improve outcomes for those students and to provide tax relief to property owners in communities that have suffered the loss of wealth and resources due to systemic racism.

Examining Race and Racism in Educational Opportunity

Racial inequity in education does not happen in a vacuum. In fact, race, poverty, school funding, and educational inequality share substantial intersections. Yet, race on its own is a powerful and independent influence on educational resources and outcomes. A major contributing factor to racial inequity is structural racism: a system in which public policies and other norms, like those that determine funding and tax liabilities, privilege “whiteness” and disadvantage people of color, creating inequities that endure and adapt over time.[6]

Of course, racism that causes these disparities is often implicit. Unfortunately, white and elderly individuals often fail to support adequate resources and funding for public services directed toward Black and brown communities, even while supporting such funding for their own communities.[7] But racism in this area may also be explicit, such as historical racial restrictions on homeownership imposed less than a generation ago by local homeowners’ associations, as well as the downgrading of property values in predominantly Black neighborhoods in the mid-1900s, causing segregation.

Many of New Jersey’s school districts are still segregated today, with varying degrees of racial isolation[8] and capacity to raise local revenues for schools. And while there are funding disparities within-district, the most egregious school funding disparities in New Jersey are between districts.[9] Residential racial isolation is, therefore, an important concern when addressing school funding inequity.

It may be tempting to dismiss New Jersey’s history of segregation, which greatly affects its current racial disparities in school funding, as less pernicious and less relevant than those in other states – particularly Southern states whose school funding systems are even less equitable than New Jersey’s.[10] But examining both the historical record and current data shows New Jersey can’t ignore how structural racism has hurt – and continues to hurt – its children of color. If every child is to receive the education they deserve, the state must confront the underlying, racially-driven forces that prevent too many children from attending well-resourced schools.

Racial Isolation in New Jersey and School Funding: Three Examples

To illustrate the various ways structural racism has created both racial segregation and school funding inequity, this report highlights three examples of majority-Black school districts: East Orange, Willingboro, and Lawnside.

The table below compares each district to a majority-white district close by. “Income per pupil” refers to the total amount of personal taxable income reported in the district divided by the number of resident students enrolled in the school district. “Equalized Value per Pupil” is the total equalized property value[11] of the district divided by enrolled students. Each is a way to evaluate the relative wealth of a district; both are used in the state’s funding formula to determine a community’s ability to raise local revenues for schools.

In all three of our examples, majority-Black districts have far less local capacity to raise revenues for their schools than nearby majority-white districts. How these disparities came to be, however, is different in each community.

East Orange

The history of segregation efforts through “redlining” – the racist practice that denied mortgages to Black residents, preventing them from buying homes in certain neighborhoods – is well established in the U.S. In New Jersey, redlining practices by the Homeowners Loan Corporation (HOLC) in the late 1930s have had lasting effects, particularly in northern counties such as Essex, Hudson, Union, and Bergen. The HOLC classified “risk criteria” for issuing insured loans: homes in non-immigrant white neighborhoods were deemed the lowest risk, while homes in Black neighborhoods were deemed high-risk and often ineligible for insured loans. As a result, the expansion of access to homeownership, through both Federal Housing Authority (FHA) and Veterans Administration (VA) backed loans, became a primary path to building family wealth in the post-WWII period; however, due to restrictions in access to these loans, Black residents were largely excluded from this opportunity.

The effects of the racist practice of redlining on school segregation and funding in New Jersey are evident even today. The map below shows the 1939 HOLC grading for Essex and portions of Hudson, Union, and Bergen County. Blue areas were A-graded; red areas were D-graded. Among the considerations in assigning grades were shares of Black residents and immigrants (usually with reference to Italian immigrants), both of which led to rating downgrades.[12] On top of these gradings, the map is overlaid by the current (2018) school district boundaries with proportions of enrollments that are Black (red, left slash) or Hispanic/Latinx (green right slash).

East Orange is typical of the majority-Black school districts in this part of the state: many of its neighborhoods were redlined and deemed high-risk, leading to an inevitable decrease in property values. Other formerly redlined areas in Irvington, Orange, and Newark remain predominantly Black. Other areas, including those where neighborhoods were mostly A-graded, were and remain mostly white.

Willingboro

William Levitt (of Levittown fame) first established Willingboro in Burlington County as a post-WWII suburb of Camden and Philadelphia. His intention was to create a new community as lily-white as other Levitt communities around the country.[13] Levitt was not shy about his intentions, proclaiming in 1958 that he would not sell houses in Willingboro to Black residents.[14] Shortly after, the Reverend Willie James, a Black civil rights activist, who was turned away at Levitt’s developer’s sales office, sued to racially integrate the neighborhood. The matter eventually reached the New Jersey Supreme Court, which ruled in favor of the Reverend.[15] In 1967, the community was fully opened to Black homeowners. However, realtors quickly engaged in a classic behavior known as “block busting”: invoking fear in white families of declining property values and quality of life. Concurrently, predominantly white developments in neighboring communities expanded, using zoning restrictions (opposing multi-family units and constraining affordability) to maintain racial restrictions. The town attempted, unsuccessfully, to stop the racial turnover with a prohibition on “for sale” signs.[16] Soon after, the town’s demographics shifted, eventually becoming the majority Black community it is today.[17] As shown in the table above, Willingboro’s per pupil property values are lower than nearby majority-white school districts, a consequence of block busting that occurred only a few decades before.

Lawnside

Lawnside is among the few towns across the nation that was established as an African American community. This “free haven” was founded with the assistance of abolitionists and Quakers (who opposed slavery), eventually becoming a location along the Underground Railroad.[18] In 1926, Lawnside became an official borough of New Jersey and soon developed community institutions required for self-governance, after fighting to remain an autonomous Black community.[19] For all its successes at establishing itself as a self-governing Black community, remaining more middle-class than other Black communities near Camden or Philadelphia, Lawnside was also subject to racist forces of urban planning, such as being bifurcated by the eventual development of major interstates (I-295) and the New Jersey Turnpike.

Willingboro and Lawnside are often cited as examples of thriving Black middle-class communities. But even these communities stand in stark contrast with their more affluent majority-white neighbors on measures of wealth and income. Moorestown has approximately 2.5x the taxable wealth and income of Willingboro. Haddonfield has more than triple the income level and about 78 percent higher taxable property wealth than Lawnside. These disparities put Lawnside and Willingboro at a distinct disadvantage when funding their schools – a disadvantage that, again, is borne out of systemic, historic racism.

The Growth of Hispanic/Latinx Isolation in New Jersey

No discussion of school funding and racial/ethnic isolation in New Jersey would be complete without noting the rise of majority Hispanic/Latinx communities in the state. New Jersey’s Hispanic/Latinx population has grown dramatically in recent decades, becoming more complex in terms of race and national origin. New Jersey has long been home to a significant Puerto Rican population, concentrated primarily in larger cities like Paterson, Newark, Camden, and Trenton. In the past two decades, the state’s Dominican, Mexican, Columbian, Ecuadorian, and Cuban populations have grown, often concentrating by national origin in specific communities and school districts across the state.

By 2018, 47 New Jersey school districts were majority Hispanic/Latinx, enrolling nearly 20 percent of the state’s students. Six of those districts were nearly entirely Hispanic/Latinx (over 90 percent) in their enrollments. These districts have high child poverty rates and many English Language Learners (ELLs).

Many majority-Hispanic/Latinx school districts are small, densely populated boroughs in the New York metropolitan area. Those tracts were redlined and over time became increasingly Black and, eventually, majority Hispanic/Latinx. Other outlying towns like Dover, Freehold Borough, and Bound Brook have also become majority Hispanic/Latinx over time with an influx of Peruvian and Ecuadorian immigrants. Along with locally governed zoning, the real estate industry has continued to play a role in steering Hispanic/Latinx immigrants toward specific communities and properties in New Jersey and away from others. In still other cases, secessions and school district reorganizations reinforced racial divides among districts.[20]

Racial/Ethnic Segregation and School Revenues: Comparing New Jersey to Other States

In statewide comparisons of school quality and educational outcomes, New Jersey often shares the top positions with Massachusetts and Connecticut. All three states are politically progressive but racially and economically segregated: New Jersey ranks 34th in racial educational integration, Connecticut 36th, and Massachusetts 42nd.[21] Despite their similarities, there are significant differences regarding racial segregation and school funding. Therefore, a comparison is instructive in helping to develop policies that equalize educational opportunities for New Jersey’s children.

The table below shows the shares of student enrollments currently attending public school districts that are majority Black or majority Hispanic/Latinx, compared to 1988, the earliest data available. While the share of New Jersey students attending majority Black districts has declined, it has remained larger than in Massachusetts or Connecticut. Connecticut presently has only one majority Black school district, Bloomfield, while the state’s larger cities have become increasingly Hispanic/Latinx over time.[22] In all three states, the share of children attending majority Hispanic/Latinx districts has increased dramatically over the past 30 years.


Race/Ethnicity and Disparities in Wealth and Tax Rates

The table below shows the racial disparities in incomes, housing values, and effective tax rates in all three states – New Jersey, Connecticut, and Massachusetts – using U.S. Census Bureau data. Although politically liberal states, they remain highly segregated by race and have vast income inequality. The table summarizes the average household income and average housing values for Black, Hispanic/Latinx, and “other” homeowners (largely white) in each state. Across all three states, housing value gaps are largest for Blacks. Yet, the gap in Massachusetts is relatively small, while the largest gap by far is in Connecticut (for both Black and Hispanic/Latinx homeowners). New Jersey is positioned somewhere in the middle: better than it could be, but not as good as it should be.

The value-to-income ratio characterizes how much value homeowners acquire through their homes relative to their income levels; higher values indicate that a homeowner has gained more wealth, relative to their income, through the value of their home. In Massachusetts, Black homeowners do not face this deficit: the housing wealth they have acquired, relative to their income, is similar to “other” (non-Black and non-Hispanic/Latinx) residents. But in both Connecticut and New Jersey, Black homeowners suffer from a deficit in property wealth; in other words, Black homeowners in these states have not been able to transfer the same amount of their income into the value of their homes as white homeowners. Hispanic/Latinx homeowners face a household value/income deficit in Massachusetts and New Jersey, but not in Connecticut.

It’s important to note that the estimated “value gaps” here are for homes with the same number of bedrooms in the same metropolitan area and year. Yet, the gaps are still large, suggesting that racial isolation is driving the differences in property wealth and, consequently, a community’s capacity to raise revenues for its schools. These disparities in home values lead directly to disparities in taxation because a district with lower property values must levy a higher tax rate to raise the same amount of revenue as a town with higher values. The table below shows the differences in effective property tax rates by race & ethnicity for each state. In both Connecticut and New Jersey, Black and Hispanic/ Latinx homeowners are paying what is, in effect, a discrimination tax, with Black homeowners paying the highest effective rate.

Race/Ethnicity and Disparities in School Revenues

Statewide school funding systems can take multiple approaches to ameliorate these disparities in tax rates. One approach is to invest more school and municipal aid from the state to low-income communities. Because this aid is paid for with revenues from all of the state’s taxpayers, the burden to raise local school revenues lessens in low-income school districts and towns, which have lower property values and, therefore, less capacity to raise funds locally. State aid to schools, however, must be targeted appropriately and robust enough to address the racial and ethnic disparities in property wealth.

New Jersey’s state aid to schools helps to drive more total revenues to schools enrolling Black students. Unlike Connecticut, where Black students attend schools that receive $2,370 less per pupil in state and local revenue than white students, New Jersey’s Black students receive $2,939 more per pupil than white students. In contrast, New Jersey’s Hispanic/Latinx students receive $178 less per pupil than its white students; however, that gap is much smaller than the $2,370 gap suffered by Connecticut’s Hispanic/Latinx students.

Note, however, that New Jersey’s Black and Hispanic/Latinx homeowners still pay a higher tax rate, and a higher percentage of their income in property taxes, than what the state’s white homeowners pay. This is not the case in Massachusetts – and yet that state manages to drive more total revenue per pupil to Hispanic/Latinx students than white students. Further, Massachusetts’s Black students enjoy an even greater funding advantage, relative to whites, than New Jersey’s Black students.

The Cost of Equal Educational Opportunity

 Comparisons of school spending raise an important question: how much should be spent to provide students with an equal opportunity to achieve educational success? To answer this question, Bruce Baker developed the National Educational Cost Model (NECM).[23] This model uses actual school spending, test outcomes, and student characteristic data to estimate the cost of students achieving a particular level of education outcomes (measured by test scores), given their different needs and in costs in different regions.

While the NECM has limitations, it does accomplish two important tasks: first, it provides evidence that schools with varying student bodies need varying amounts of funding to provide an adequate education; second, it provides guidance for policymakers in setting spending targets for different school districts. For example, in previous work, NECM derived estimates have been used to suggest ways that New Jersey could recalibrate its system of school aid distribution to better meet the needs of schools that enroll differing student bodies.[24]

The table below shows the NECM’s predicted average cost of achieving current Massachusetts average outcomes in reading and math average for Connecticut, Massachusetts, and New Jersey, as well as how much each state actually spends. The figures are broken down by race and ethnicity, showing the differences in spending and estimated costs for white, Black, and Hispanic/Latinx students. Finally, the table shows the gap between the NECM estimated cost and the amount spent.[25]

The model shows all three states follow a similar pattern, although there are significant differences in the spending/cost gaps between the different states. In Massachusetts, for example, the average white student attends a district that spends approximately what is needed to achieve average outcomes. By contrast, the average Black student attends a district with a significant deficit toward providing equal opportunity; the average Hispanic/Latinx student faces the largest funding deficit. The patterns are similar in New Jersey, but the spending/cost gaps are smaller; again, Hispanic/Latinx students face the largest gaps. In Connecticut, both Black and Hispanic/Latinx students face similarly large funding gaps to achieve common outcome goals. The outcome goals set here – the average test scores for Massachusetts, one of the highest-performing states in the nation –are high ones.[26] But whether higher or lower goals, the relative positions of white, Black, or Hispanic/Latinx students stay the same.

Accounting for Racial Isolation in Educational Costs

NECM cost estimates differ by the variables it uses to describe students enrolled in different school districts. Poverty, for example, has a powerful effect on student outcomes; including a measure of poverty, therefore, provides a more precise estimate of the spending needed to achieve a desired outcome. The estimates above, however, come from a model that does not include student race; therefore, these gaps do not address any additional costs that may be associated with racial isolation of Black or Hispanic/Latinx communities.[27]

One signal that the cost projections are incomplete without accounting for racial inequities can be seen in the figures below. When we estimate a typical cost model but don’t include race (percentage of Black students) as a factor that might influence costs of equal opportunity, we tend to find that majority Black districts look relatively inefficient. That is, when racial isolation isn’t accounted for, majority-Black districts look like their funding is more adequate than it may be, and yet their performance lags (they invariably fall below the diagonal line).

However, before coming to this conclusion, one should remember that through historical discrimination and segregation, these districts have had additional costs imposed on them. Perhaps it’s not that these districts are less efficient; rather, systemic racism imposed additional costs on them to achieve common outcomes. When race is considered among the cost factors – in other words, when student race is added to the model that predicts educational costs – these districts no longer appear to be inefficient. It no longer looks, for example, like Willingboro has more than enough to achieve the desired outcomes but doesn’t because the district’s schools are inefficient; instead, Willingboro likely needs more resources, in part, because of its racial isolation.

We note here that we have not found the same effect for Hispanic/Latinx communities, perhaps because of the greater heterogeneity among predominantly Hispanic/Latinx communities. However, the models do already address differences in costs associated with English language proficiency; it may be that this variable captures the additional costs of educating students in ethnically isolated schools.

The following table provides alternative estimates of the per-pupil costs to achieve common (Massachusetts average) outcomes in reading and math using both a race-neutral cost model and a model that accounts for the percentage of Black students enrolled in a school district. Estimates are provided for New Jersey’s majority Black districts. East Orange, for example, spent just under $23,000 per pupil in 2018 and was estimated by the race-neutral model to require $26,755 to achieve Massachusetts mean outcomes. But, when taking race into account, that figure jumps to nearly $40,000 per pupil.

The margins of difference in the cost estimate when taking race into account are substantial; however, this is what our model, based on actual data, estimates is required to bring those districts into line with expected outcomes. The state should strive to achieve these spending targets, with consideration for race, through a school funding policy that ensures these targets can be reached at equitable taxation.

School Finance Reform: The Case for Reparations

Some might argue the approach of this report imposes a deficit orientation on Blackness and Black communities: that the assumption is that because a community or its schools have more Black students, they need additional resources. However, the deficit that exists today is the result of systemic and well-documented patterns of discrimination and segregation, which led to racial isolation, lost wealth, and opportunity denied through generations. This deficit is not simply an evil of the past: it continues to have profound effects on Black and Hispanic/Latinx students and communities right now. Providing aid to counter these multi-generational effects is a correction to a deficit imposed through racism; in effect, it is a reparation.

The term “reparation” is often used to describe payments specifically to Black family descendants of enslaved people, calculated in an amount to represent their financial losses resulting from enslavement. This report, however, presents a broader use of the term in response to the systemic racism of the recent past and present. The segregation and discrimination which has plagued New Jersey’s and our nation’s schools and communities has significant financial and educational consequences for Black and Hispanic/Latinx taxpayers and schoolchildren. Allocating funds to remove the funding gaps between school districts is one way to correct the educational disparities that have arisen due to systemic racism.

New Jersey remains highly segregated by race and income: the state has larger shares of students enrolled in majority Hispanic/Latinx and majority Black school districts than Connecticut or Massachusetts. While New Jersey has succeeded more than the other two states at progressively allocating state aid to reduce funding gaps, New Jersey’s current state aid to schools remains insufficient to fully close gaps in educational opportunity or fully mitigate racial inequities in property taxation.

Given this reality, this report presents four recommendations for New Jersey:

  1. New Jersey should develop measures to monitor wealth gaps by race and inequitable taxation on that wealth and consider developing a reparations package to provide tax relief to overtaxed Black and Hispanic/Latinx homeowners.
  2. New Jersey must commit to fully funding its state school funding formula, the School Funding Reform Act (SFRA). For over a decade, the state has refused to fund its own school funding law. Any meaningful reform of school funding must begin with the state meeting the obligations it has set for itself.
  3. New Jersey should recalibrate that formula to address current student needs and costs with respect to updated outcome goals. Only then will we know the extent to which SFRA is sufficient to offset racial disparities in taxation and equal opportunity to achieve common outcomes, such as the average test scores of Massachusetts.
  4. The recalibration of SFRA should include consideration of the additional costs associated with providing equal opportunity to achieve common outcome goals in the state’s racially isolated neighborhoods and schools. These costs may be identified through cost modeling methods like those cited herein and are consistent with recent studies of education costs and cost variation nationally[28] as well as in Kansas,[29] Vermont,[30] and New Hampshire.[31]

In addition, recent reporting finds that New Jersey faces an unexpected and substantial budget surplus.[32] The state should take this opportunity to address historic and system racism in school funding, to provide equitable educational opportunities for all students.


End Notes

[1] Weber, M., & Baker, B. D. (2020, November 17). School Funding in New Jersey: A Fair Future for All. New Jersey Policy Perspective. https://www.njpp.org/publications/report/school-funding-in-new-jersey-a-fair-future-for-all/

[2] Weber, M., & Baker, B. D. (2020, November 17). School Funding in New Jersey: A Fair Future for All. New Jersey Policy Perspective. https://www.njpp.org/publications/report/school-funding-in-new-jersey-a-fair-future-for-all/

[3] Andre M. PerryJonathan Rothwell, and David Harshbarger (2018). The devaluation of assets in Black neighborhoods. Brookings Institute. https://www.brookings.edu/research/devaluation-of-assets-in-black-neighborhoods/

[4] Weber, M. (2020, October 7). New Jersey’s School Re-openings Are Racially Unequal. New Jersey Policy Perspective. https://www.njpp.org/publications/blog-category/new-jerseys-school-re-openings-are-racially-unequal/

[5] Baker, B., & Cotto Jr, R. (2020). The under-funding of Hispanic/Latinx-serving school districts. Phi Delta Kappan, 101(6), 40-46. https://kappanonline.org/underfunding-Hispanic/Latinx-serving-school-districts-baker-cotto/

Baker, B. D., Srikanth, A., Green III, P. C., & Cotto, R. (2020). School funding disparities and the plight of Hispanic/Latinx children. Education Policy Analysis Archives, 28, 135. https://doi.org/10.14507/epaa.28.5282

[6] Aspen Institute. Glossary for Understanding the Dismantling Structural Racism/Promoting Racial Equity Analysis. Roundtable on Community Change. https://www.aspeninstitute.org/wp-content/uploads/files/content/docs/rcc/RCC-Structural-Racism-Glossary.pdf

[7] Oberfield, Z., Baker, B.D. (2021) Redistributing opportunity: The politics of progressive school spending (working paper); Chow, Kat. (June 8, 2018) Why More White Americans Are Opposing Government Welfare Programs. NPR. https://www.npr.org/sections/codeswitch/2018/06/08/616684259/why-more-white-americans-are-opposing-government-welfare-programs; Blake, J. (March 6, 2021). A drained swimming pool shows how racism harms White people, too. CNN. https://edition.cnn.com/2021/03/05/us/heather-mcghee-racism-white-people-blake/index.html

[8] Orfield, G., Ee, J., & Coughlan, R. (2017). New Jersey’s Segregated Schools (p. 43). The Civil Rights Project. https://www.civilrightsproject.ucla.edu/research/k-12-education/integration-and-diversity/new-jerseys-segregated-schools-trends-and-paths-forward/New-Jersey-report-final-110917.pdf

[9] Weber, M., & Baker, B. D. (2020, November 17). School Funding in New Jersey: A Fair Future for All. New Jersey Policy Perspective. https://www.njpp.org/publications/report/school-funding-in-new-jersey-a-fair-future-for-all/

[10] Baker, B. D., Weber, M. A., Srikanth, A., Kim, R., & Atzbi, M. (2018). The real shame of the nation: The causes and consequences of interstate inequity in public school investments. Rutgers, The State University of New Jersey. http://www.schoolfundingfairness.org

[11] New Jersey “equalizes” property values when calculating state aid to schools as a way to account for differences between communities in how they assess their property values. Cities and towns may choose to assess property values below, at, or above going market prices; equalization allows for more valid comparisons by comparing assessed values to listed selling prices in each community and adjusting property values accordingly.

[12] Robert K. Nelson, LaDale Winling, Richard Marciano, Nathan Connolly, et al., “Mapping Inequality,” American Panorama, ed. Robert K. Nelson and Edward L. Ayers, accessed June 12, 2021, https://dsl.richmond.edu/panorama/redlining/#loc=12/40.78/-74.295&mapview=graded&city=essex-co.-nj&area=D4

[13] Gans, H. J. (1982). The Levittowners: Ways of life and politics in a new suburban community. Columbia University Press.

[14] Patterson, M.J. (2012) On the Frontlines of Freedom: A Chronicle of the First 50 Years of the American Civil Liberties Union of New Jersey. Excerpt retrieved from: https://www.aclu-nj.org/about/50thanniversary/on-the-frontlines-of-freedom/on-the-frontlines-of-freedom-chapter-one-1

[15] Levitt & Sons, Inc. v. Div. Against Discrimination, Etc., 31 N.J. 514 (1960), 158 A.2d 177.

[16] Linmark Associates, Inc. v. Willingboro, 431 U.S. 85, 97 S. Ct. 1614, 52 L. Ed. 2d 155 (1977).

[17] Guliano, B. D. (1977). Banning of For Sale Signs and Its Effect on Fair Housing: Linmark Associates v. Township of Willingboro. Conn. L. Rev., 10, 980. “The percentage of nonwhites included in the population of Willingboro rose from 0.5% in 1960 to 11.7% in 1970 and to 18.2% in 1973. At the same time the white population showed a numerical decline from 38,326 in 1970 to 36,485 in 1973.” (p. 985)

[18] Rose, H. M. (1965). The all-Negro town: Its evolution and function. Geographical Review, 55(3), 362-381.

[19] Romisher, J. E. (2018). Youth Activism and the Black Freedom Struggle in Lawnside, New Jersey (Doctoral dissertation, Arts & Social Sciences: Department of History).

[20] Rasmussen, C. (2017). Creating segregation in the era of integration: School consolidation and local control in New Brunswick, New Jersey, 1965–1976. History of Education Quarterly, 57(4), 480-514.

[21] McCann, Adam (Jan 12, 2021). “States with the Most Racial Progress.” https://wallethub.com/edu/states-with-the-most-and-least-racial-progress/18428

[22] Putterman, Alex (February 19, 2021) “West Hartford is mostly white, while Bloomfield is largely Black; how that came to be tells the story of racism and segregation in American suburbs.” Hartford Courant. https://www.courant.com/news/connecticut/hc-news-west-hartford-bloomfield-housing-segregation-discrimination-20210214-eoobsguoybguznkoa4n2ravwli-story.html

[23]Baker, B.D., Di Carlo, M., Weber, M. (2021) The Adequacy of School District Spending in the U.S. Albert Shanker Institute. https://www.schoolfinancedata.org/wp-content/uploads/2021/03/SFID_DCDbrief_Mar2021.pdf

[24] Weber, M., & Baker, B. D. (2020, November 17). School Funding in New Jersey: A Fair Future for All. New Jersey Policy Perspective. https://www.njpp.org/publications/report/school-funding-in-new-jersey-a-fair-future-for-all/

[25] Note that the “Current Spending” figure is inclusive of the spending of federal and other revenues, and will therefore differ from the figures in the previous table.

[26] “The Nation’s Report Card,” National Assessment of Educational Progress. National Center for Education Statistics. https://www.nationsreportcard.gov/profiles/stateprofile?chort=1&sub=MAT&sj=&sfj=NP&st=MN&year=2019R3

[27] Baker, B. D. (2011). Exploring the sensitivity of education costs to racial composition of schools and race-neutral alternative measures: A cost function application to Missouri. Peabody Journal of Education, 86(1), 58-83.

Baker, B. D., & Green III, P. C. (2009). Equal educational opportunity and the distribution of state aid to schools: Can or should school racial composition be a factor? Journal of Education Finance, 34(3), 289-323.

Green, P., Baker, B., & Oluwole, J. (2008). Achieving racial equal educational opportunity through school finance litigation. Stanford Journal for Civil Rights and Civil Liberties, 4, 283-338.

[28] Baker, B.D., Di Carlo, M., Weber, M. (2021) The Adequacy of School District Spending in the U.S. Albert Shanker Institute. https://www.schoolfinancedata.org/wp-content/uploads/2021/03/SFID_DCDbrief_Mar2021.pdf

[29] Taylor, L.L., Jason  Willis, Alex Berg-Jacobsen, Karina Jaquet, and Ruthie Caparas. (2018) Costs Associated with Reaching Student Achievement Expectations for Kansas Public Education Students: A Cost Function Approach. San Francisco: WestEd.

[30]Kolbe, T., Baker, B.D., Atchison, D., Levin, J. (2019) Pupil Weighting Factors Report. State of Vermont, House and Senate Committees on Education. https://legislature.vermont.gov/assets/Legislative-Reports/edu-legislative-report-pupil-weighting-factors-2019.pdf

[31] Baker, B.D., Atchison, D., Levin, J., Kearns, C. (2020) New Hampshire Commission to Study School Funding: Final Report. https://carsey.unh.edu/sites/default/files/media/2020/09/20-12685_nh_final_report_version_v5_draft_1.pdf

[32] Reitmeyer, John (June 10, 2021). “NJ has an extra $10 billion. The question is what to do with it.” NJ Spotlight News. https://www.njspotlight.com/2021/06/nj-has-an-extra-10-billion-the-question-is-what-to-do-with-it/

Labor Day Snapshot: New Jersey’s Uneven Recovery

Introduction

The COVID-19 pandemic has caused tremendous challenges for New Jersey’s workers, from unsafe working conditions to unprecedented job loss. While some portions of New Jersey’s economy are recovering, the job market is far from pre-pandemic levels and employment gains have not been equally distributed. In addition, many essential workers continue to perform work requiring face-to-face interactions, risking exposure to the virus as they carry out critical functions like growing and preparing food, caring for our loved ones, and providing transportation.

New laws expanding workplace protections and safety net programs have played an important role in supporting workers during the COVID-19 pandemic. While the crisis has not ended, several of these programs and policies have been terminated or allowed to expire, including expansions to unemployment insurance. Moreover, existing benefits and protections are not available to all workers, as many New Jersey residents continue to be systematically excluded from pandemic relief programs altogether.

This report includes an analysis of employment trends during the past year and offers recommendations to support a stronger and more equitable recovery for all workers.

Pandemic Safety Net Provides Crucial Support, but Falls Short of Need

Unemployment insurance has been a critical lifeline for many workers harmed by the pandemic by providing income support to those who lost their jobs.[i] Since the onset of the pandemic, over two million initial unemployment insurance claims have been filed in New Jersey.[ii] Unemployment insurance benefits not only support workers’ wellbeing and economic security but also the broader economy by sustaining consumer demand for goods and services.

The state has been able to support many workers who lost their jobs in part through aid from the federal government. Specifically, the Coronavirus Aid, Relief, and Economic Security (CARES) Act and American Rescue Plan (ARP) Act provided necessary funding to not only respond to the crisis, but also to rebuild a stronger economy.

However, many of these vital programs expire by September 6, Labor Day. For workers in New Jersey, the last payable week of benefits for pandemic unemployment programs was the week ending on September 4th:

  • Pandemic Emergency Unemployment Compensation (PEUC) provided additional weeks of federally funded unemployment benefits to workers who exhausted regular unemployment insurance.
  • Pandemic Unemployment Assistance Program (PUA) provided support to workers who are not typically eligible for state unemployment insurance, including self-employed workers, people seeking part-time work, and those who had to leave work for certain family reasons.
  • Federal Pandemic Unemployment Compensation (FPUC) provided a weekly supplement to workers receiving unemployment insurance benefits.


There will be some reprieve for certain workers as these programs expire. For instance, some workers facing long-term unemployment and currently on PEUC may be able to continue to receive unemployment insurance by shifting to the Extended Benefits (EB) program, which provides additional weeks of compensation to workers who have exhausted their regular unemployment benefits in states facing increased rates of unemployment.[iii]

Among the 133,000 workers on PEUC in New Jersey, an estimated 106,000 will be able to receive EB, according to The Century Foundation.[iv]

Another 259,000 workers who were receiving PUA will no longer get the support they need.[v]  As PUA recipients are ineligible for traditional unemployment, they will lose their benefits without other options for unemployment insurance. In total, an estimated 287,000 New Jersey workers on PUA and PEUC lost all unemployment benefits on September 4, 2021. Workers who are eligible for traditional unemployment insurance will continue to receive unemployment benefits, however, they will no longer receive the $300 supplement.

Excluded Workers Pushed Further Behind

Federal pandemic unemployment insurance programs provided financial support to many, but not all, workers who lost their jobs, as many New Jersey residents were left out, including certain immigrants, people recently released from the carceral system, and workers in the informal economy, including day laborers and domestic workers.

To lift these discriminatory barriers to critical financial support, the federal unemployment insurance program and immigration policy must be reformed. To that end, federal lawmakers are considering creating permanent protections and a path to citizenship for DACA recipients, TPS holders, farmworkers, and other essential workers, which would not only improve the economic security of these workers, but also improve their ability to contribute to and strengthen New Jersey’s vibrant communities and local economies. In the meantime, state lawmakers can temporarily address shortfalls in federal unemployment insurance and other safety net programs by making targeted investments in communities that are often excluded from public programs.

In May 2021, Governor Murphy announced a $40 million fund to provide direct payments to workers excluded from federal pandemic relief.[vi] The proposed structure for this program, a one time payment of up to $2,000 per household, will provide much-needed support, but falls far short of the needs of workers who faced financial hardship as a result of the pandemic. In a state with half a million undocumented immigrants, the proposed fund level will only reach a small portion of New Jersey’s workers excluded from most other forms of relief.[vii] Meanwhile, several states and localities, including neighboring New York, are providing relief that is much closer to unemployment insurance.

New Jersey’s Labor Market Gains Are Unevenly Distributed

At the onset of the COVID-19 pandemic, New Jersey’s labor market lost an unprecedented 717,000 jobs as employment plummeted from 4.2 million in February 2020 to 3.5 million in April 2020.[viii] New Jersey has seen steady job growth in recent months, recovering 62 percent of jobs lost in March and April 2020. More than one year later, a substantial gap in the labor market remains — in July 2021, New Jersey had nearly 276,000 fewer jobs than just before the pandemic, according to the latest jobs report.[ix]

While the full impact of the recent surge in COVID-19 cases remains unknown, this resurgence will heighten concerns about health and safety among both workers and consumers and could lead to the loss of recent gains in employment.

Given the nature of the current crisis, service-providing industries involving high levels of interaction among people face disproportionate job loss. Following national trends, New Jersey’s leisure and hospitality jobs were especially hard-hit. Leisure and hospitality jobs in New Jersey dropped from 400,000 jobs in February 2020 to 198,000 jobs in April 2020 — half of total pre-pandemic employment.[x] While this industry has seen substantial job growth in recent months, employment in leisure and hospitality remains more than 20 percent below pre-pandemic levels.[xi] The workforce in this industry includes a disproportionately large share of women, people of color, young adults, and low-paid workers.[xii] Even within this sector, workers earning the lowest wages as well as women and people of color experienced the greatest losses.[xiii]

Inequities in Unemployment and Underemployment Persist

New Jersey’s unemployment rate skyrocketed from 3.8 percent in March 2020 to 16.6 percent in April 2020 due to the COVID-19 pandemic. Since then, the unemployment rate has partially recovered to 7.3 percent statewide.[xiv] The unemployment rate measures the share of the labor force that is actively seeking employment within the past four weeks but unable to secure work.

While the number of unemployed people increased among all groups of workers during the pandemic, job loss was not felt evenly due to persistent disparities in access to education, housing, wealth, and employment. Accordingly, employment is not recovering equally:

  • Employment in low-wage jobs remains 28 percent lower than pre-pandemic levels.
  • Employment in middle-wage jobs has grown 3 percent higher than pre-pandemic levels.
  • Employment in high wage jobs has recovered from the initial impact of the pandemic and is now 5 percent higher than pre-pandemic levels.[xv]


For Black and Hispanic/Latinx New Jerseyans workers, recovery has been even more challenging. Specifically, in 2020, Black workers were 77 percent more likely to be unemployed and Hispanic/Latinx workers were 60 percent more likely to be unemployed than white workers.[xvi]

Demographic patterns in underemployment since the onset of the pandemic reveal a similar pattern. Racial inequities in underemployment in New Jersey not only persisted after the onset of COVID-19, but widened, as underemployment rates rose more sharply for Black and Latinx workers than for white workers. In 2020, unemployment rates among Black and Hispanic workers in New Jersey were each over 20 percent, while only 12.5 percent of white workers were underemployed.[xvii] Underemployment is a measure of the share of the labor force that is either unemployed or working part time but wants to work full time, or wants to work and is available to work but has given up actively seeking work in the last four weeks.

Gender disparities in underemployment also widened with the onset of COVID-19. While men and women experienced similar rates of underemployment in 2019 (6.8 percent and 6.9 percent respectively), underemployment rose to 14 percent among men and 16.8 percent among women in 2020.[xviii]

Loss of Unemployment Insurance Disproportionately Harms Women and People of Color

Unemployment insurance claims reflect the racial and gender disparities in employment that have persisted during the pandemic. New Jersey workers who are women, Black, and Hispanic/Latinx make up a disproportionate share of unemployment insurance claims relative to their share of the state’s workforce. For example, while Hispanic/Latinx workers make up 19 percent of New Jersey’s workforce, 23 percent of unemployment claimants in New Jersey are Hispanic/Latinx. Women are also overrepresented among unemployment claimants in New Jersey — while women make up 48 percent of New Jersey’s workforce, 54 percent of unemployment claimants in New Jersey since March 2020, on average, are women. 

Worker Protections and Income Supports Critical to Recovery

The COVID-19 pandemic has highlighted and reinforced the importance of worker protections, good quality jobs, and a strong safety net. Even before the pandemic, wages had been largely stagnant for workers in the lowest paid industries until the recent increase in the state minimum wage.[xix] As a result, many workers earn too little to make ends meet, let alone save for a rainy day. When the health emergency hit, many New Jersey workers who lost their jobs had little or no savings. Coupled with low wages, massive gaps in worker protections and safety net programs continue to leave many New Jersey workers particularly vulnerable to crises.

Among New Jersey residents who were able to stay employed, many continued to earn substandard wages, face unsafe conditions, and lack access to adequate sick days and paid leave. In the absence of federal worker health and safety standards and protections, Governor Murphy issued Executive Order 192 in the fall of 2020, which established health and safety protocols, including guidelines relating to social distancing, face masks, cleaning and disinfecting guidelines, and health checks. The executive order also directed the Department of Labor and Workforce Development to develop a mechanism for receiving complaints and to provide compliance and safety training for employers and employees. Since November 2020, workers in New Jersey have filed over 3,000 complaints against their employers.[xx] Following a subsequent executive order which ended the COVID-19 Public Health Emergency, however, the health and safety protocols outlined in Executive Order 192 are no longer required, even as COVID-19 cases are rising with the growth of the Delta variant.[xxi]

Lack of labor and health and safety standards and enforcement leaves many workers unable to speak out about unsafe conditions without risk of retaliation or loss of income. In addition, inadequate access to paid leave and sick days poses challenges for workers who need to care for loved ones, recover from illness, or receive vaccinations and recover from side effects. Unfortunately, for too many workers, access to health care is also attached to employment. Disparities in economic security and employment create disparate risks of exposure to the virus, and accordingly, may contribute to racial and ethnic disparities in COVID-19 cases and deaths.[xxii]

Advancing a more inclusive recovery and economy will require not only job growth, but policies that support quality jobs with access to paid leave, sick time, fair scheduling, and adequate wages.

Recommendations for an Inclusive Recovery

An inclusive pandemic recovery will require targeted investments and policies that support the health and economic security of all New Jersey residents. Many of the disparate impacts of COVID-19 outlined in this report are rooted in social and economic injustices, which continue to create barriers for many workers and families. Accordingly, a return to the status quo will only perpetuate these structural inequities.

There are several immediate steps that New Jersey lawmakers can take to improve conditions for workers across the state who have been left behind by existing policies. As some workers lose access to unemployment insurance benefits, and others continue to be excluded from unemployment insurance altogether, improving access to income supports and programs that can help families cover the cost of basic needs, like food, rent, and childcare, is more important than ever. In addition, taking steps to improve worker health safety will improve the wellbeing of workers’ families and communities, and by extension, improve our state’s economic recovery from the current crises.

Fully Fund Pandemic Relief and Income Replacement for Excluded Workers

While most New Jersey residents harmed by the pandemic have been able to turn to unemployment insurance, stimulus payments, and other programs, many workers who have experienced unemployment in New Jersey continue to face financial hardship without relief. New Jersey lawmakers can help address this gap by fully funding the Excluded Workers Fund in order to provide payments and income replacement to all workers who have been excluded from federal relief programs.

Expand Access to Paid Sick Days

With the state’s economic health inextricably linked to its public health, ensuring that workers have access to paid sick days is critical to the state’s recovery. Unfortunately, New Jersey’s current earned sick day law is both insufficient to meet the needs of the current health emergency and burdensome for many workers. New Jersey only requires that employers provide five sick days per year, and employers can require that workers wait 120 days after the first day of work to use sick days. As a result, many workers are unable to take all the time they need to recover from an illness or to get a vaccine without sacrificing income or facing retaliation from their employer. New Jersey can ensure that more workers are able to take sick leave when they need it by increasing the number of paid sick days available to workers, raising awareness about and better enforcing the state’s sick days law, and reducing barriers to taking sick days.

Strengthen Worker Protections

As workers continue to face unsafe conditions and fear retaliation, strengthening worker protections is necessary to fully recover from the health and economic crises. The state should provide clear and enforceable health and safety standards and protocols. In addition, given the threat and reality of retaliation in many workplaces, lawmakers should adopt statewide job protections to prohibit employees from being punished or fired without warning or a good cause. Preventing retaliation for raising concerns about workplace problems, such as health and safety violations, can improve stability and economic security for New Jersey’s workers. Another mechanism for improving conditions for workers is targeted legislation that addresses the unique circumstances of workers in industries rife with worker exploitation and health and safety concerns, including temp work and domestic work.

Raise Substandard Wages

Low wages compromise the well-being and economic security of many New Jersey residents. While New Jersey’s minimum wage law has improved conditions for some workers, many workers, including tipped workers and farmworkers, earn less than the standard minimum wage of $12.00 per hour. In addition, many workers who have been risking their own safety to provide essential services throughout the pandemic earn too little to make ends meet. One mechanism for raising substandard wages is by convening wage boards. Through wage boards, labor representatives, employers, and state labor officials could work together to agree upon fair wage standards for an entire industry.

A Strong Recovery Requires Strong Worker Protections

With the Delta variant on the rise and the threat of additional variants looming, New Jersey’s economic recovery is directly tied to recovery from the health crisis. While steady increases in job numbers provide hope, the quality of jobs is equally important. An inadequate safety net, combined with decades of wage stagnation and declining worker power, leaves many workers with no good options during this challenging time. The termination of key safety net programs and worker protections will cause more workers to be pushed into economic hardship or into jobs with unsafe conditions, low wages, and limited access to sick days and paid leave. A strong and equitable recovery from this crisis will require lawmakers to create supports and protections for workers that match the health and economic conditions of this challenging time.


End Notes

[i] Center on Budget and Policy Priorities. 2014 (Updated in 2020). “Introduction to Unemployment Insurance.” https://www.cbpp.org/research/introduction-to-unemployment-insurance

[ii] United States Department of Labor Employment and Training Administration. “Unemployment InsuranceWeekly Claims Data.” Retrieved from https://oui.doleta.gov/unemploy/claims.asp

[iii] Center on Budget and Policy Priorities. 2021. “Policy Basics: Unemployment Insurance”. https://www.cbpp.org/research/economy/unemployment-insurance

[iv] Stettner, Andrew. 2021. “7.5 Million Workers Face Devastating Unemployment Benefits Cliff This Labor Day.” https://tcf.org/content/report/7-5-million-workers-face-devastating-unemployment-benefits-cliff-labor-day/

[v] Stettner, Andrew. 2021. “7.5 Million Workers Face Devastating Unemployment Benefits Cliff This Labor Day.” https://tcf.org/content/report/7-5-million-workers-face-devastating-unemployment-benefits-cliff-labor-day/

[vi] “Governor Murphy Announces $275 Million in Relief for Small Businesses and Individuals Impacted by COVID-19 Public Health Crisis.” https://www.nj.gov/governor/news/news/562021/20210507a.shtml

[vii] Center for Migration Studies. “State-Level Unauthorized Population and Eligible-to-Naturalize Estimates.” http://data.cmsny.org/

[viii] United States Bureau of Labor Statistics. State and Area Employment, Hours, and Earnings. New Jersey – Total Nonfarm. Retrieved from https://data.bls.gov/cgi-bin/dsrv?sm

[ix] United States Bureau of Labor Statistics. State and Area Employment, Hours, and Earnings. New Jersey – Total Nonfarm. Retrieved from https://data.bls.gov/cgi-bin/dsrv?sm

[x] United States Bureau of Labor Statistics. State and Area Employment, Hours, and Earnings. https://data.bls.gov/timeseries/SMS34000007000000001?amp%253bdata_tool=XGtable&output_view=data&include_graphs=true

[xi] United States Bureau of Labor Statistics. State and Area Employment Hours, and Earnings. Retrieved from https://data.bls.gov/timeseries/SMS34000007000000001?amp%253bdata_tool=XGtable&output_view=data&include_graphs=true

[xii] Center for Economic Policy and Research. 2020. “A Basic Demographic Profile of Workers in Frontline Industries”. https://cepr.net/a-basic-demographic-profile-of-workers-in-frontline-industries/

[xiii] Economic Policy Institute. “Low-wage, low-hours workers were hit hardest in the COVID-19 recession.”  https://www.epi.org/publication/swa-2020-employment-report/

[xiv] United States Bureau of Labor Statistics. Local Area Unemployment Statistics. Retrieved from: https://www.bls.gov/data/

[xv] Opportunity Insights. “Economic Tracker.” Retrieved from https://www.tracktherecovery.org/

[xvi] Economic Policy Institute analysis of Current Population Survey microdata from the U.S. Census Bureau.

[xvii] Economic Policy Institute analysis of Current Population Survey microdata from the U.S. Census Bureau

[xviii] Economic Policy Institute analysis of Current Population Survey microdata from the U.S. Census Bureau

[xix]  Economic Policy Institute Analysis of Current Population Survey Microdata from the U.S. Census Bureau

[xx] Yi, Karen. 2021. “NJ Workers Filed Thousands of COVID-19 Complaints Against Their Employers. Here are the Worst Offenders.” Retrieved from https://gothamist.com/news/nj-workers-filed-thousands-covid-19-complaints-against-their-employers-here-are-worst-offenders  

[xxi] “Governor Murphy Highlights Aspects of Legislation Allowing for the Termination of the Public Health Emergency Effective as of July 4.” https://www.nj.gov/governor/news/news/562021/20210702c.shtml

[xxii] Yi, Karen. “‘Whole Generations of Fathers Lost As COVID-19 Kills Young Latino Men in NJ.’” Gothamist. https://gothamist.com/news/whole-generations-of-fathers-lost-as-covid-19-kills-young-latino-men-in-nj

Pandemic Relief Funds Must Be Used to Dismantle Racial, Gender, and Economic Inequities

The following testimony on American Rescue Plan funds was delivered before Governor Murphy’s American Rescue Plan virtual hearing on July 28, 2021. 

Good morning. I’m Sheila Reynertson and am a Senior Policy Analyst at New Jersey Policy Perspective (NJPP), a member of the For the Many NJ coalition. Thank you for the opportunity to testify on how best to administer the remaining $4 billion in Fiscal Recovery Funds (FRF) made available through the federal American Rescue Plan.

NJPP is fully aligned with the U.S. Treasury’s recommendation to use these flexible funds to “foster a strong, inclusive, and equitable recovery, especially with long-term benefits for health and economic outcomes.” The most effective way to achieve such a goal is to target aid to those most in need and begin dismantling racial, gender, and economic inequities exacerbated by the pandemic.

Here are a few essential ways to make the most of this opportunity. For more recommendations, please refer to the letter signed by organizations of the For the Many coalition.

Strengthen the Social Safety Net

New Jersey must be aggressive in reversing the pervasive barriers that keep the safety net out of reach for some families and allow poverty to remain widespread. Benefit programs are difficult, and sometimes impossible, to navigate for residents already under extreme stress. Unnecessary red tape for those struggling to find a job, feed their kids, or manage a health crisis is both punitive and regressive.

NJPP recommends using FRF dollars to spearhead a robust outreach campaign and application assistance for all social safety net and support services, targeting communities that face systemic barriers to learning about and accessing support programs, including immigrants and people of color with low-incomes as well as families in deep poverty who are less likely to owe and file taxes and, as result, may miss out on tax credits for low-paid workers and their families.

Provide Direct Cash Assistance to Residents Who Need It Most

Second, NJPP recommends using relief funds to stabilize residents facing hardship and keep their children safe from the long-term effects of deep poverty. The most straightforward way to boost household income of families who are living paycheck to paycheck is to provide direct cash payments with no strings attached — and regardless of immigration status. In fact, one targeted population that must be included is the nearly a half million undocumented immigrants who have been excluded from almost every form of state and federal relief for the past seventeen months. New Jersey can provide relief to these residents by fully funding the Excluded New Jerseyans Fund.

Support Low-Paid Essential Workers with Bonus Pay

It can’t be said enough: Those who worked outside of their home during the pandemic providing critical services like health care and food production were overwhelmingly women and people of color — and they often went without basic health and safety protections, paid leave, or hazard pay. These workers deserve recognition through fair compensation, yet they have been repeatedly overlooked in federal relief and recovery legislation. New Jersey can rectify this using FRF dollars to provide bonus pay to those with limited income and those who worked in difficult and often dangerous conditions so the rest of us could quarantine safely at home.

Advance Health Equity

Past policies and continuing racism in health care — the effects of which were on full display during the COVID-19 pandemic — have disproportionately burdened Black, Hispanic/Latinx, and indigenous populations. The physical and emotional toll of such disparity will be felt for years to come. NJPP recommends using FRF dollars to break down barriers and expand access to high-quality and affordable mental health care services for adults and children through provider recruitment efforts, insurance expansion, and improved Medicaid reimbursement. To reach chronically underserved low-income areas and Black and Hispanic/Latinx communities, fund mental health outreach efforts through community-based organizations. To reach pandemic-stressed students in high-poverty schools, provide enhanced payments for behavioral screenings and school counselors and mental health professionals.

Incorporate Racial Impact Analysis into Selection Process and Data Collection

Finally, even with the best of intentions, New Jersey’s distribution of these recovery funds is likely to exacerbate racial injustice without intentional strategies to do otherwise. To demonstrate a commitment to an equitable recovery, NJPP recommends that racial equity impact assessments be produced for FRF grants that have a potential racial impact. New Jersey can also foster a culture of advancing racial and gender equity by improving its data collection with data on gender, race, and ethnicity. By modernizing the IT infrastructure across departments, New Jersey can enhance the quality of administrative data to better evaluate existing programs and demonstrate transparency.

These recommendations would make the biggest difference in providing long-term benefits for communities most at risk of being left behind and laying the groundwork for a more prosperous future for all New Jersey families.

Thank you for this opportunity to testify today.