To read a PDF version of the full report, click here.
This policy brief assesses the impact of New Jersey’s unique primary ballot design, which structures ballots around the county line, on the state’s 2020 primary election outcomes. The brief examines ten primary races – four Democratic and four Republican contests for the U.S. House of Representatives and the Democratic and Republican contests for the U.S. Senate. The results suggest that structuring ballots around the county line impacts election outcomes by steering voters towards specific candidates. The county line also increases voter confusion, contributing to overvotes and undervotes. The impact of the county line appeared to be greatest in races that did not involve an incumbent. Candidates’ share of the vote varied by as much as 50 percentage points, based on whether or not they were on the county line.
Background
New Jersey primary ballots are unlike those of any other state. Other states organize their primary ballots around the electoral position being sought, such as Senator or Governor, with candidates listed beneath or immediately to the right of each electoral position. [1] This makes it easy for voters to determine which candidates are running for each office. In contrast, nineteen of New Jersey’s twenty-one counties organize their primary ballots around a group of candidates endorsed by either the Democratic or Republican Party. These groups of county party endorsed candidates are referred to as the “county line” or the “party line,” because they are presented on the ballot as a vertical or horizontal line of names, with a candidate included for every office. The county line generally receives prime location in one of the first columns or rows on the ballot. Candidates not on the county line are placed in other columns or rows, sometimes far away from the county line candidates.
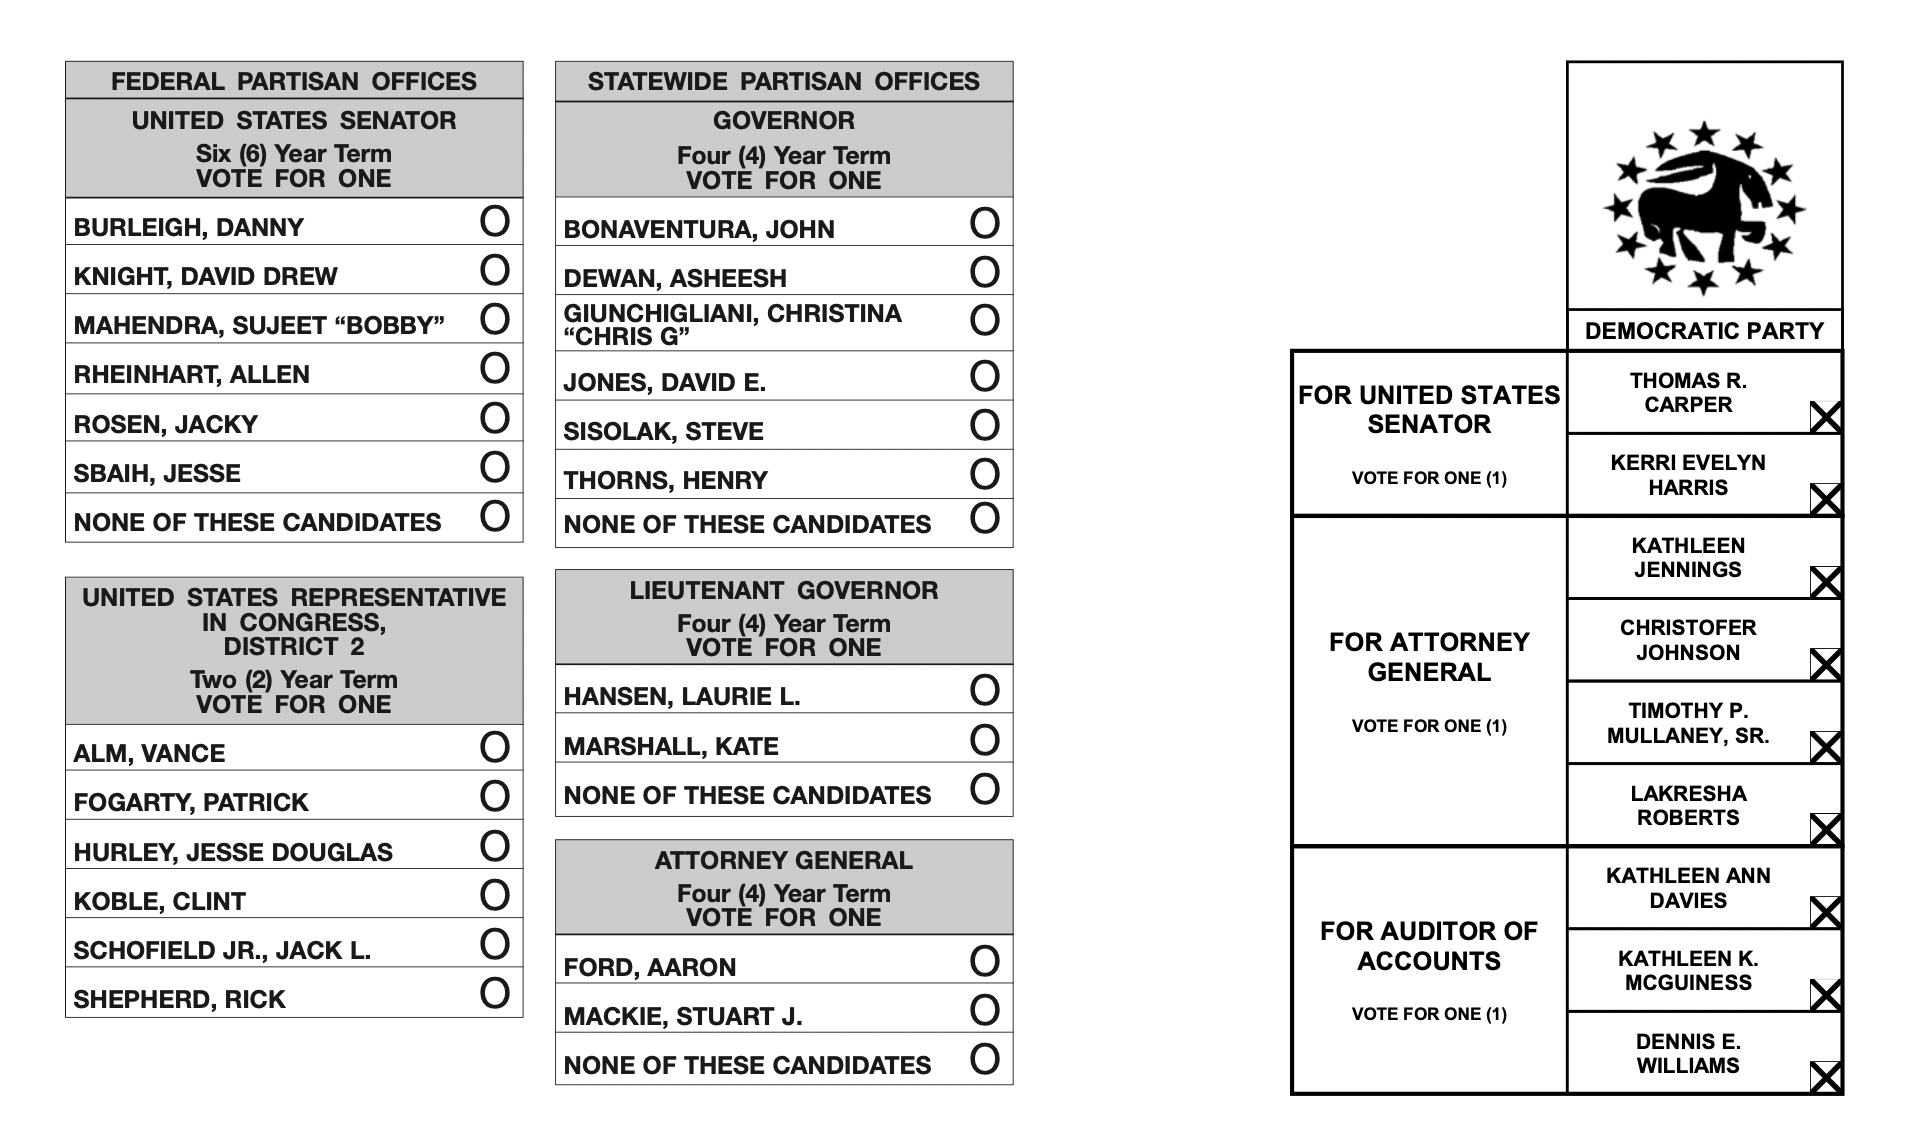
Figure 1 shows a 2020 New Jersey Democratic primary ballot from Monmouth County. The seven county line candidates are in column one. The remaining six candidates are scattered across the other four, mostly empty, columns. There is no obvious logic as to why each of the non-endorsed candidates is in a particular column. Column two includes a candidate for the U.S. Senate and two candidates for County Freeholder. Column three includes a candidate for President and his delegates. Columns four and five each include a single candidate for the U.S. House of Representatives.
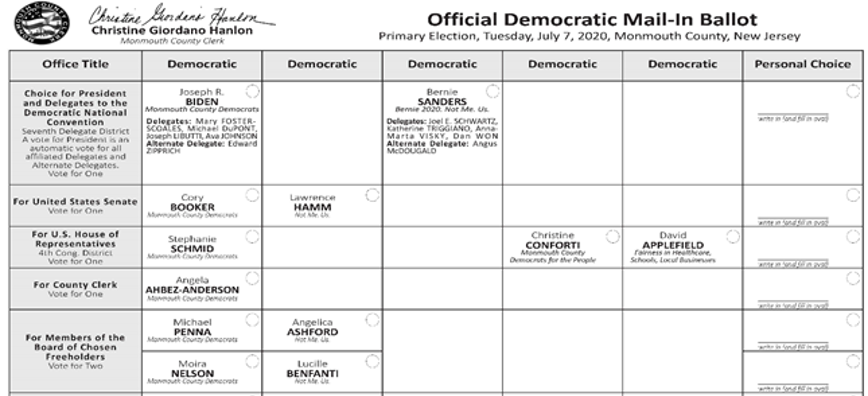 Figure 1: Monmouth County 4th Congressional District 2020 Democratic primary ballot.
This ballot design encourages voters to pick the candidates on the county line because they are easy to find and visually distinct. The county line is further advantaged by the placement of better-known candidates, such as those running for President, U.S. Senator, or Governor, at the top of the line and the inclusion of candidates for most or all of the offices on the ballot.
Designing primary ballots in this way violates important rules of good ballot design. Most critically, spreading candidates across multiple columns or rows and placing extra columns or rows between them, makes it much harder for voters to determine which candidates are running for each office. This results in voters not realizing that some positions are contested or, conversely, disqualifying their vote by mistakenly voting for too many candidates for a given position.[2]
A recent Communications Workers of America (CWA) analysis suggests that the county line has a significant impact on voter behavior. CWA found that no state legislative incumbent on the line had lost a primary election in New Jersey between 2009 and 2018.[3] Although incumbents generally win reelection, that advantage is rarely so absolute. In New York State, for example, twenty-two state legislative incumbents lost primary elections through 2018 and additional ones lost in 2020.
The county line may provide a substantial electoral advantage in congressional elections as well. Only two congressional incumbents have lost a primary in New Jersey in the last fifty years. In both cases, they lost to other incumbents, following redistricting that eliminated one of their districts. And, in both cases, the incumbent who won the primary had also received the party endorsement and the county line in the county that decided the election.[4]
The 2020 primary provides a unique opportunity to evaluate the impact of the county line on election outcomes. Historically, most New Jersey residents have voted on election day, using voting machines. In 2020, with New Jersey an epicenter of the COVID-19 outbreak, Governor Phil Murphy issued an executive order for the primary election to be conducted by mail. Voters also could vote at a limited number of polling places on election day using provisional paper ballots, or, if the voter was disabled, on an ADA-accessible voting machine.
As a result of the Vote-By-Mail directive, voters in three counties that usually vote using a machine ballot that is organized around the county line (Hunterdon, Passaic, and Warren) instead received paper ballots that resembled those used in other states, with candidates listed beneath the position they were seeking. This increased the number of counties using such ballots to five out of twenty-one for the Democratic primary and six out of twenty-one for the Republican primary, creating an opportunity to compare how candidates performed in congressional districts that included those counties.[5]
The 2020 primary also had a large number of contested races. In a few of those races, the county party organizations endorsed and awarded the county line to different candidates. This created an additional opportunity to examine the impact of the county line on electoral outcomes.
Democratic Party Primary Results
In the Democratic primary, four congressional districts and the U.S. Senate race were contested and included some counties that did not structure their primary ballots around a county line or county parties within the congressional district endorsing different candidates.
2nd Congressional District
Amy Kennedy won all eight counties in the 2nd Congressional district. However, Kennedy received a higher percentage of the vote in the three counties where she had the county line or no one had the county line than in the five counties where her opponent Brigid Harrison had the county line (see Figure 2).
Kennedy received 75% of the vote in Atlantic County, where she had the county line, and 50% of the total vote in the five counties where Brigid Harrison had the county line, a difference of 25 percentage points. Kennedy received 67% of the vote in Ocean County, where no candidates were endorsed or awarded the county line, and 63% of the vote in Salem County, where Brigid Harrison had the county party’s endorsement, but the primary ballot is not structured around the county line.
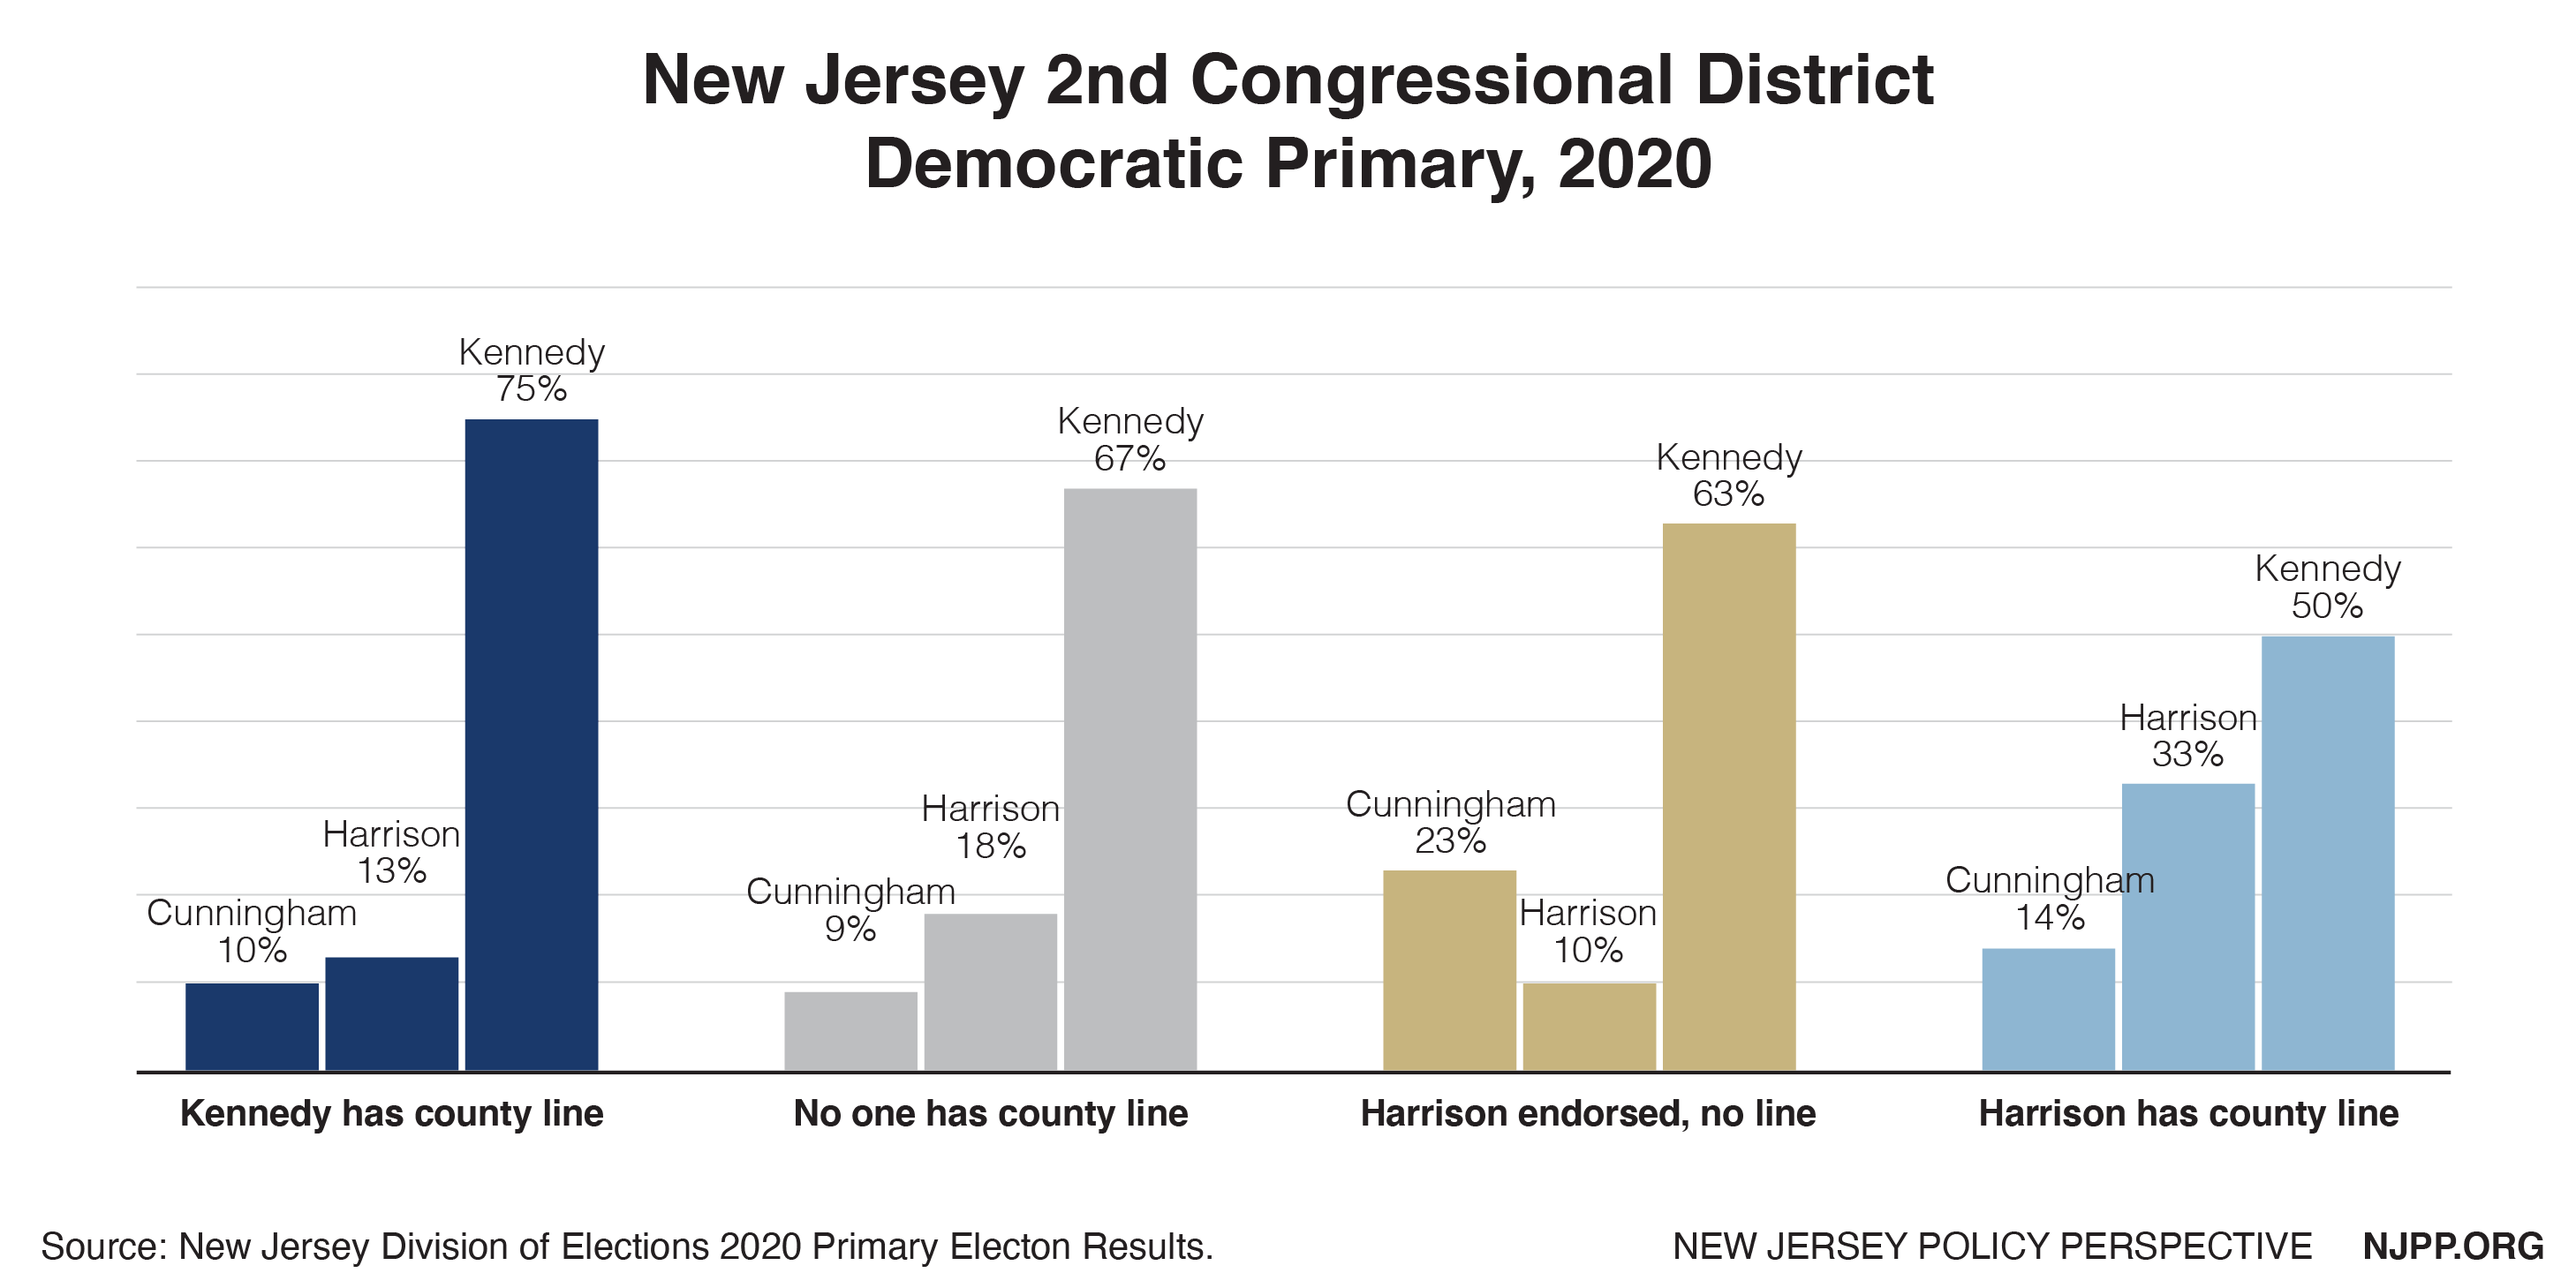
Figure 2: 2nd Congressional District Democratic Primary. Does not include Francis and Turkavage, who received < 3% of the vote.
This contest highlighted another aspect of how the county line may impact voter behavior. In Atlantic County, the number of valid votes cast for the U.S. Senate was substantially lower than the number cast for President (81%) or the House of Representatives (82%). In every other county, the total votes for U.S. Senate exceeded the number cast for the U.S. House of Representatives and equaled at least 97% of the total votes cast for President.
A likely explanation for Atlantic County’s unusual results is that U.S. Senator Cory Booker, whose reelection was endorsed by all twenty-one county parties, chose not to appear on the county line for the Second Congressional District’s Atlantic and Ocean County ballots. Instead, Booker bracketed with Brigid Harrison, who did not have the county line in either county (see Figures 3 and 4 for Atlantic and Ocean Democratic primary ballots for the 2nd Congressional District). Many Democratic voters, used to marking their ballots for everyone on the county line, may not have realized that the Atlantic County line did not include a candidate for U.S. Senate, or they may not have known that they could vote for candidates who are not on the county line.
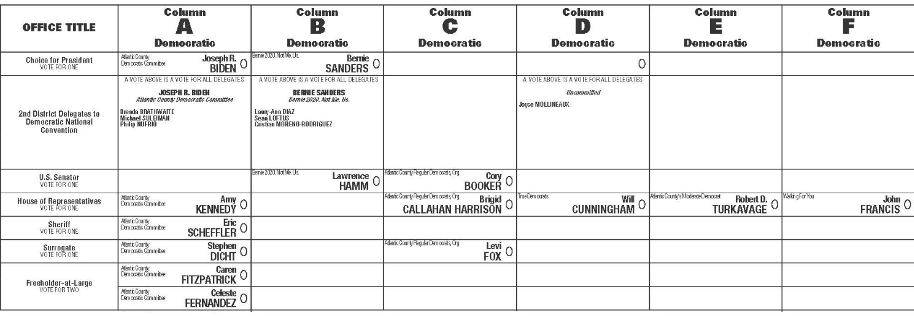 Figure 3: Atlantic County 2nd Congressional District 2020 Democratic primary ballot.
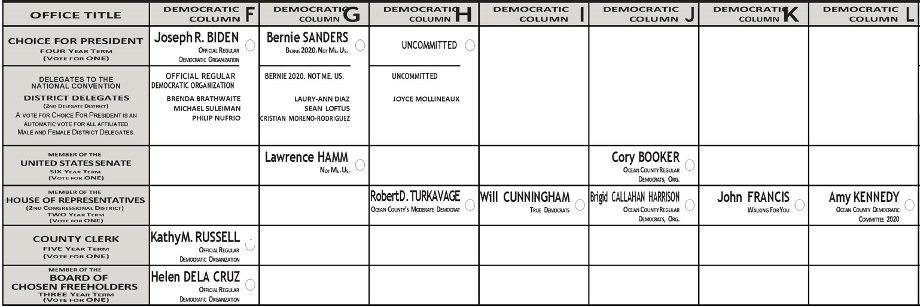 Figure 4: Ocean County 2nd Congressional District 2020 Democratic primary ballot.
Ocean County did not experience a similar drop in votes for U.S. Senate. This may reflect the fact that Ocean County voters had to select candidates off the county line for both the U.S. Senate and House of Representatives races, making the county line less visually dominant on the Ocean County ballot and signaled to voters that voting off the line was a legitimate option. In contrast, Atlantic County voters did not have to vote off the county line for any office except the U.S. Senate.
4th Congressional District
Christine Conforti and Stephanie Schmid split endorsements in the 4th Congressional District. Conforti receiving the party endorsement in Mercer County and Schmid received the party endorsements in Monmouth and Ocean Counties. Mercer County Democratic party bylaws allow all candidates that receive at least 40% of the vote at the party’s endorsement convention to appear on the county line. This resulted in both Conforti and Schmid being included on the Mercer County line. Conforti received a larger percentage of the convention votes and the endorsement, so she was listed first (see Figure 5).
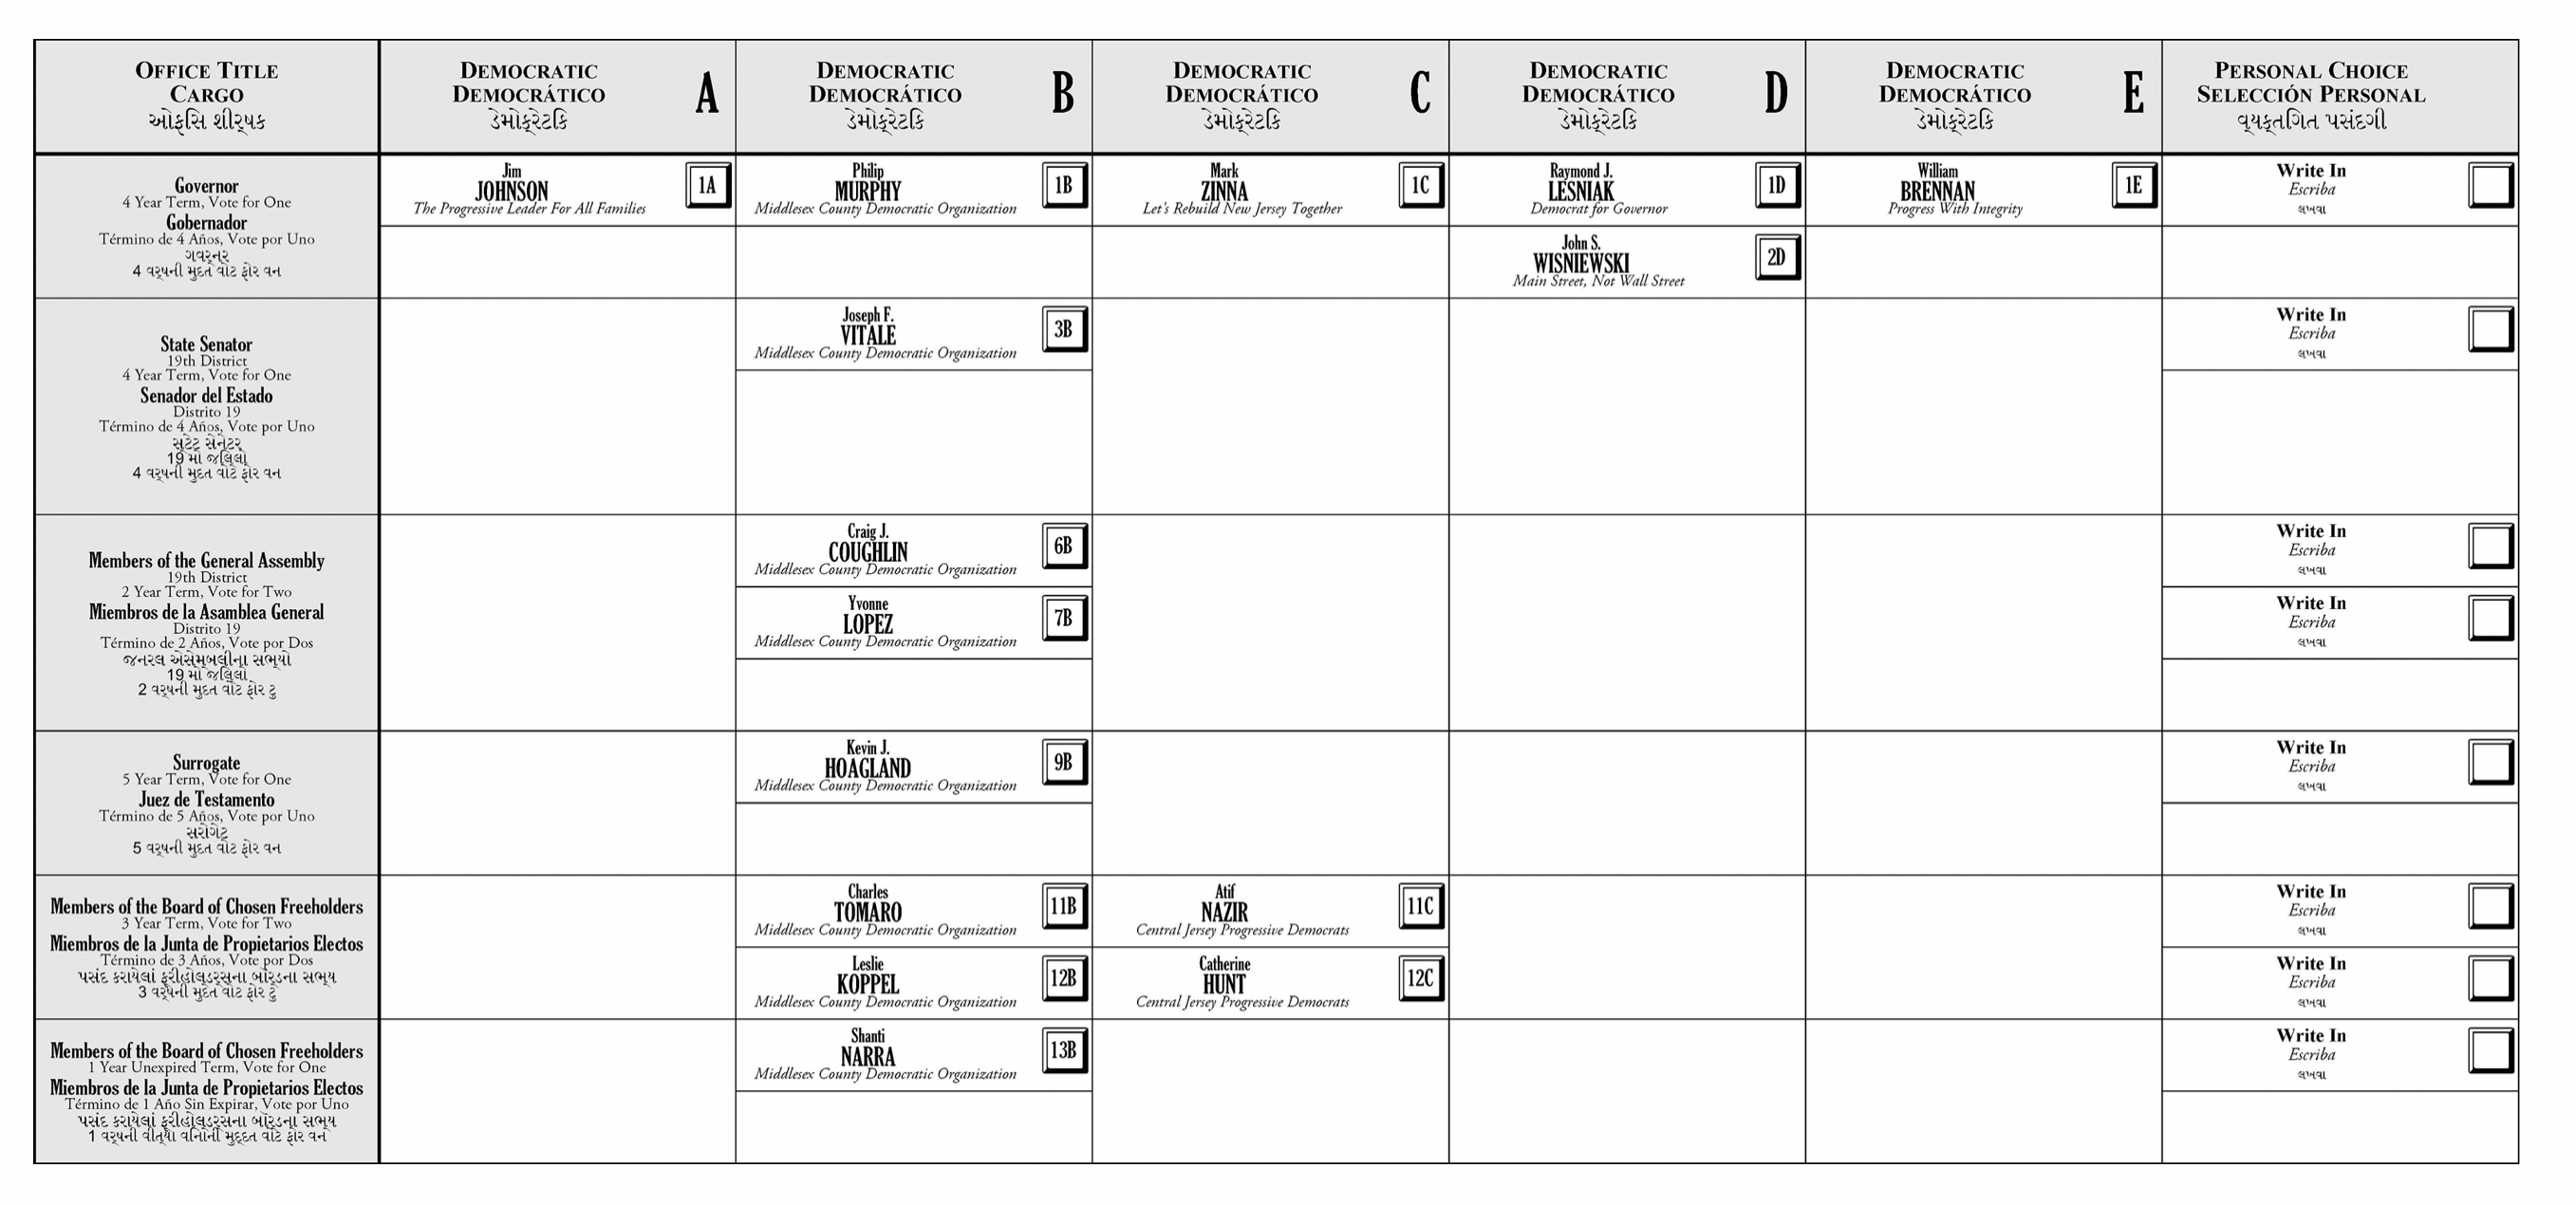
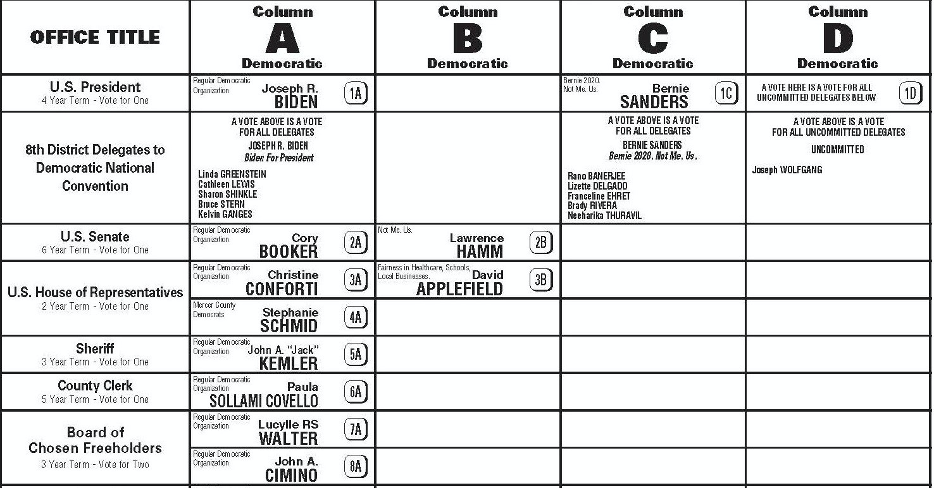 Figure 5: Mercer County 4th Congressional District 2020 Democratic primary ballot.
Conforti won Mercer County, receiving 57% of the vote. Schmid won Monmouth and Ocean Counties, receiving 70% and 77% of the vote, respectively. Conforti received 57% of the vote when she was first on the county line and 21% of the total vote in the two counties where Schmid was on the county line, a difference of 36 percentage points. Schmid received 72% of the total vote in Monmouth and Ocean Counties, where she was the only congressional candidate on the county lines, and 32% in Mercer, where her name appeared below Conforti’s — a difference of 40 percentage points (see Figure 6).
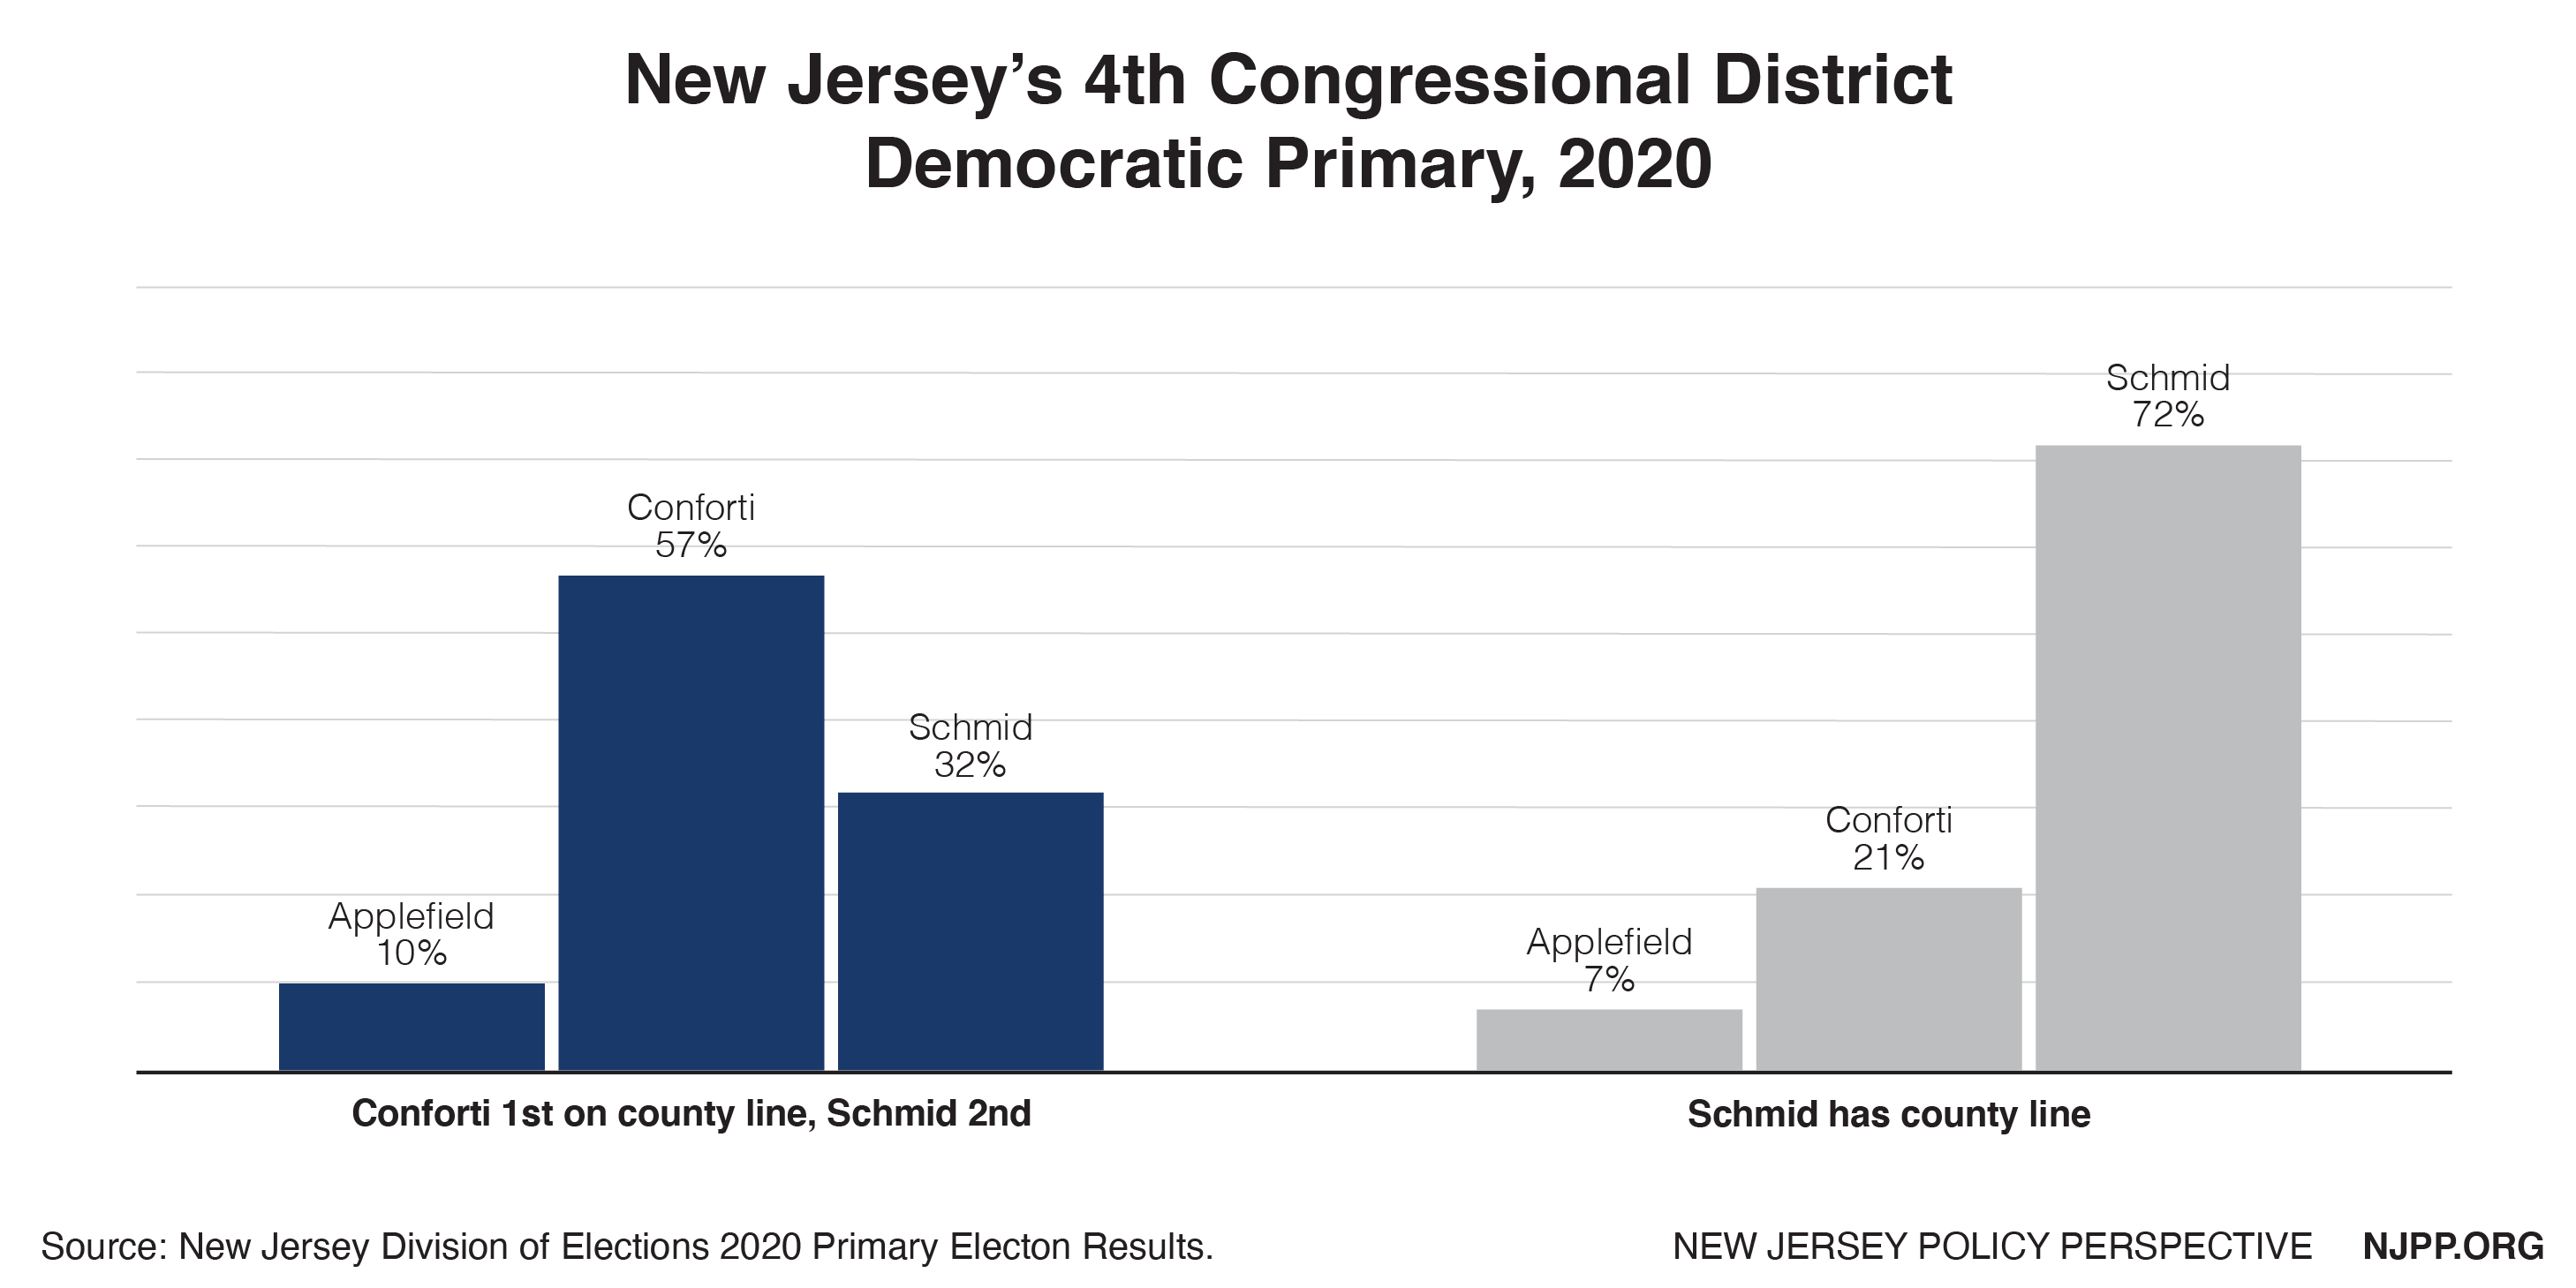 Figure 6: 4th Congressional District Democratic Primary.
Having two candidates on the line in Mercer County also confused voters, leading to a substantial overvote. More than 32% of those who voted in the 4th Congressional District’s Democratic primary for the House of Representatives selected both Conforti and Schmid, resulting in their votes being discarded. Neither Monmouth nor Ocean Counties experienced substantial overvotes, and the number of votes cast for the House of Representatives in both counties closely mirrored those for the U.S. Senate and President. The likely explanation for the Mercer overvotes is that voters, conditioned to select everyone on the county line, marked their ballots for both Conforti and Schmid rather than voting for just one of them, as the ballot instructed them to do.
5th Congressional District
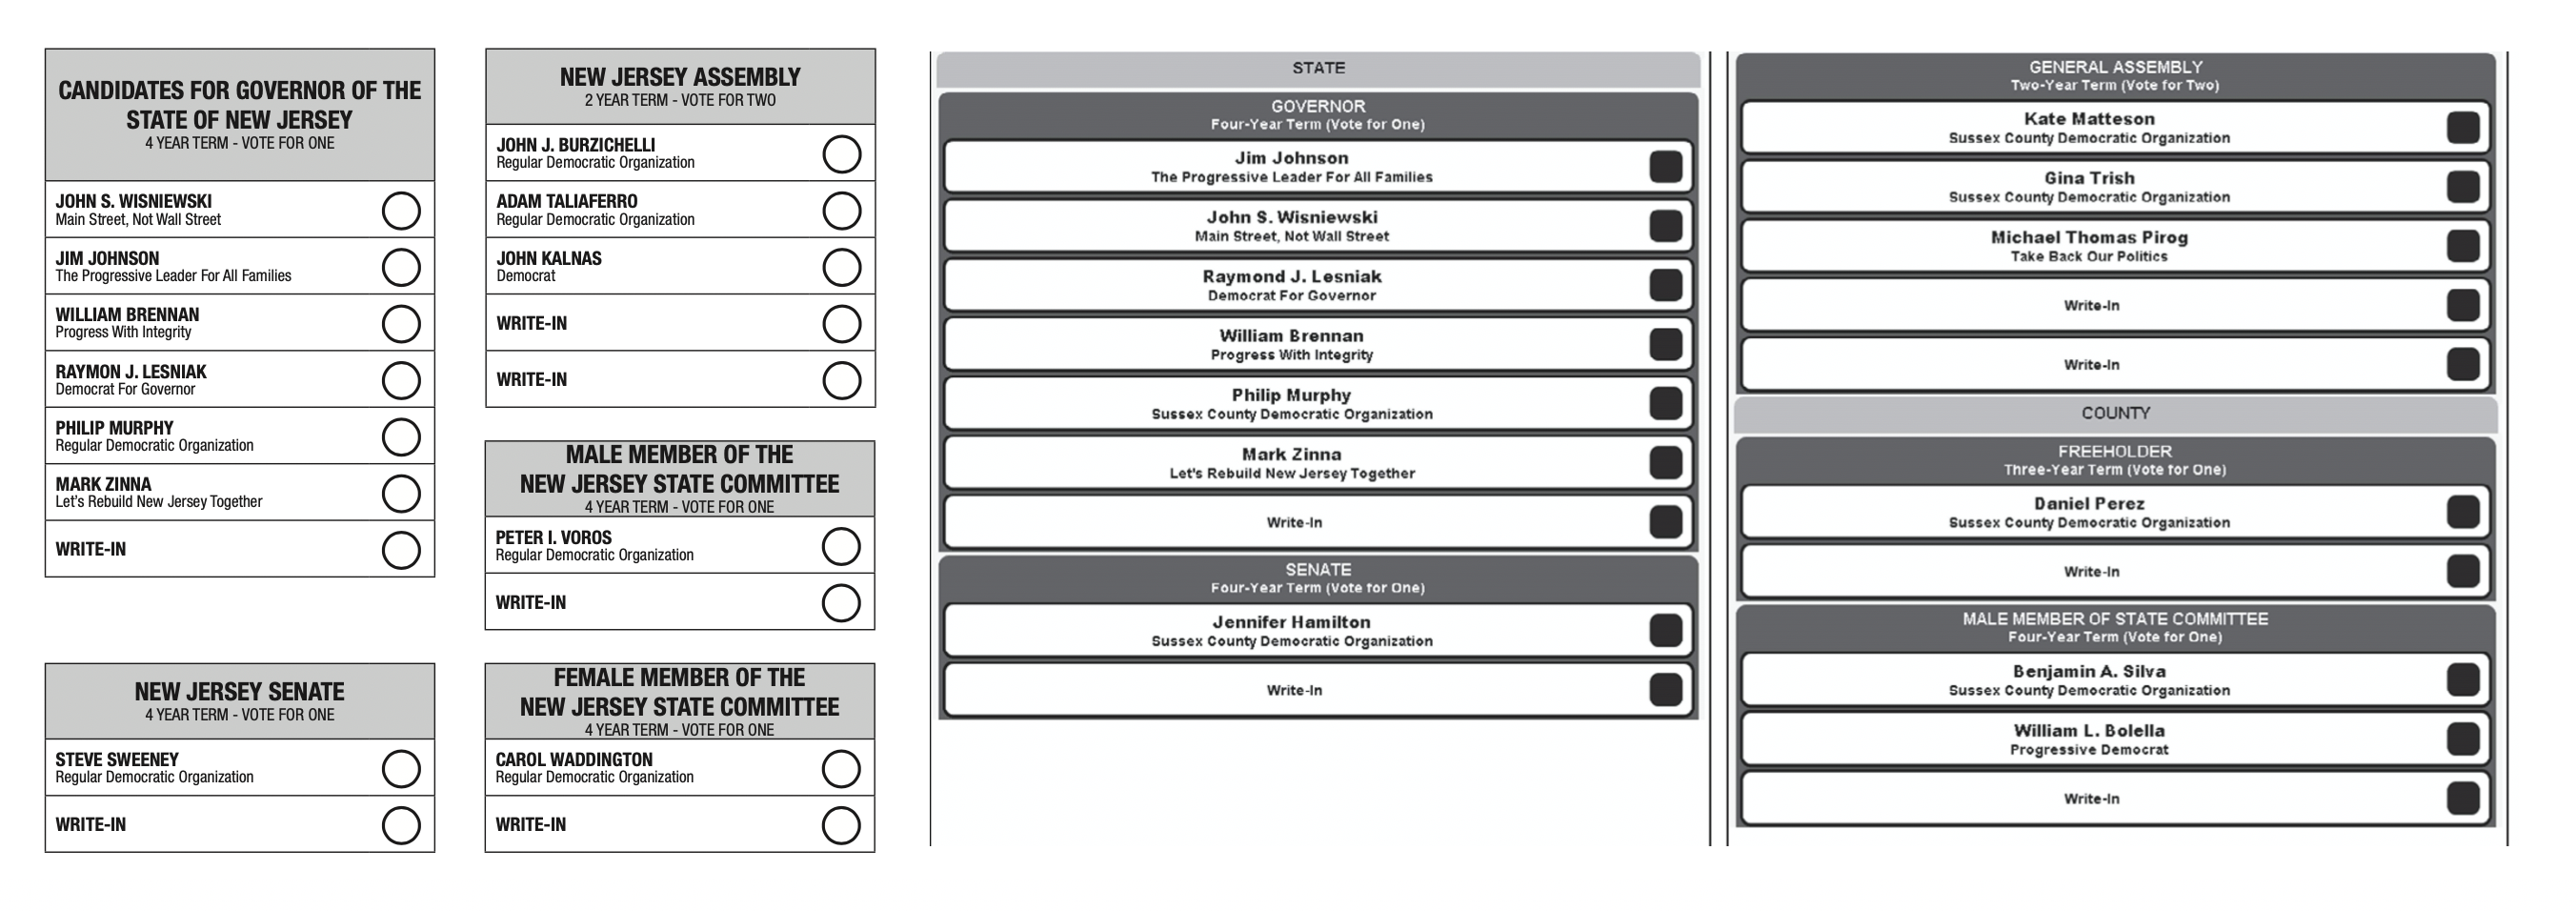
Congressperson Josh Gottheimer was endorsed by all four counties that make up the 5th Congressional District. Gottheimer received 67% of the votes in Bergen County, which structured its ballots around the county line, and 64% of the combined votes in Passaic, Sussex and Warren Counties, which did not use a county line, a difference of 3 percentage points (see Figure 7).
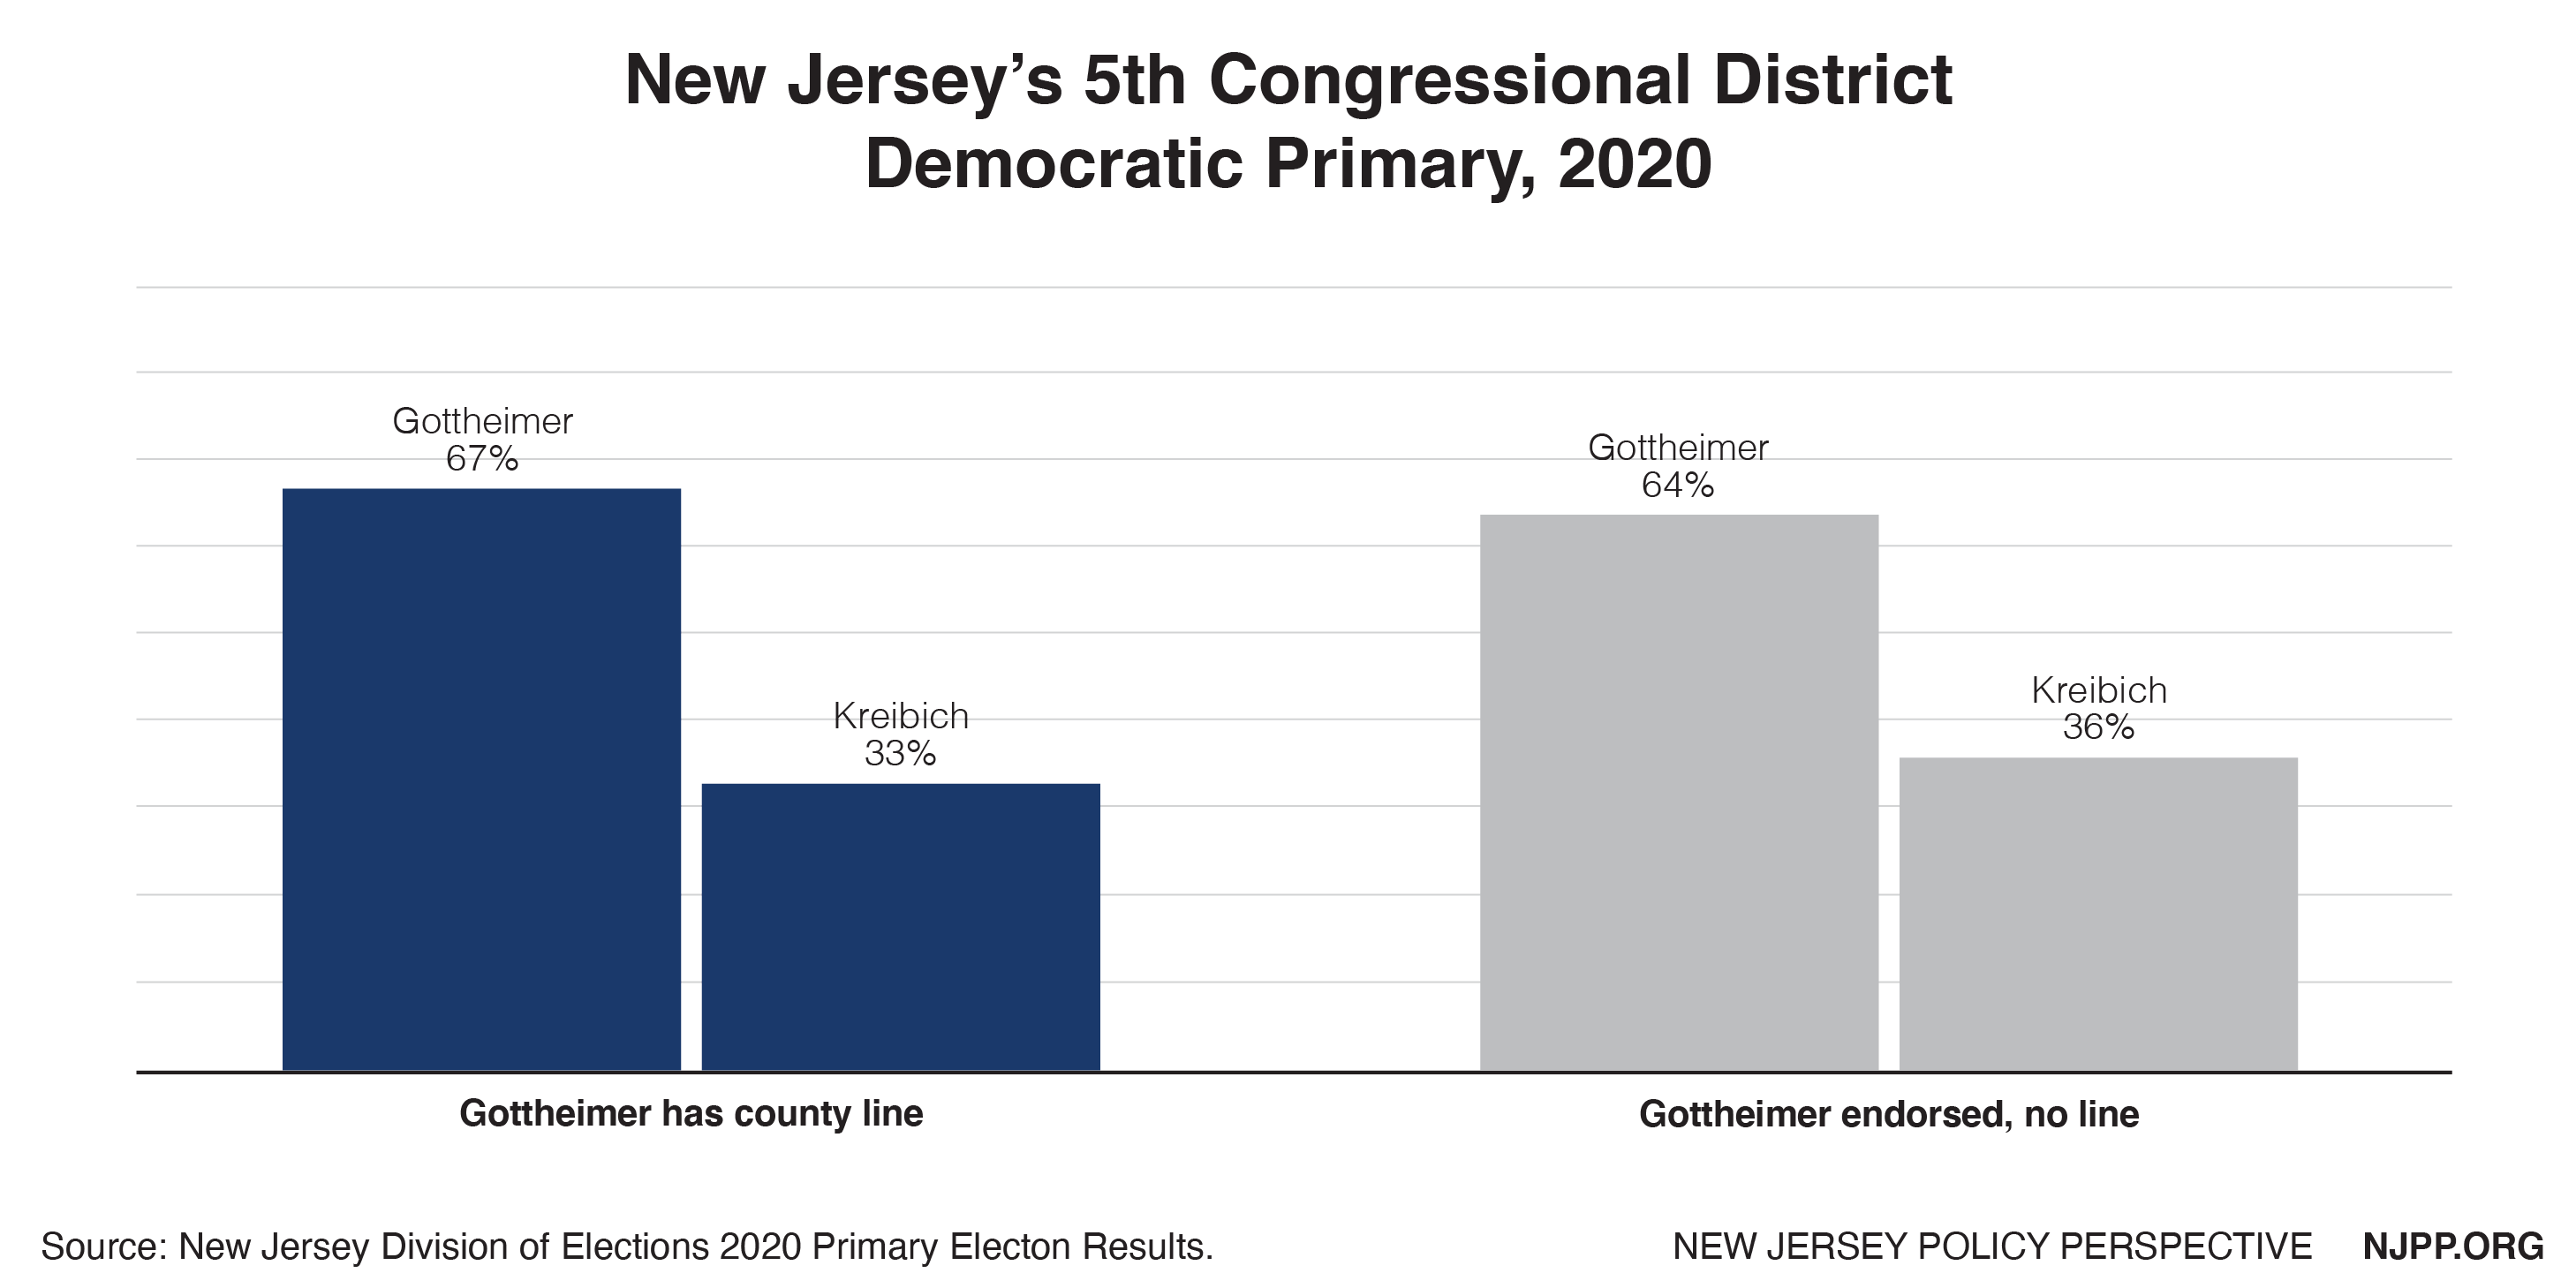 Figure 7: 5th Congressional District Democratic Primary.
9th Congressional District
Congressperson Bill Pascrell was endorsed by all three counties in the 9th Congressional District. Pascrell received 84% of the vote in Passaic County, which did not use the county line on its ballots, and 78% of the combined vote in Bergen and Hudson Counties, which used the county line (see Figure 8). Pascrell has consistently received a larger share of the vote in Passaic than in Bergen or Hudson Counties since he was first elected to represent the 9th Congressional District, following the 2010 redistricting. Pascrell’s 2020 primary performance is actually the lowest percentage of the Passaic vote that he has received in that decade.[6] It is also the only time during that decade that a majority of Passaic voters did not use a county line ballot.
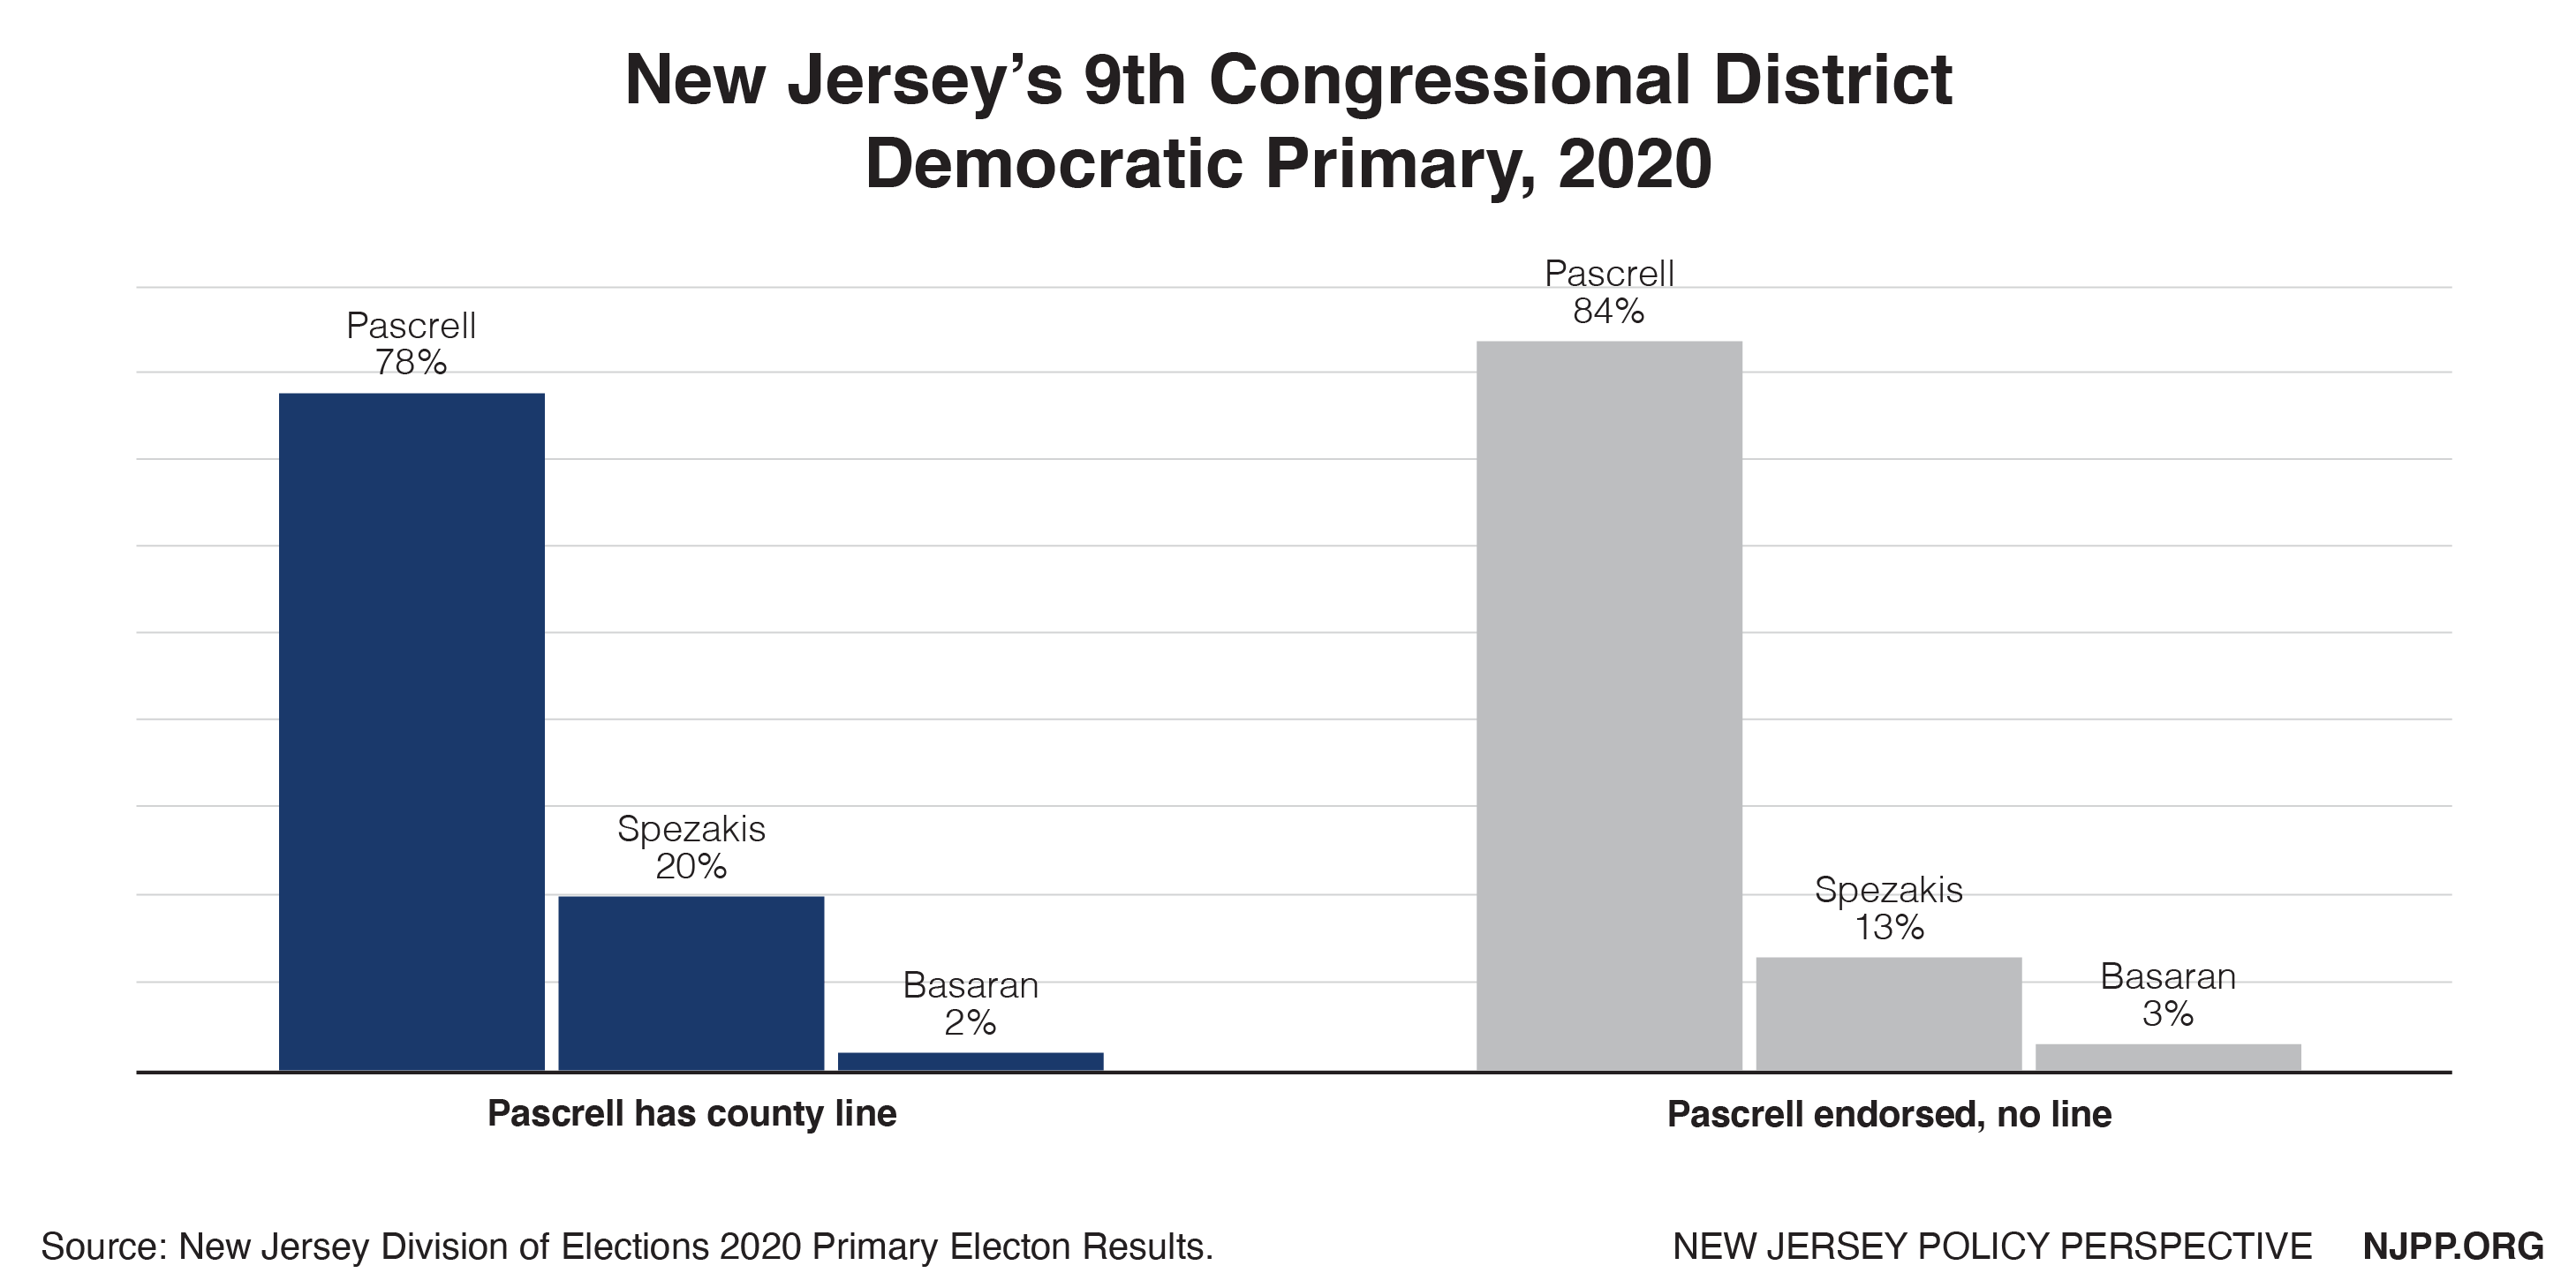 Figure 8: 9th Congressional District Democratic Primary.
U.S. Senate
Senator Cory Booker was endorsed by all 21 counties in the Democratic U.S. Senate primary. He received 88% of the combined vote in the fourteen counties where he was on the line, 86% of the combined vote in the five counties that did not use a county line, and 85% of the combined vote in the two counties that had a line but Senator Booker chose not to be on it (see Figure 9). Booker’s share of the vote ranged from 85% to 91% when he was on the line and from 84% to 88% when a county did not use a line. In the two counties where Booker chose not to be on the line, he received 81% of the vote in Atlantic County and 87% in Ocean County.
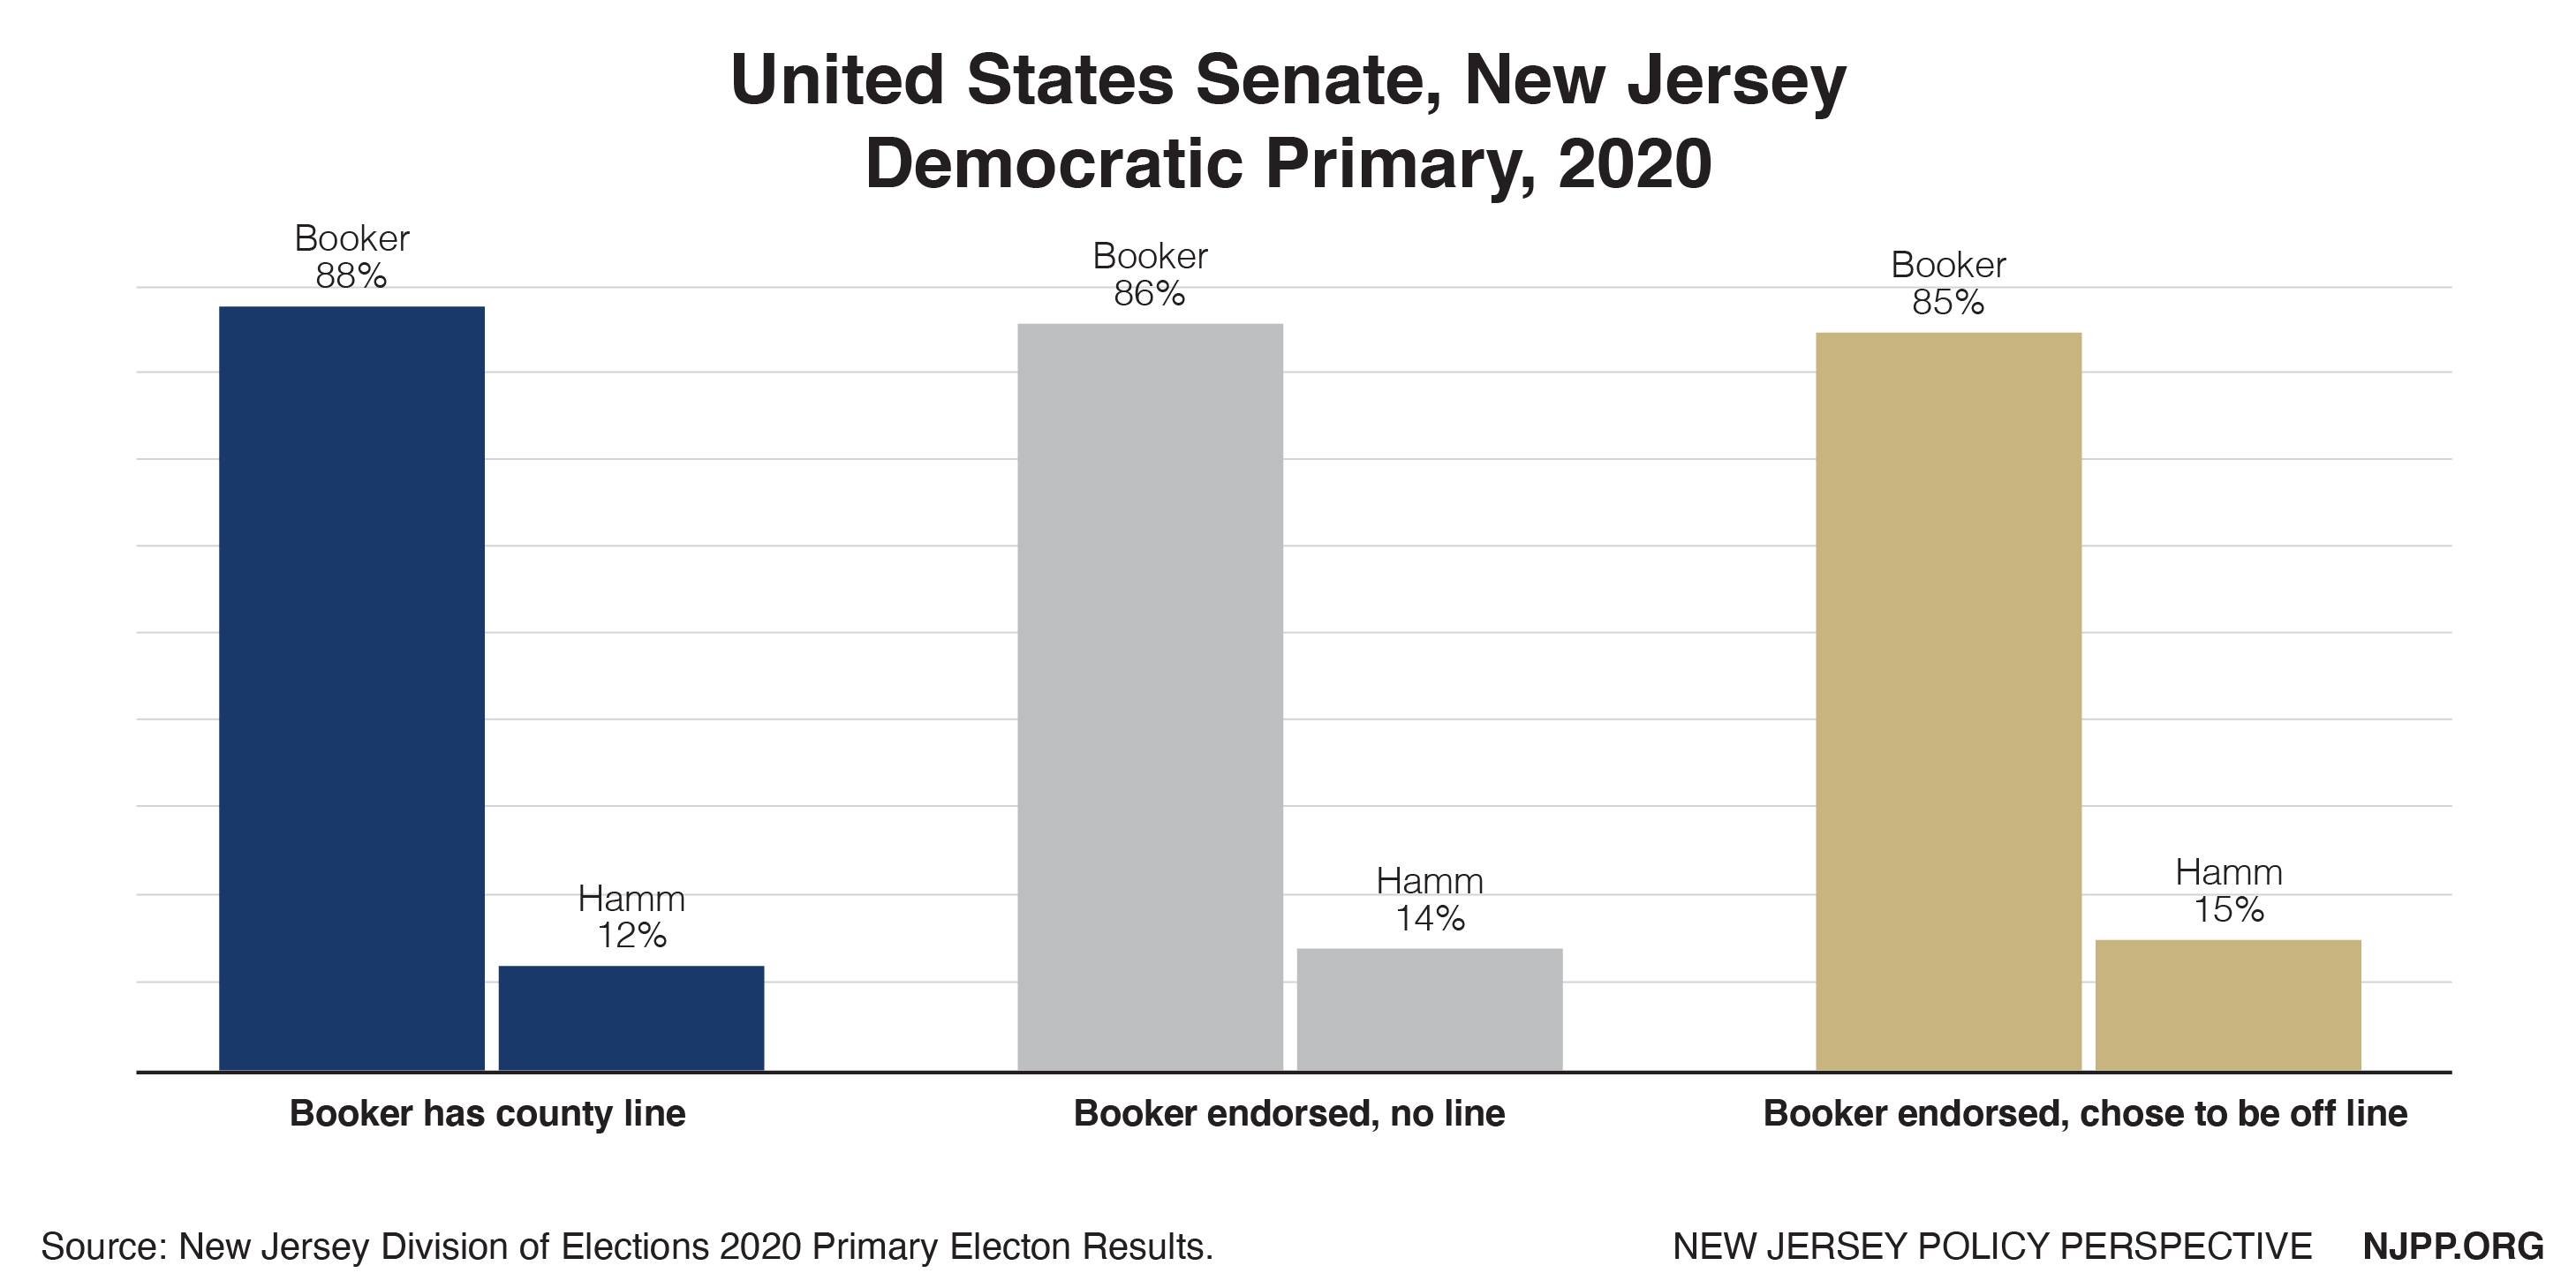 Figure 9: U.S. Senate Democratic Primary.
Republican Primaries
In the Republican primary, four congressional races and the U.S. Senate race were contested and included either counties that did not structure their primary ballots around a county line or county parties within the district endorsing different candidates. Being on the county line was associated with differences of more than ten percentage points in all five races and as much as 50 percentage points in the U.S. Senate race.
2nd Congressional District
In the 2nd Congressional District, Jeff Van Drew won the endorsement and the primary in all eight counties. He received 83% of the total vote in the seven counties that used the county line on their ballots and 70% of the vote in Salem County, which did not use the county line (see Figure 10).
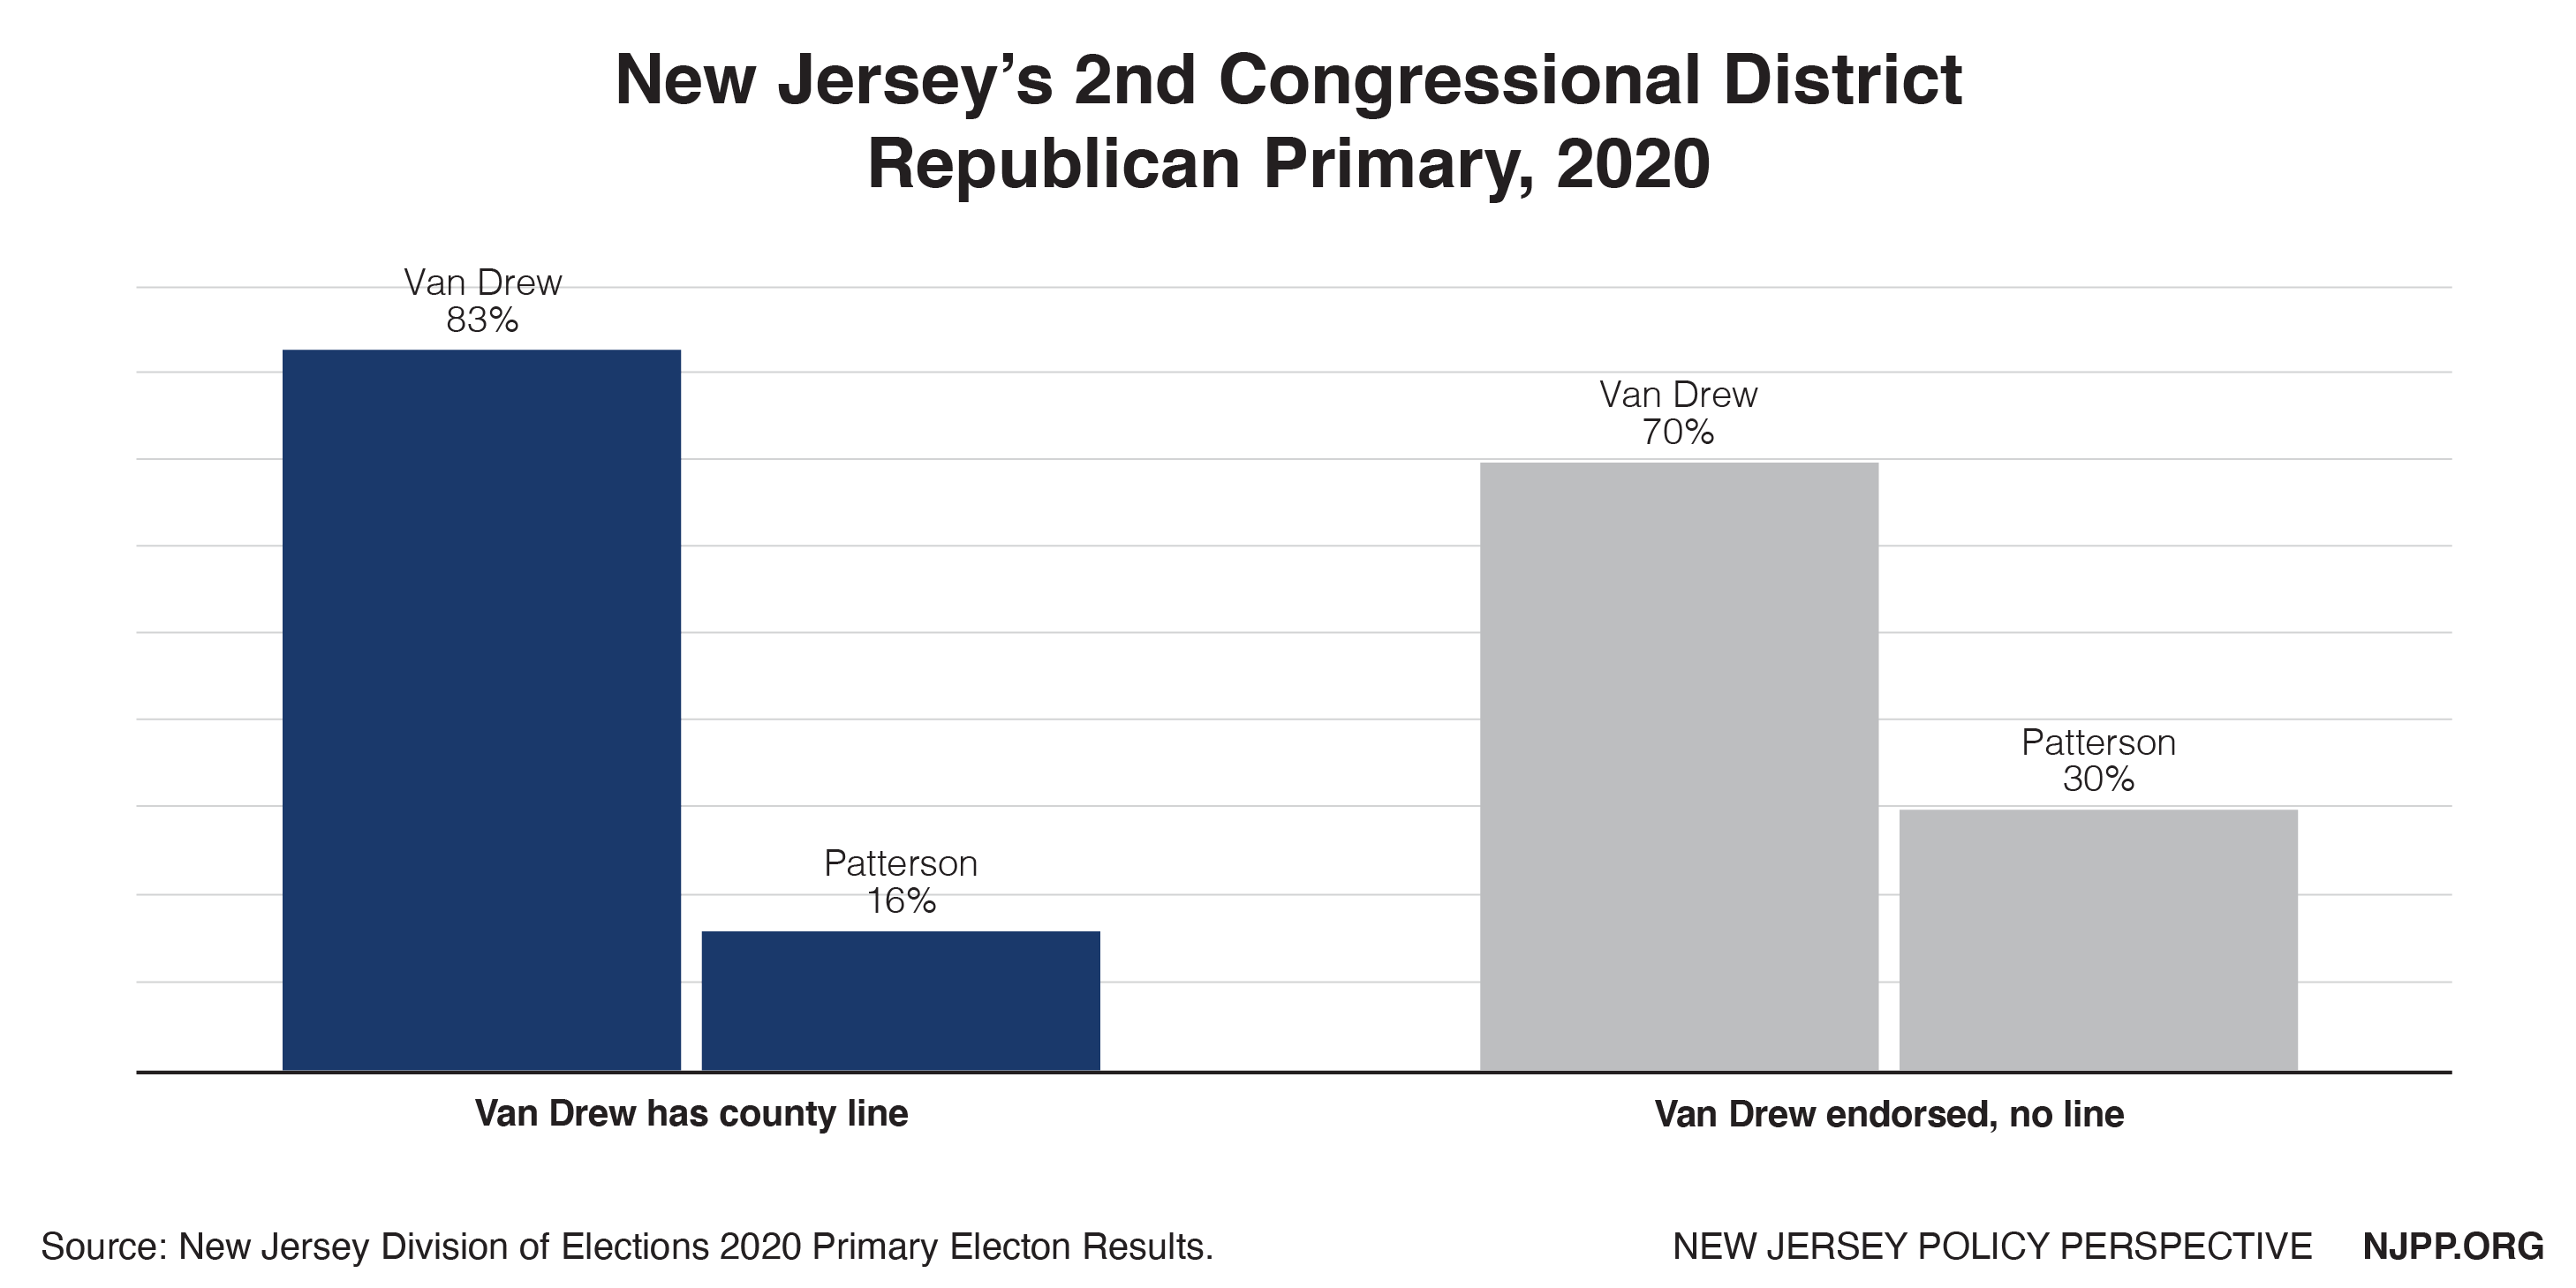 Figure 10: 2nd Congressional District Republican Primary.
3rd Congressional District
Two candidates vying for the Republican nomination in the 3rd Congressional District split the Republican party endorsements in the counties that make up that district. Kate Gibbs was endorsed and given the line by Burlington County and David Richter was endorsed and given the line by Ocean County. Gibbs received 56% of the vote when she was on the county line and 22% when she was not, for a difference of 34 percentage points. Richter received 78% of the vote when he was on the county line and 43% when he was not, for a difference of 35 percentage points (see Figure 11).
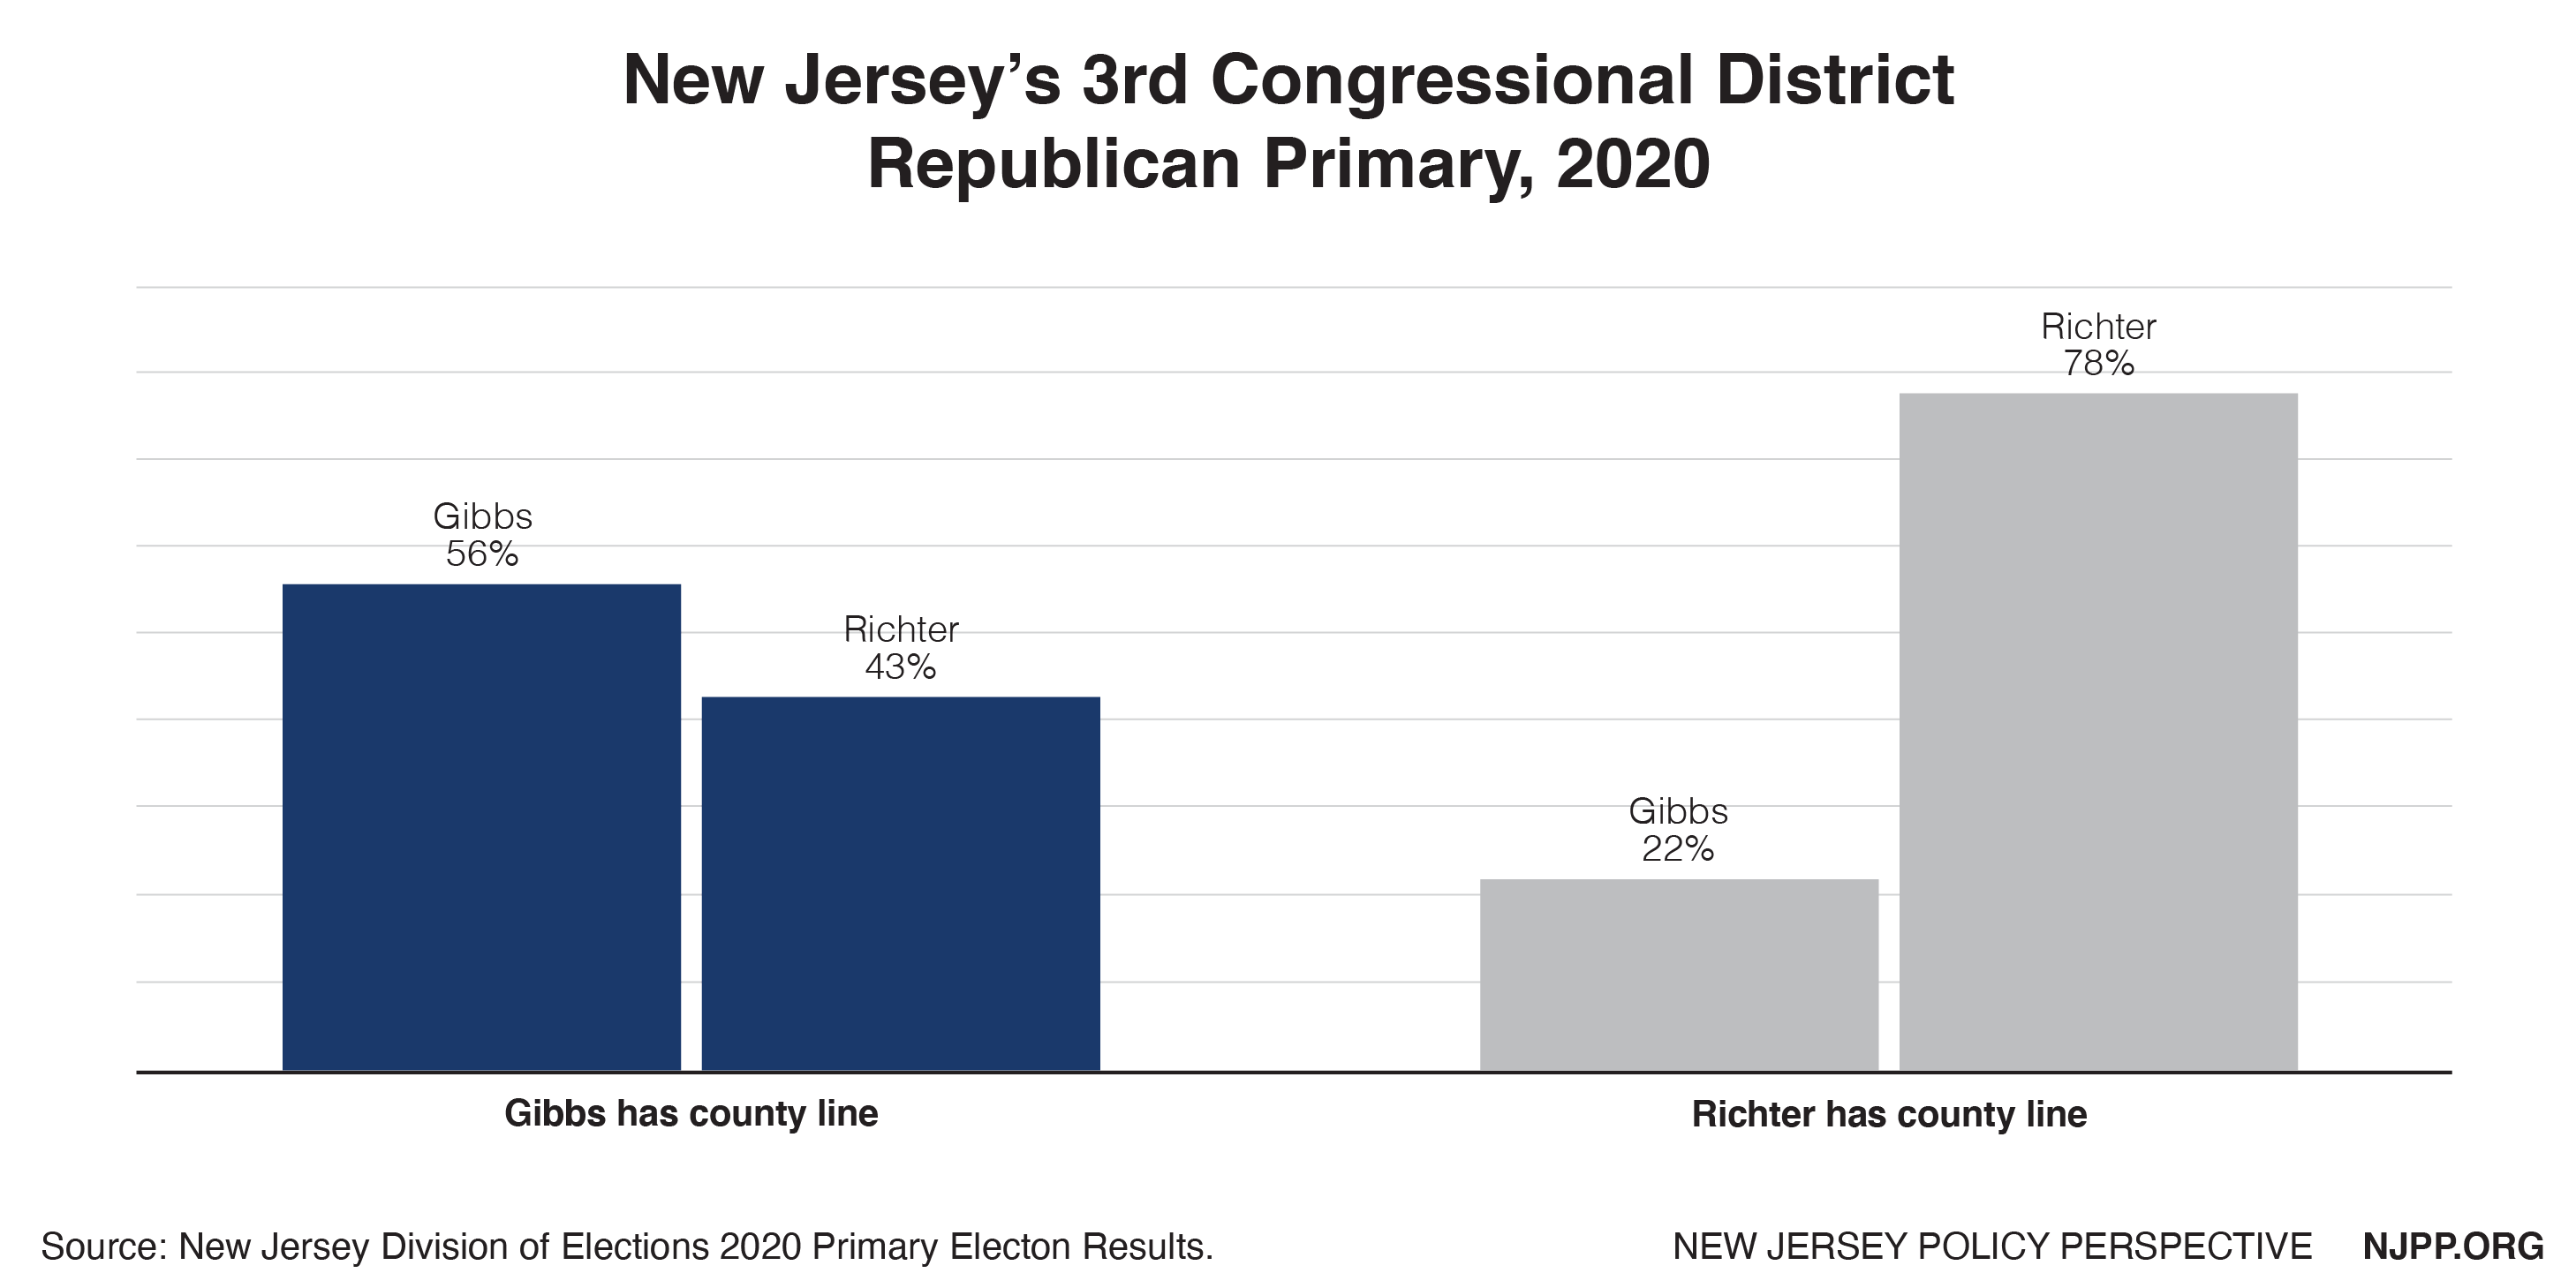 Figure 11: 3rd Congressional District Republican Primary.
5th Congressional District
Four candidates competed in the 5th Congressional District, with two splitting the endorsements. John McCann was endorsed and given the county line by Bergen County. Frank Pallotta was endorsed by Passaic, Sussex and Warren Counties, none of which used the county line. McCann won Bergen County, with 45% of the vote, while Pallotta won the three remaining counties, with 62% of the total vote.
McCann received 45% of the vote when he was on the county line and 18% of the total vote when Pallotta was endorsed but there was no county line, for a difference of 27 percentage points. Pallotta received 62% of the total vote when he was endorsed but there was no county line and 41% of the vote when McCann had the county line, for a difference of 21 percentage points.
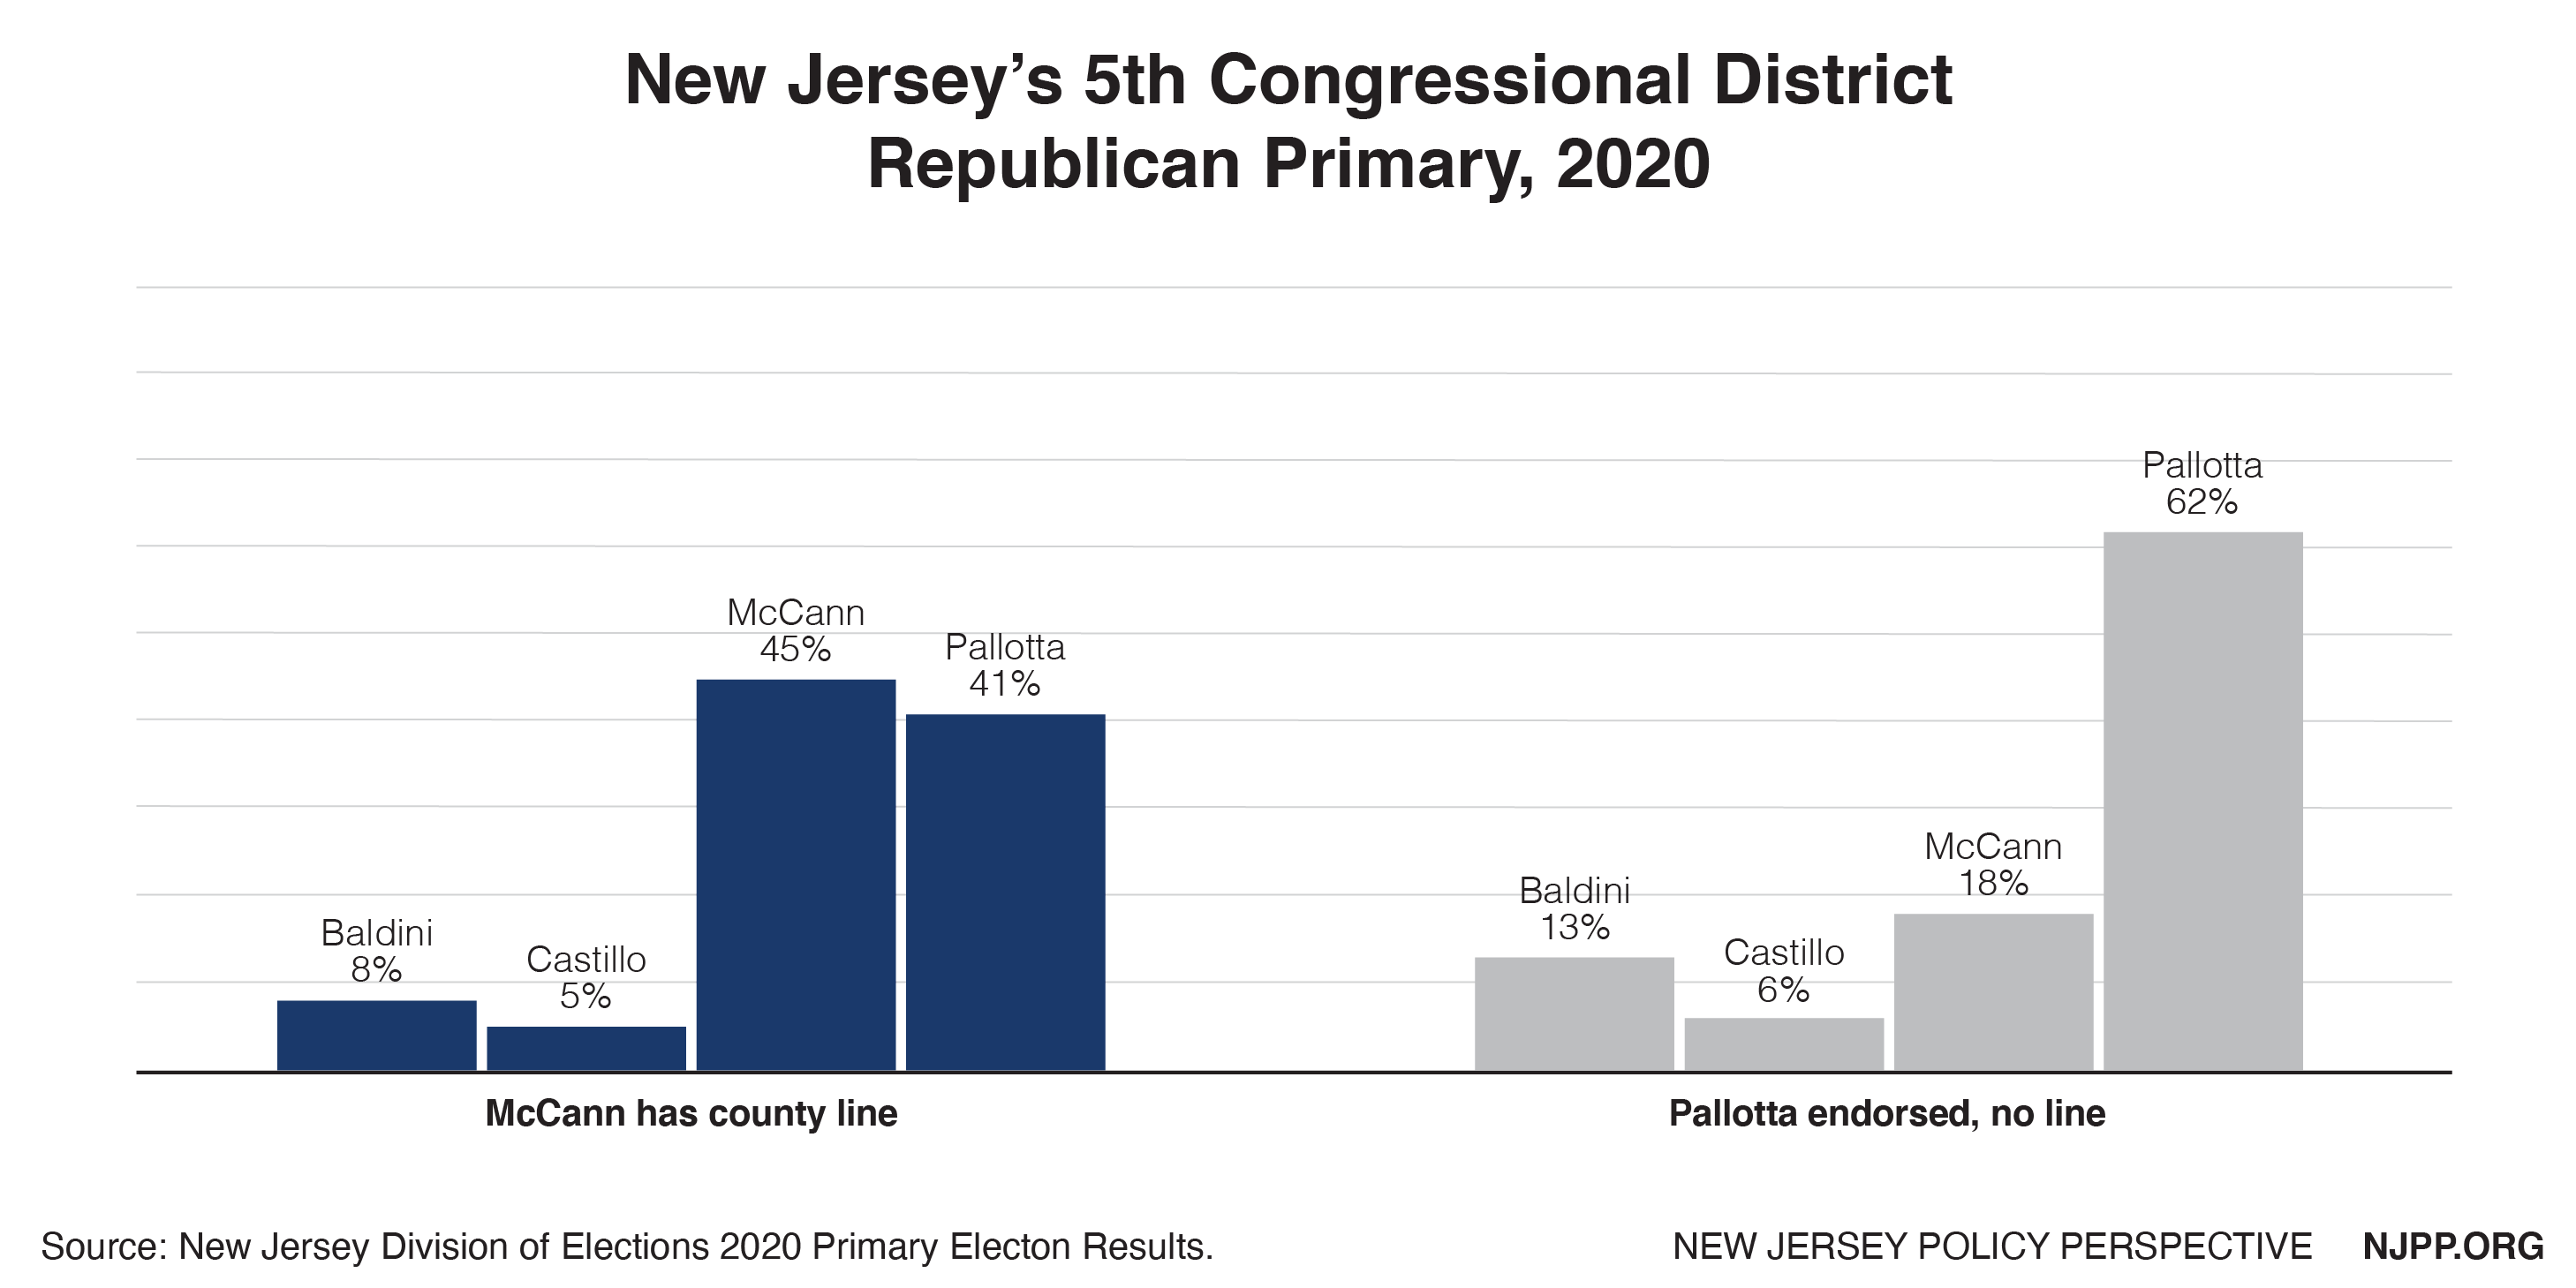 Figure 12: 5th Congressional District Republican Primary.
7th Congressional District
Three candidates competed in the 7th Congressional District race. Tom Kean Junior received the endorsement of the six counties that make up the district and won all of them. Three of those counties (Essex, Somerset and Union) structured their ballots around the county line and three (Hunterdon, Morris and Warren) did not. Kean received 86% of the total vote in Bergen, Somerset and Union, the three counties for which he had the line. He received 72% of the total vote in Hunterdon, Morris and Warren, the three two counties that did not use the line, for a difference of 14 percentage points.
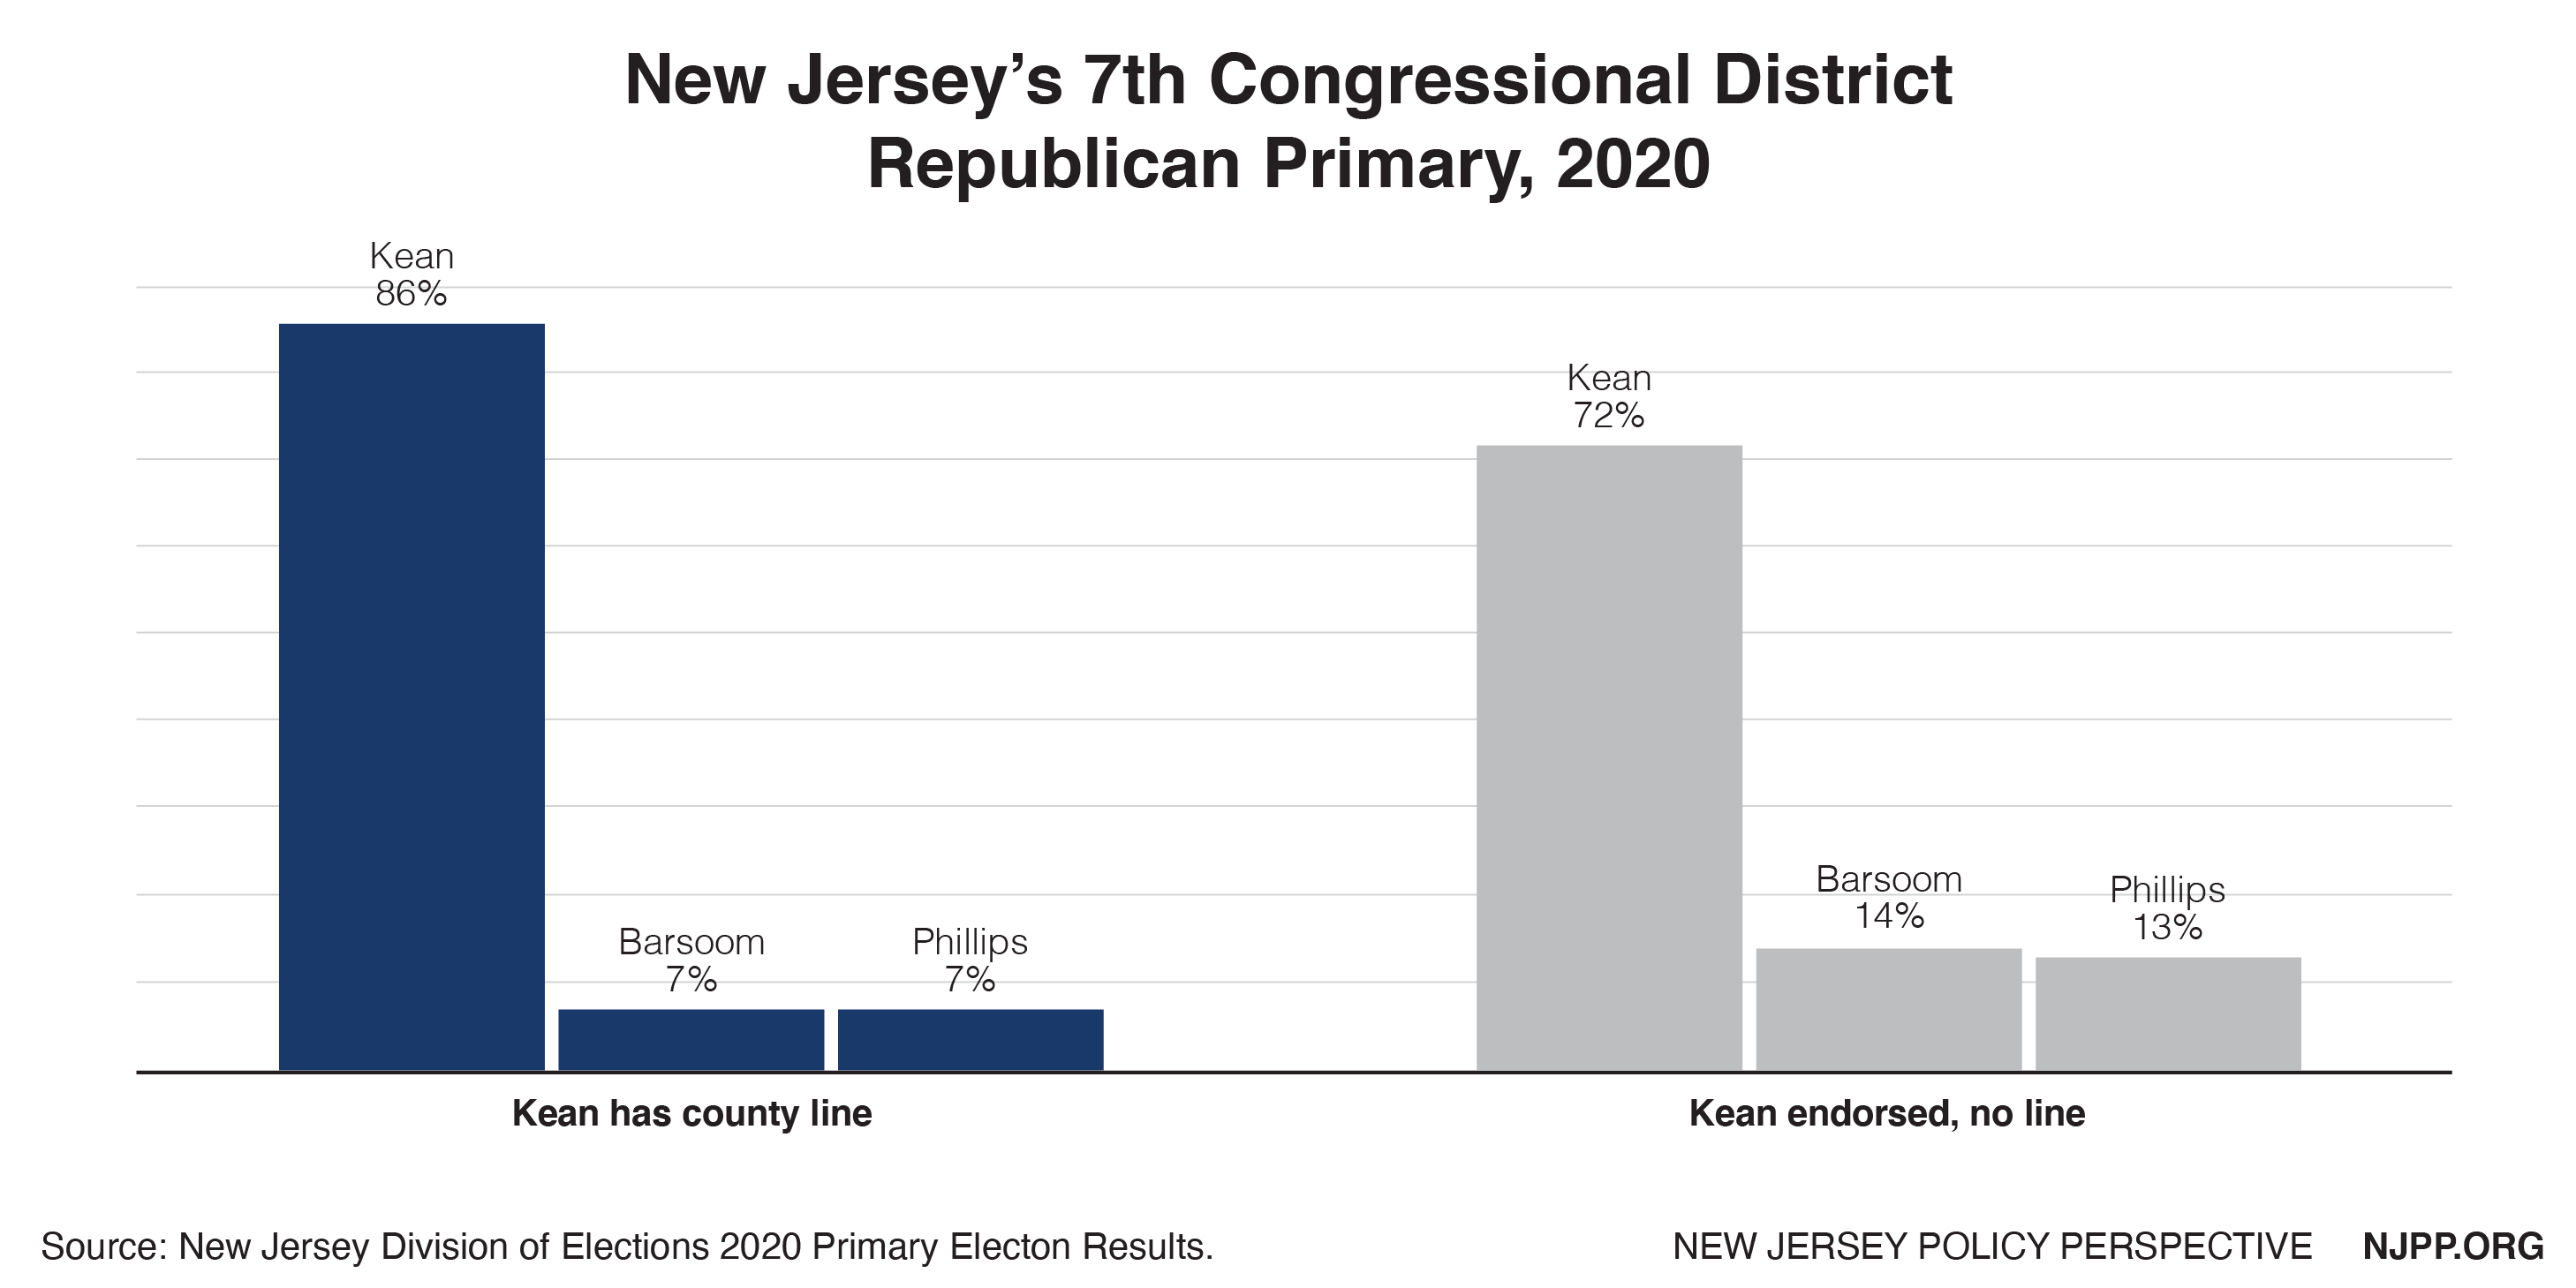 Figure 13: 7th Congressional District Republican Primary.
U.S. Senate
Five candidates competed for the Republican nomination in the U.S. Senate race, with two of them splitting the endorsements. Hirsh Singh was endorsed by four counties, all of which structured their ballots around the county line. Rikin Mehta was endorsed by seventeen counties, eleven of which structured their primary ballots around a county line.
Singh won the four counties in which he was on the line and Mehta won the eleven counties in which he was on the line. Singh received 73% of the total vote when he was on the county line and 23% when Mehta was on the county line, a difference of 50 percentage points. Mehta received 50% of the total vote when he was on the county line and 9% when Singh was on the county line, a difference of 41 percentage points.
Mehta received 35% of the total vote in the six counties that endorsed him but did not use a county line, a reduction of 15 percentage points relative to his performance on the line. Mehta also lost three of those six counties — losing Salem and Warren to Singh and Passaic to Flanagan.
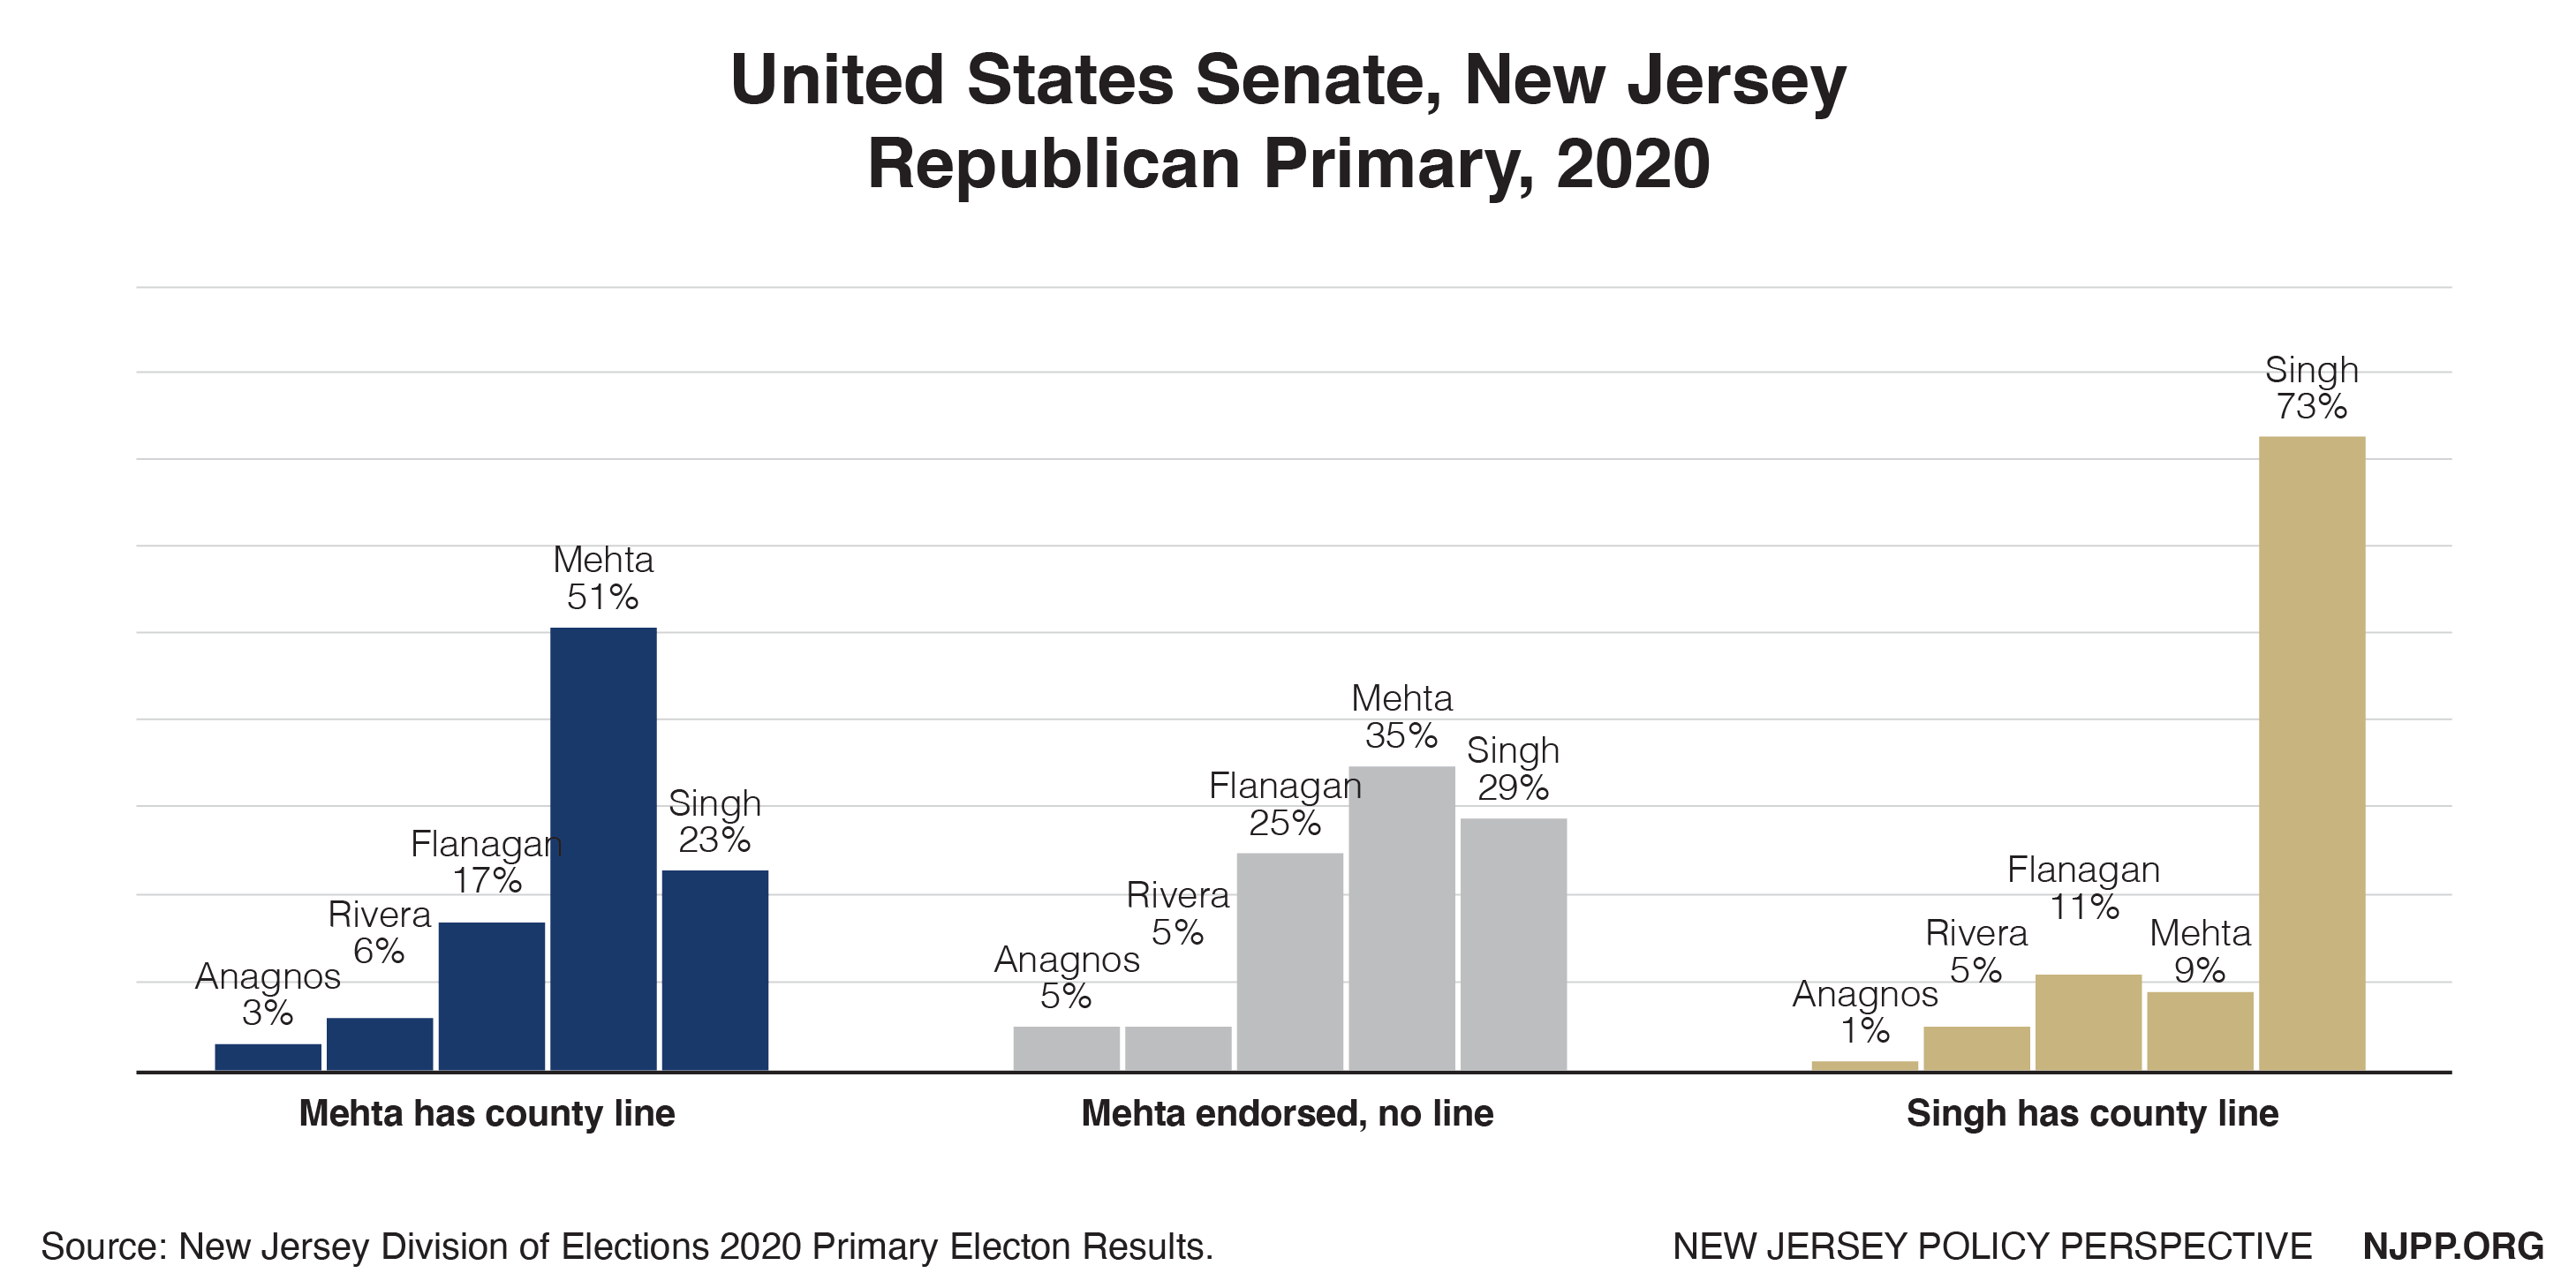 Figure 14: U.S. Senate Republican Primary.
Findings
These ten primary contests differ from each other in the counties they encompass, their ballot designs, and their levels of incumbency. This variability makes it challenging to generalize from any individual contest. However, the data does point to three overarching trends:
Being on the county line appears to provide candidates with an advantage.
Candidates performed better when they were included on the county line than when they were not, in nine of the ten contests. The most substantial difference in performance was in the four contests in which different candidates were on the county line in different counties in the same congressional district (see Figure 15). In those four contests, the average vote margin between appearing on the county line and having your opponent on the county line was 35 percentage points.
The only contest in which a candidate did not perform better when on the county line was the Democratic primary in the ninth Congressional District. In that race, Congressperson Bill Pascrell received a higher percentage of the vote in Passaic County, which did not use a county line ballot, than he did in Bergen and Hudson Counties, which used county line ballots. However, the 84% of the vote that Pascrell received in Passaic County was his worst performance in that County since he began representing the ninth Congressional District in 2012. This is also the only primary during that decade for which the ballots used by the majority of Passaic’s voters were not structured around a county line.
Incumbents appear to receive a smaller advantage from the county line than non-incumbents.
These ten primaries do not allow for a comparison of how incumbents perform on the county line versus non-incumbents on a different county line, as incumbents received all the endorsements for which they were eligible. However, there were four races in which incumbents were on the county line in some counties but not in others, and two such races for non-incumbents. The advantage from being on the county line in those contests was an average of three percentage points for incumbents and fifteen percentage points for non-incumbents.
County line ballots appeared to contribute to voter confusion, resulting in substantial overvotes and undervotes.
This pattern is evident in both the Democratic CD2 primary, in which almost 20% of voters did not cast a vote for the U.S. Senate, and in the Democratic CD4 primary, in which more than 32% of the voters selected too many candidates for the House of Representatives. In both cases, the disenfranchisement of large numbers of voters is likely the result of the county line. In CD2, Cory Booker’s decision to bracket off-line may have led to voters not realizing the county line did not include a Senate candidate or not knowing that they could vote for candidates not on the county line. In CD4, the inclusion of two candidates for the House of Representatives on the county line led to almost a third of those who voted selecting both candidates and disqualifying their votes. These examples strongly suggest that New Jersey primary voters are conditioned to vote the county line and highlight how powerful the county line is in shaping voter behavior.
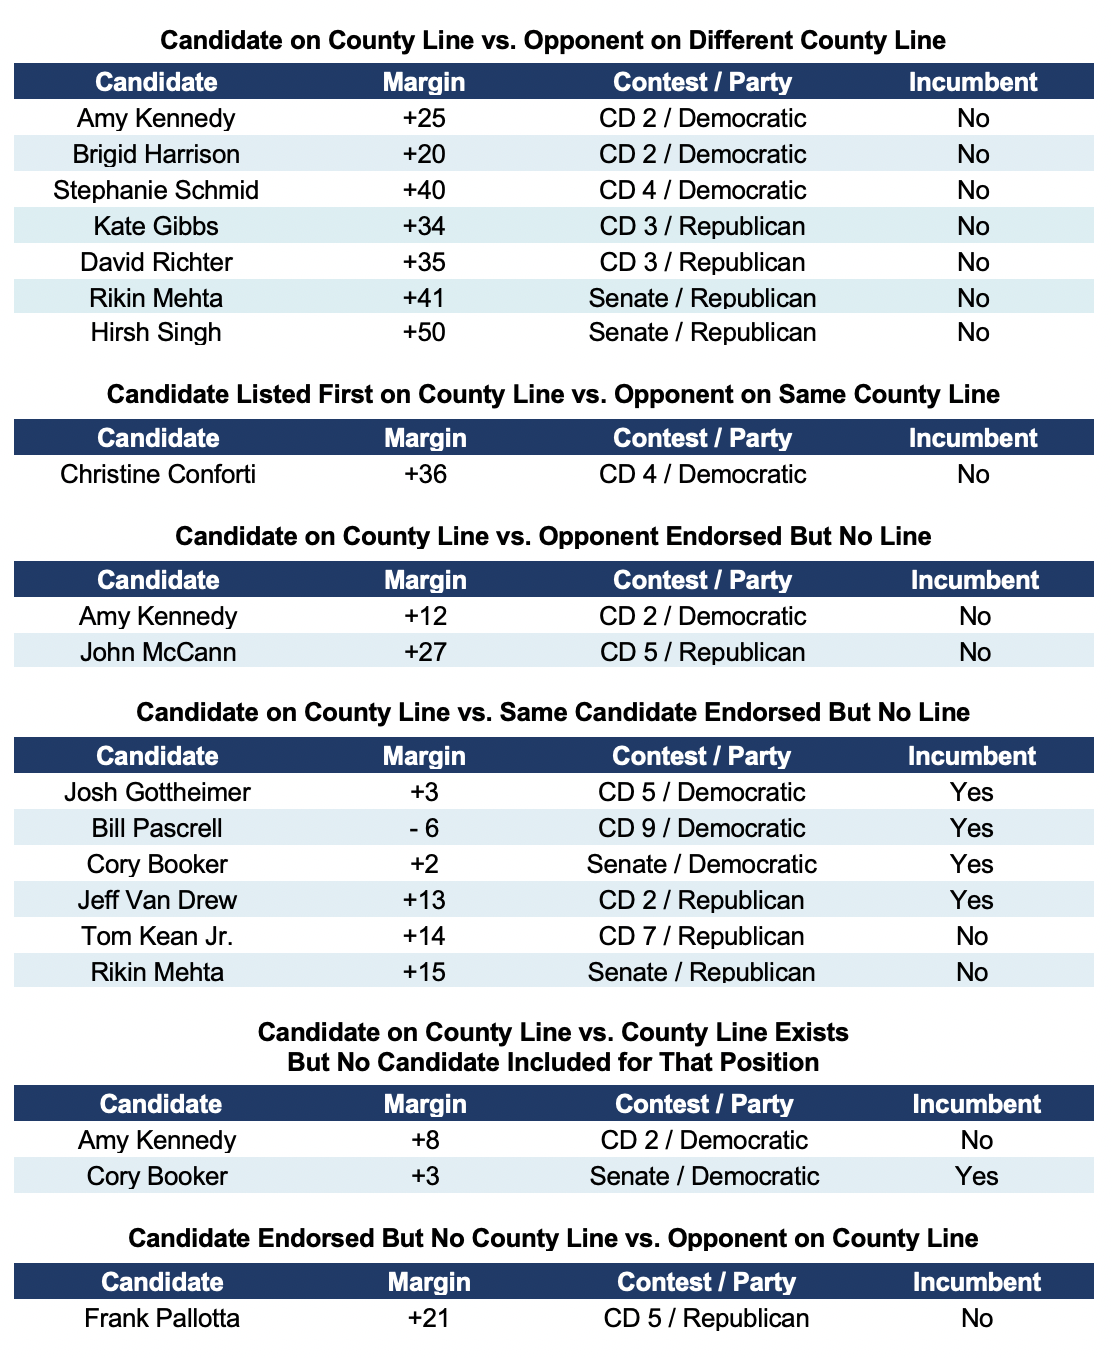 Figure 15: Impact of the county line.
End Notes
[1] Julia Sass Rubin (2020). Toeing the Line: New Jersey Primary Ballots Enable Party Insiders to Pick Winners. NJ Policy Perspectives. June. https://njppprevious.wpengine.com/reports/toeing-the-line-new-jersey-primary-ballots-enable-party-insiders-to-pick-winners
[2] Andrea Cordova McCadney, Lawrence Norden and Whitney Quesenbery (2020, February 3) Common Ballot Design Flaws and How to Fix Them, The Brennan Center. https://www.brennancenter.org/our-work/research- reports/common-ballot-design-flaws-and-how-fix-them
[3] Francisco Diez, The Likely Advantages of the Line, Communication Workers of America analysis, July 29, 2019.
[4] In 2012, incumbent Congressperson Steve Rothman was defeated by incumbent Congressperson Bill Pascrell in the 9th Congressional District primary, after Rothman’s district was eliminated following redistricting. Rothman and Pascrell split endorsements, with Rothman endorsed and on the county line in Bergen and Hudson and Pascrell endorsed and on the county line in Passaic. The turnout in Passaic substantially exceeded that of the two other counties and Pascrell received 90% of that vote, giving him the victory. In 1972, incumbent Congressperson Cornelius E. Gallagher was defeated by incumbent Congressperson Dominick Daniels, after being redistricted from the 13th to the 14thCongressional district. The district was located in Hudson County and the Hudson Democratic party endorsed Daniels in the primary.
[5] Salem and Sussex Counties do not structure their ballots around the county line for either Democratic or Republican primaries and Morris County does not structure its ballots around the county line for the Republican primaries.
[6] In 2012, Pascrell received 90% of the vote in Passaic versus 27% and 26% in Bergen and Hudson Counties, respectively, both of which endorsed his challenger. Pascrell did not have a primary challenger in 2014 or 2016. In 2018, he received 88% of the primary vote in Passaic County versus 70% in Bergen and 81% in Hudson Counties. Pascrell has been an elected official in Passaic County for forty years.