New Law Preserves Anti-Democratic Ballot Design

Earlier today, Governor Murphy signed into law A5116/S4142, which would modify the design of New Jersey’s primary ballots. The bill is a partial response to a federal judge’s 2024 decision that found most of the state’s previous primary ballots unconstitutional. However, the bill perpetuates harmful visual cues by recreating the previous bracketing system, grouping candidates together based on shared slogans. New Jersey Policy Perspective (NJPP) had joined more than 75 groups in calling for the governor to conditionally veto the bill, but with the governor’s signature today, the bill has become law without modification.

In response, NJPP issues the following statement:

Nicole Rodriguez, President, NJPP: 

“NJPP has long advocated for fair ballots, with research showing the damaging anti-democratic effects of the ‘county line’ and other visual cues on the physical ballot, which steer voters toward certain candidates and away from others. The end of the county line is undoubtedly a monumental achievement by democracy advocates from across the political spectrum. But by continuing these harmful practices, including grouping candidates together in all but name, this compromise represents a missed opportunity for the state to implement the clean office block ballot design, which is standard in almost all other states.”

Read NJPP’s research on the harmful effects of the Line.

 ###

New Jersey’s Ballot Design Should Prioritize Transparency, Fairness, and Accessibility

New Jersey Policy Perspective (NJPP), a statewide nonpartisan nonprofit think tank focused on economic, social and racial justice, has long advocated for fair ballots in the state, including multiple reports on the harmful influence of the “county line” on primary election choices.

I broadly ask you to build a ballot that applies best practices and does not allow for any visual advantage, either in terms of order, position, highlighting, font, or other visual cues.

1. Any ballot design process must include as much of the public as possible.

When a committee focused on ballot design sets last-minute meeting times at difficult times for members of the public to attend, the committee is leaving out members of the public, particularly lower-information voters, whose understanding of the ballot is most important for the committee to hear. It is impossible to design effective ballots without clear public feedback on what confusion and concerns they have about ballot design.

NJPP urges more notice, more convenient meeting times, and more public feedback, not less.

2. New Jersey should move towards clean, office-block ballots with minimal visual cues that give an advantage to any candidate over any other.

New Jersey should follow the principles of the opinion in the Hanlon case, as well as best practices of national ballot design experts. The vast majority of states use an office-block design with minimal visual cues to indicate endorsement or incumbency.

Allowing any highlighting, asterisks, endorsements, placement, bracketing, incumbency markings, or other visual cues that signal that one candidate is special over any other creates a risk of unfair balloting. Randomized electronic draws can prevent placement-order advantages.

3. There is more to good ballot design than office-block balloting; this committee should ensure the state’s ballot reflects other best practices.

If New Jersey means to revamp its ballot design to provide for fairness and reduce confusion among voters, it should adhere to ballot design best practices advanced by civic engagement experts. As an example, New Jersey counties frequently use all-caps to indicate candidate names and as emphasis throughout the instructions, even though they make word shapes harder to recognize and lead to lower comprehension. Similarly, many New Jersey ballots use centered type, even though left-justified type is more legible. Instructions are often nonstandard and do not include visual cues.

Ballot design should also reflect the diverse array of voters in New Jersey, including voters who are blind, deaf or hard of hearing, or otherwise have a disability; voters with limited English proficiency; voters with low literacy levels; voters who may require assistance in filling out their ballots; etc. User testing should include all of these voter groups.

If the concern of the committee is to reduce confusion by voters, any attempt to redesign New Jersey’s ballots must incorporate these best practices, rather than exclusively focus on the questions of slogans, bracketing, and other indicators that potentially give advantages to one candidate.

Dark Day for Transparency and Accountability as Governor Signs Bill Gutting Public Records Law

Earlier today, Governor Murphy signed a bill that would gut New Jersey’s public records law, making it harder for the public to access data, records, and documents that their state and local governments produce. Despite being opposed by nearly all public testimony and 81 percent of the public in polling, this law will now make it easier for governments to deny records requests, impose costs on requestors, and escape accountability for unlawful denials. In response, New Jersey Policy Perspective (NJPP) issues the following statement.

Nicole Rodriguez, President, NJPP:

“This law is bad policy, bad politics, and bad news for anyone who believes that government should work for the people and not for special interests. Public records are how we shine a spotlight on corruption and hold officials accountable when they’re not doing what’s best for their communities. New Jersey just took a big step forward with our first primary election without ‘the line’ on the ballot, and now the state is taking two even bigger steps backward. This is a dark day for transparency, accountability, and democracy in New Jersey.”

# # #

The Open Public Records Act (OPRA) Ensures Government Transparency and Accountability

Good Morning Chair Karabinchak and members of the committee. Thank you for the opportunity to testify today.

The bill as currently drafted would gut the public’s access to records that are generated by public dollars by public employees. Rather than support the public’s access, this bill instead erects more obstacles to public access and removes protections that make it possible to combat erroneous denials.

Government records are generated by and for the public. To ensure transparency and accountability for government activity, the public can and should be able to access those records. The entire purpose of the Open Public Records Act (OPRA) is to expand and improve public access.

As a research organization, NJPP frequently puts together its reports using public data that it requests from public agencies. Public health data, budget data, and meeting minutes are critical components of understanding how government priorities are set. And as agencies put less and less information on public websites, OPRA has become one of the only ways to obtain this information. As an example, NJPP had to use OPRA to request documents such as:

  • Preschool attendance data
  • NJ Transit budgets and meeting minutes
  • Local law enforcement budgets


Already many requests are subject to unexplained delays and erroneous denials. This bill would create even more red tape for requestors and limit access to specialized researchers or moneyed special interests, rather than members of the general public.

Below are just a selection of the different ways in which this bill would harm transparency and the right of the public to understand what it is that government officials and employees are doing with public money and public trust, but at this juncture, I simply urge the committee to vote NO on this bill. No set of amendments can improve what is a tear-down of the entire concept of open records.

Almost every provision in the bill harms public transparency:

  • Expands exemptions:
    • Exempts whole categories of public records: Because of obscure data-keeping policies, members of the public frequently cannot request data because they don’t know what data exists. What email communication occurred, when calls took place, what date a PDF was created – these are critical data for understanding how government decisions are made, especially as more records become electronic.
    • Creates catch-all exemption for anything that may or might lead to disclosure of personal information or harassment: Placing new exemptions for information that “might reasonably lead” to disclosure of personal information and information that the agency “has reason to believe . . . may result in harassment, unwanted solicitation, identity theft, or opportunities for other criminal acts” allows enormous discretion to public agencies to deny requests behind the veneer of protecting the public. This exception is wide enough that it can be used for a denial of almost any information even tangentially related to a specific person or group of people.
    • Creates unbalanced “task force” to study police records: Though special circumstances do often apply to law enforcement records, they are still government records preserved on behalf of the public. Given the strong public interest in accountable policing, any task force should have a clear charge focused on that accountability and its composition should reflect that goal.
  • Increases incentives for non-compliance/denial:
    • Makes fee-shifting discretionary rather than mandatory: The opaque and slow Government Records Council process means that the only effective way to resolve OPRA denial complaints is through the courts. Because these cases do not frequently result in money damages, mandatory fee-shifting is the only incentive for lawyers to take on these cases for citizens.
    • Establishes personal immunity for willful violations: As has been seen in other areas of public employee misconduct, the public ends up paying the bill for the costs of violations and litigation. Eliminating personal immunity for willful violations of OPRA will create more incentive not to comply, because the agency, not the custodian, will be on the hook.
  • Expands red tape
    • Requires correspondence to be on a “specific subject matter” and “discrete and limited time period” from a specific person: Say that a member of the public is interested in finding out about why a municipality made a decision to sell a parcel. The member requests emails pertaining to the sale of the parcel, but does not necessarily know when those emails would have been sent, or even the identity of the relevant employees who made the decision.
    • Allows data to be provided in any format at the discretion of the custodian, even if highly inconvenient: Many records remain only accessible in hard copy. This format is highly inconvenient especially when records are voluminous. Providing records in the requested format when possible aids public access.
    • Extends time period for response from 7 to 14 days “as appropriate”: The bill de facto eliminates seven-day requirements by adding “14 days as appropriate” in a variety of circumstances. No doubt custodians will find it appropriate to use the 14 days rather than seven.
    • Extends time period to review for Daniel’s Law compliance: A perfectly reasonable concern for compliance with state confidentiality law should not necessarily require a 14-day review period to buy additional delays in compliance.
    • Extends time period based on when a request is “received” rather than sent: This creates an incentive to ignore requests or not to open them in a timely manner.
    • Mandates use of the OPRA request form: This simply provides another way to deny an otherwise-legitimate request for not going through the proper portal, especially when many state residents still lack internet access or a vehicle.
    • Limits “commercial” requests: The definition of “commercial” is so broad that it likely includes legitimate purposes. A wide range of businesses use public records. A bill targeting dubious or predatory commercial use requires much more tailoring to ensure that members of the public are not excluded from access.


As the members of this committee can no doubt see, this bill represents a wholesale rewriting of the OPRA statute to hide more and more government business behind closed doors. Members of all political parties and backgrounds should see the risks of hiding accountability for government activity.

Lame Duck Session Lacked Transparency, Disregarded Standard Legislative Practice

In the post-election Legislative session, New Jersey lawmakers’ activities included introducing and voting on a flurry of bills meant to benefit corporate interests and boost pension benefits for a select few politically-connected individuals — often without the text of legislation or an opportunity to testify at hearings being available to the public. In response to the lack of transparency during the lame duck session, New Jersey Policy Perspective (NJPP) released the following statement.

Jon Shure, Interim President, NJPP:

“The legislative process often is messy, but this lame duck session too often disregarded standard legislative practices and transparency. When the process isn’t open, the public simply can’t be put first.

“Closed-door legislating inevitably favors the privileged few and shuts out those who don’t have lobbyists. Too often, the winners in lame duck were casinos, horse racing, Hollywood studios, and the like. The people for whom New Jersey really needs to be more affordable often came up empty.

“There will be lame duck sessions in the future, of course. And we look forward to working with advocates for openness and responsiveness to the public to make sure the public interest remains the top priority at all times.”

# # #

Election Results Present Historic Opportunity to Pass Progressive Policies

Yesterday, Governor Murphy was declared the winner of New Jersey’s 2021 gubernatorial election. Governor Murphy’s win broke with 40 years of history: Not only was he the first Democrat since 1977 to be reelected to the Governorship of New Jersey, but his victory was the first time since 1981 that a party that had elected a new President the prior year was able to win the governorship of either New Jersey or Virginia. In response to the election results, New Jersey Policy Perspective (NJPP) releases the following statement: 

Louis Di Paolo, Communications Director, NJPP:

“This week’s election results present the biggest opportunity for passing progressive policy in New Jersey’s history. While votes are still being tallied and some legislative seats have yet to be called, what’s clear is that Governor Murphy ran — and won — on his record of passing laws that advance equity and build a strong economy for working and middle-class families.

“This is a wake up call that the old rules of New Jersey politics do not hold: avoiding tough decisions and policy positions will not protect elected officials. Voters want candidates who have a vision for the future and support policies that will benefit them, whether it’s good-paying jobs, a stronger safety net, high-quality public schools, or a fairer tax code. Political candidates, regardless of their party affiliation, should not run from their achievements but proudly and enthusiastically run on them.

“We look forward to working with Governor Murphy and the newly elected Legislature in the upcoming session on tackling bold and popular policies that advance equity and support workers and their families.”

# # #

New Jersey Policy Perspective (NJPP) is a nonpartisan think tank that drives policy change to advance economic, social, and racial justice through evidence-based, independent research, analysis, and advocacy.

We the People: Why New Jersey Needs to Expand Democracy

“We the people” is a phrase synonymous with U.S. democracy. After all, these are the first words in the Constitution. However, as history shows — and despite its etching into our nation’s founding documents — not all “men” are created equal in public institutions, policies, and practices. If that were the case, there would be no need to undo voter disenfranchisement, partisan election ballots, institutional racism, sexism, discrimination, and more that have plagued democracy since its founding.

Nevertheless, New Jersey has done a lot to expand democracy over the past few years: from restoring voting rights to formerly incarcerated residents, to establishing automatic voter registration, to enabling residents to register online, vote early, and remotely through vote-by-mail. Yet, white, senior voters are still most likely to vote and shape policy and state and local decision-making. In New Jersey, Black, Asian, and Hispanic/Latinx residents are the least likely to participate in elections, with voting rates of approximately 50 to 60 percent, compared to 79 percent for white voters.[i] Additionally, partisan primary election ballots that privilege the preferences of county political parties further dilute the chances for authentic representation of the public.[ii]

To have a true democracy in the Garden State, lawmakers must extend voting rights to even more residents, abolish “the line” on primary ballots, and create a fairer, more inclusive redistricting process. This will require a collection of policies that make voting easier, bring more New Jerseyans into democratic processes, and encourage more competitive elections. With Senate Republicans blocking federal voting rights legislation in Congress, the need for state reforms are all the more urgent.

To learn more about these important issues before Election Day, please consider reading:


End Notes

[i] U.S. Census Bureau, Current Population Survey, November 2020.Table 4b. Reported Voting and Registration, by Sex, Race and Hispanic Origin, for States: November 2020 https://www.census.gov/data/tables/time-series/demo/voting-and-registration/p20-583.html

[ii] Julia Sass Rubin. 2020. Toeing the Line: New Jersey Primary Ballots Enable Party Insiders to Pick Winners. New Jersey Policy Perspective. https://www.njpp.org/publications/report/toeing-the-line-new-jersey-primary-ballots-enable-party-insiders-to-pick-winners/

Big Money in Politics Shuts Voters Out of the Political Process

On Tuesday, Politico reported that New Jersey’s major political leadership committees have spent more money this election cycle than in any of the last 14 years. In total, the six leadership committees raised $10.1 million and have spent $8.9 million, as of September 30. In response to the increased role of big money in politics, New Jersey Policy Perspective (NJPP) releases the following statement.

Nicole Rodriguez, Research Director, NJPP:

“Big money in politics shuts voters out of the political process and leads to public policies that benefit special interests over the needs of the general public. To strengthen our democracy and keep wealthy individuals from having an outsized influence on policy decisions, lawmakers should extend the public financing of elections to state legislative races.

“While our homes get blanketed with expensive mailers and ads paid for by special interests, everyday New Jerseyans have less actual say in governing because of undemocratic and opaque practices like partisan primary ballot design (also known as “the line”) and redistricting that shuts out citizen input. It should come as no surprise that big spending in state legislative races comes at the expense of democratic participation.

“Sky-high political spending by both parties, combined with little opportunity for public input, is a sign of an unhealthy democracy. It’s time to fix that.”

# # #

Redistricting: Where Do Incarcerated People Count?

On Friday, August 20, Governor Murphy signed legislation that changes how New Jersey counts people who are incarcerated for the purposes of congressional redistricting. Under the new law, people who are incarcerated in the state will be counted at their address prior to incarceration — including at the municipal, county, and regional school district levels — rather than at their detention facility. This builds on existing legislation that enacted the same for state legislative redistricting.

Previously, people who are incarcerated were counted as residents of their facility, but this produced distortions in population and electoral representation. This practice is commonly referred to as “prison gerrymandering” because it resembles other “gerrymandering” methods that manipulate electoral boundaries to advance the political power of one group over another.

With prison gerrymandering, communities where prisons and jails were built receive outsize representation based on their incarcerated population. Conversely, communities that have been disproportionately harmed by mass incarceration have had their populations artificially lowered by their incarcerated population, even though that population will inevitably require services, infrastructure, and representation upon their return.

For example, Maurice River Township in eastern Cumberland County had a population of 6,218 in the 2020 Census. But nearly half of its population, 3,034 residents, were incarcerated (Maurice River Township is home to both Bayside State Prison and the Southern State Correctional Facility). For the purposes of redistricting, the township’s population was nearly doubled, inflating its political representation at the expense of the communities where the people who are incarcerated came from originally.

Because data on the prior addresses of incarcerated people are not currently available, it’s difficult to say how this change will affect the final redistricting population counts. However, based on the Census Bureau’s redistricting file, we can see where incarcerated persons would have been counted under the old system.

Congressional Districts

The three districts most likely to be affected by the change will be Congressional Districts 2, 3, and 10, each of which has about one percent of their population composed of people who are incarcerated. These populations will have to be reallocated to their “home” districts, or in the case of individuals without prior address population, removed from their current district and placed into the statewide total.

Legislative Districts

The districts most likely to be affected by the change at the state level are Districts 29 (Newark), 12 (Jackson), 1 (Vineland), 3 (Bridgeton), and 15 (Trenton), each of which has more than one percent of their population in incarceration. District 29 in Essex County particularly stands out, with 3.7 percent of its population — or 9,349 residents — counted as incarcerated.

Municipalities

The new redistricting rules may have some of the biggest impacts at municipal or local levels. Below is a map of Newark’s ward boundaries, along with the Census tracts and their incarcerated population. Newark’s new 2020 Census count is 311,549 people, yielding ward sizes of roughly 62,309 people for each of the city’s five wards. Within Newark’s current East Ward boundaries, more than 8,000 people were counted as incarcerated in the 2020 Census, representing almost 13 percent of an average ward. If even a fraction of those populations is moved to other cities or wards in Newark, the boundary lines of the East Ward will likely have to expand to ensure that the population respects “one-person-one-vote” principles.

The data from the Secretary of State’s office with final counts for the purposes of redistricting will not be available until after finalized Census figures are sent to the State on September 30. For more information about what the new Census figures mean for New Jersey as a whole, read this breakdown on New Jersey’s demographic and district population changes here.


End Note

This report’s data on people who are incarcerated was generated from the Census Bureau’s Redistricting Summary Files, available at https://www.census.gov/programs-surveys/decennial-census/about/rdo/summary-files.html. For more on the Census Bureau’s data quality and disclosure avoidance system at smaller levels of geography, see: https://www.census.gov/programs-surveys/decennial-census/decade/2020/planning-management/process/disclosure-avoidance.html.

How New Jersey’s Population Changed Since 2010 and What it Means for Redistricting

On August 12, the Census Bureau released detailed data tables to assist states in drawing new congressional and legislative district lines. This first look at detailed population counts provides basic race and ethnicity data that should be carefully considered when redrawing district boundaries so as not to dilute the voting power of racial and ethnic groups. As it stands, New Jersey’s state legislature is disproportionately white, with low representation from Asian and Latinx/Hispanic communities. New Jersey’s new districts should ensure that these groups end up with a proportional and fair voice when allocating political power.

Statewide Changes

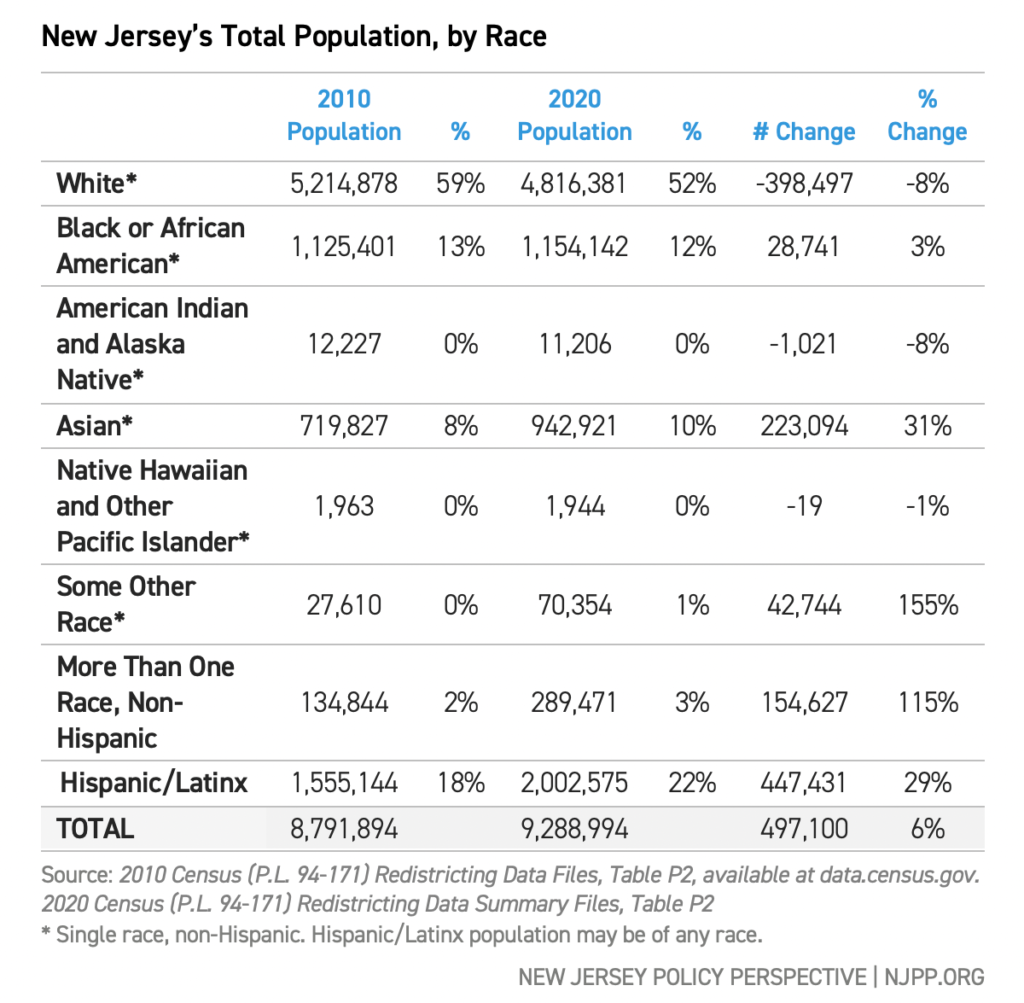
Overall, the Garden State has gained almost half a million residents since 2010, growing at a 5.7 percent rate, debunking the oft-repeated myth that New Jersey is losing population. New Jersey is also growing more racially and ethnically diverse, especially its child population.

Latinx/Hispanic and Asian populations heavily drove New Jersey’s growth in the 2010s. Latinx/Hispanic populations grew by 447,000, or 29 percent, while Asian/Asian-American populations grew by 223,000, or 31 percent. The Black/African-American population saw a more modest increase, growing by about 29,000, a 3 percent increase from 2010. White non-Hispanic populations declined by about 399,000, an 8 percent decline from 2010.

Census figures show that the state is growing more diverse, but the limited racial and ethnic categories in the current data release fall short of capturing the full array of New Jersey’s communities and ethnic groups. Headlines highlighting the decline in “white” population are often focused on the non-Hispanic white population. But the Census counts Hispanic/Latinx status as a separate ethnicity from race, meaning that a person can mark that they are Hispanic/Latinx and that they are white, Black, Asian, or any other race. Subsequent Census data releases will include a breakdown of the racial identification of Hispanic/Latinx respondents.

Complicating racial and ethnic breakdowns further, one notable area of growth is people selecting “some other race” or “more than one race,” suggesting the limitations of existing racial categories on the Census questionnaire. People selecting “some other race” increased by 155 percent, while non-Hispanic people selecting “more than one race” increased by 115 percent. These trends are even more pronounced in the child population.

New Jersey's Total Population, by RaceChild Population

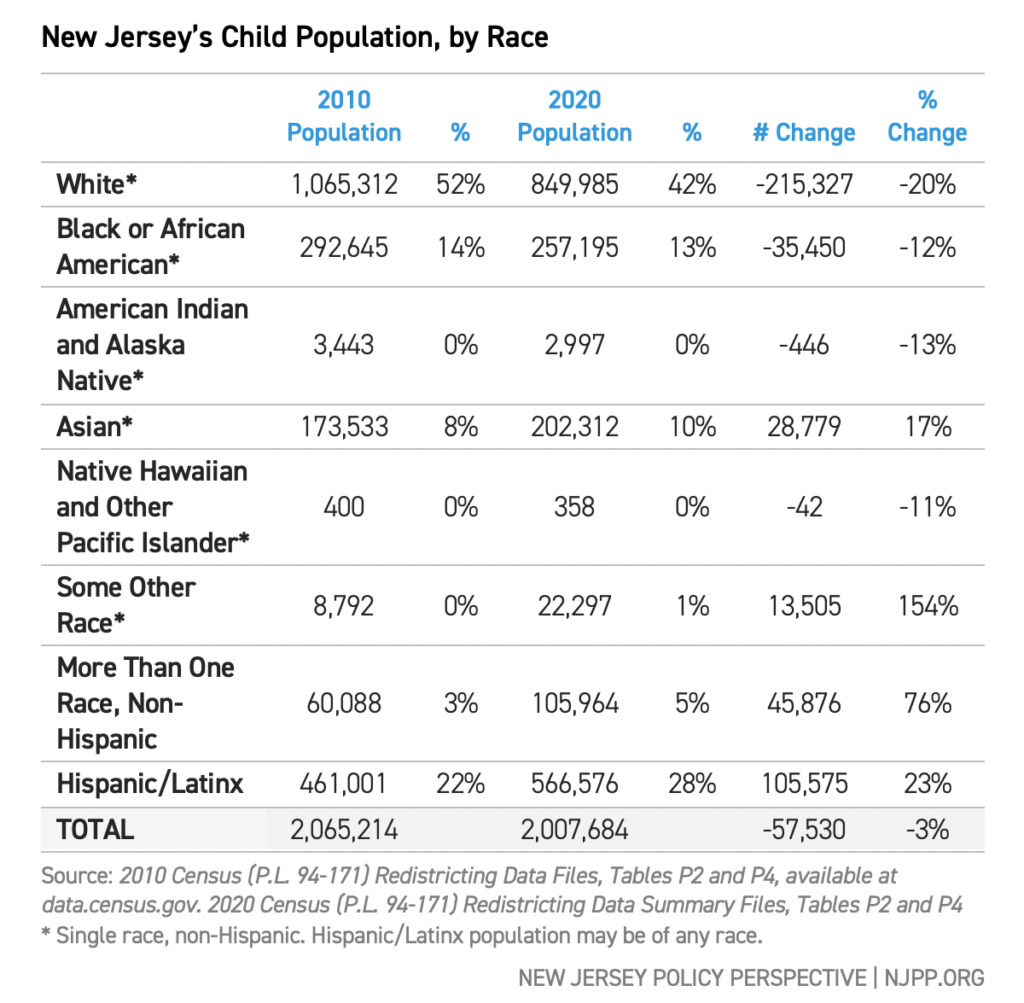
Many of the trends of increased racial and ethnic diversity seen in the total population are amplified in the child population. The racial and ethnic breakdown of the state’s child population is of critical importance for lawmakers when considering the education, health care, and language access needs of New Jersey’s children.

The child population has higher percentages of Hispanic/Latinx (28 percent), Black/African American (13 percent), and multiracial (5 percent) populations than New Jersey’s total population. These figures mirror trends in annual surveys like the American Community Survey.

However, the child population declined by about 57,000 children between 2010 and 2020, falling roughly 3 percent. It’s unclear from the data what could be causing this decline.

New Jersey's Child Population, by Race

County-Level Changes

New Jersey’s population trends by county showed the shifts in growth statewide. While some counties grew by more than 10 percent (Hudson, Ocean, and Essex), others like Sussex, Cape May, Salem, Cumberland, and Atlantic Counties lost population. Most of New Jersey’s population gain over the last decade was concentrated in counties closest to New York City, as well as in Lakewood and surrounding areas in Ocean County.

Congressional and Legislative Districts

The constitutional purpose of the decennial Census is the redrawing of electoral district boundaries for Congress and state legislatures. As populations grow and change, district lines must also shift to reflect the principle of one-person-one-vote and allow for fair representation of all residents. This means each district must have roughly the same number of residents and, in the case of congressional redistricting, nearly identical resident counts. To do so, the redistricting commissions need to evaluate which districts have grown and shrunk in the last decade, and how to even out their populations. This redistricting process is already underway in New Jersey. For more information on New Jersey’s upcoming redistricting process, more resources are available at Fair Districts NJ.

New Jersey will retain its twelve congressional districts over the next decade, but their lines will likely change to properly balance population. In northeast New Jersey, Congressional Districts 8, 9, and 10 grew faster than the statewide rate, as did District 4 due to population growth in Ocean County, while others will have to add population to maintain equality across districts, notably District 2, which covers the southern end of the state.

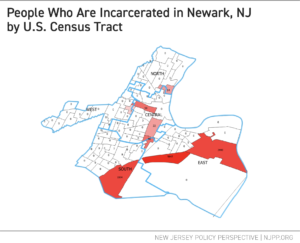
Importantly, the following tables do not reflect New Jersey’s new law that requires the redistricting commission to draw state legislative district lines with incarcerated persons counted at their prior residence. Instead, these data follow the Census Bureau’s policy of counting all residents where they live as of April 1, 2020, meaning that incarcerated individuals are counted in the secured facility they live in, rather than the address they stayed at prior to incarceration.

The changing demographics also mean that redistricting will have to be careful not to “pack” or “crack” racial or ethnic groups to dilute their voting power. These two techniques form the basis of most gerrymandering by shifting boundary lines around particular populations.

  • Packing occurs when one disfavored group is concentrated into a small number of districts, giving them overwhelming wins in just those districts while limiting their proportional impact in other districts.
  • Cracking occurs when the disfavored group is divided and spread out among a large number of districts, so they consistently are unable to break 50 percent of the vote.


Often these tactics occur in tandem, packing most of a group into a few districts, then cracking the remainder among the remaining districts. For more information on this topic, the Princeton Gerrymandering Project has extensive resources on gerrymandering.

A parallel process is also underway to set legislative district lines. This process is made more challenging because municipalities must remain intact and cannot be split among different districts, with the exception of Jersey City and Newark, which can each be split into no more than two districts.

The five legislative districts that grew the fastest were District 30 (Lakewood), Districts 31 and 33 (Jersey City), and Districts 28 and 29 (Newark). These mirror the changes seen in municipality growth. To reflect the principle of “one-person, one-vote,” each district should have roughly equal population, with the new “ideal” district having 232,225 residents. Faster growing districts will have to be reduced in size to get closer to this district size, while districts that will have to gain in population to keep pace include District 24 (Sparta), District 1 (Vineland), and District 2 (Atlantic City).

Municipal Population Changes

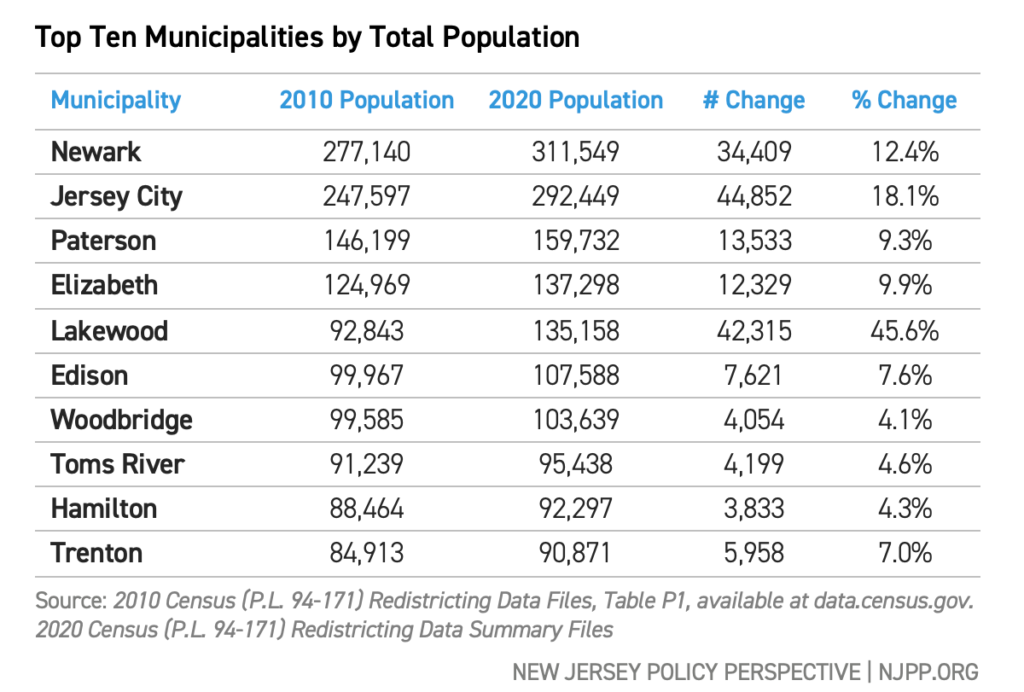
The growth statewide is reflected in the growth in New Jersey’s largest municipalities. Newark retained its crown as New Jersey’s largest city, fending off faster growth in Jersey City. Both cities had extensive Census campaigns to assist residents in completing the questionnaire and ensure an accurate 2020 Census count.

Elsewhere in the top ten, Lakewood leapfrogged Edison and Woodbridge to the Number 5 spot, while Trenton held its 10th place position over Clifton.

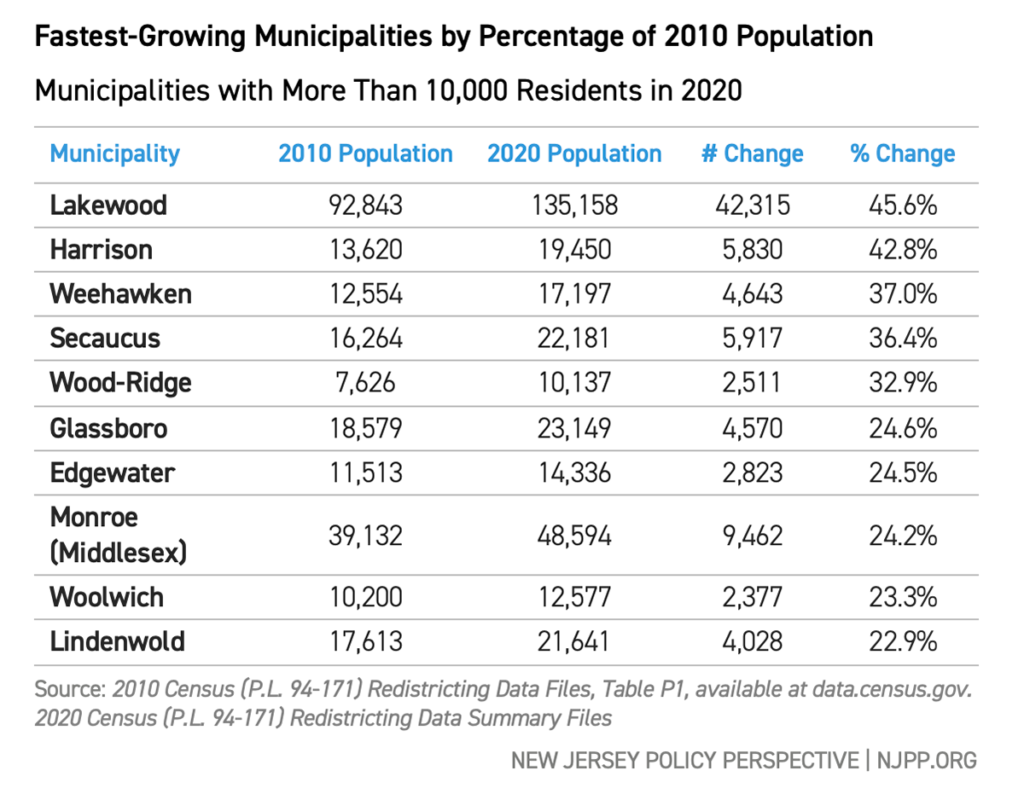
The municipalities (with more than 10,000 residents) with the highest population growth since 2010 are:

  • Jersey City (+44,852),
  • Lakewood (+42,315),
  • Newark (+34,409),
  • Paterson (+13,533), and
  • Elizabeth (+12,329).


As New Jersey develops municipal and statewide policy, they must accurately reflect the reality of where people live, especially as municipal growth drives New Jersey’s statewide growth more broadly. New Jersey’s ten largest cities grew at a rate of 12.7 percent, more than double the statewide rate of 5.7 percent.

Top Ten Municipalities by Total Population

Fastest-Growing Municipalities by Percentage of 2010 Population

Slowest-Growing or Shrinking Municipalities by Percentage of 2010 Population

Conclusion

The redistricting data release is just the first step in the redistricting process, as more fine-grained Census data has yet to be released — including more data on racial, ethnic, and national origin identification, as well as detailed age and sex data. Even at this level of general data, however, it is clear that New Jersey continues to grow larger and more diverse. Its institutions and political boundaries should reflect this new reality.