Reinforced by racial segregation and income inequality, the U.S. public schooling system is one of the most unequal in the industrialized world – and New Jersey is no exception. Earlier NJPP reports on education find that the state makes a relatively strong effort to fund its schools, leading to many districts exceeding national averages on test scores.[1] Yet, too many students aren’t given the resources they need to ensure equal educational opportunity.[2] Overwhelmingly, these are Black and Hispanic/Latinx children, living in communities with lower property values and, consequently, lower local capacity to raise revenues to fund schools.
It is no accident that New Jersey’s Black and Hispanic/Latinx students are enrolled in school districts with lower tax capacity: racist practices such as “redlining” and “block busting” have created segregated communities with artificially lower property values.[3] These practices cannot be simply dismissed as sins of the past: the generational wealth taken from the residents of these communities has profound effects on school funding today.
The COVID-19 pandemic further exposes these patterns of institutionalized racism that have resulted in poverty-related education disparities and substantial racial inequities in school resources. For example, NJPP reported last year that children of color were much less likely to have access to a school that offered in-person instruction during the pandemic.[4] Unquestionably, this inequity was due, in part, to disparities in school funding: the better-funded a school district, the more likely it was to have school buildings open to students. But it would be a mistake to suggest school funding capacity, by itself, accounts for all of New Jersey’s chronic inequities in educational resources.
This report examines the history, policies, and practices that negatively affect Black and Hispanic/Latinx students in New Jersey. Included in the following analysis is discussion of the plight of Hispanic/Latinx populations both because many of the mechanisms of discrimination used to disadvantage Black students and families in the past were similarly applied to Hispanic/Latinx populations, and because our own recent work reveals even more substantial school funding disparities affecting Hispanic/Latinx communities.[5]
The report concludes by making a case for school funding reform as a reparation for the racist housing practices that have negative effects on taxpayers and students of color even today. New Jersey should recalibrate its school funding law to account for the additional costs of educating students in racially isolated schools, both to improve outcomes for those students and to provide tax relief to property owners in communities that have suffered the loss of wealth and resources due to systemic racism.
Examining Race and Racism in Educational Opportunity
Racial inequity in education does not happen in a vacuum. In fact, race, poverty, school funding, and educational inequality share substantial intersections. Yet, race on its own is a powerful and independent influence on educational resources and outcomes. A major contributing factor to racial inequity is structural racism: a system in which public policies and other norms, like those that determine funding and tax liabilities, privilege “whiteness” and disadvantage people of color, creating inequities that endure and adapt over time.[6]
Of course, racism that causes these disparities is often implicit. Unfortunately, white and elderly individuals often fail to support adequate resources and funding for public services directed toward Black and brown communities, even while supporting such funding for their own communities.[7] But racism in this area may also be explicit, such as historical racial restrictions on homeownership imposed less than a generation ago by local homeowners’ associations, as well as the downgrading of property values in predominantly Black neighborhoods in the mid-1900s, causing segregation.
Many of New Jersey’s school districts are still segregated today, with varying degrees of racial isolation[8] and capacity to raise local revenues for schools. And while there are funding disparities within-district, the most egregious school funding disparities in New Jersey are between districts.[9] Residential racial isolation is, therefore, an important concern when addressing school funding inequity.
It may be tempting to dismiss New Jersey’s history of segregation, which greatly affects its current racial disparities in school funding, as less pernicious and less relevant than those in other states – particularly Southern states whose school funding systems are even less equitable than New Jersey’s.[10] But examining both the historical record and current data shows New Jersey can’t ignore how structural racism has hurt – and continues to hurt – its children of color. If every child is to receive the education they deserve, the state must confront the underlying, racially-driven forces that prevent too many children from attending well-resourced schools.
Racial Isolation in New Jersey and School Funding: Three Examples
To illustrate the various ways structural racism has created both racial segregation and school funding inequity, this report highlights three examples of majority-Black school districts: East Orange, Willingboro, and Lawnside.
The table below compares each district to a majority-white district close by. “Income per pupil” refers to the total amount of personal taxable income reported in the district divided by the number of resident students enrolled in the school district. “Equalized Value per Pupil” is the total equalized property value[11] of the district divided by enrolled students. Each is a way to evaluate the relative wealth of a district; both are used in the state’s funding formula to determine a community’s ability to raise local revenues for schools.
In all three of our examples, majority-Black districts have far less local capacity to raise revenues for their schools than nearby majority-white districts. How these disparities came to be, however, is different in each community.
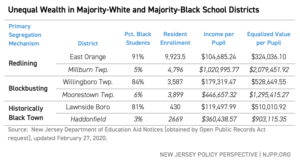
East Orange
The history of segregation efforts through “redlining” – the racist practice that denied mortgages to Black residents, preventing them from buying homes in certain neighborhoods – is well established in the U.S. In New Jersey, redlining practices by the Homeowners Loan Corporation (HOLC) in the late 1930s have had lasting effects, particularly in northern counties such as Essex, Hudson, Union, and Bergen. The HOLC classified “risk criteria” for issuing insured loans: homes in non-immigrant white neighborhoods were deemed the lowest risk, while homes in Black neighborhoods were deemed high-risk and often ineligible for insured loans. As a result, the expansion of access to homeownership, through both Federal Housing Authority (FHA) and Veterans Administration (VA) backed loans, became a primary path to building family wealth in the post-WWII period; however, due to restrictions in access to these loans, Black residents were largely excluded from this opportunity.
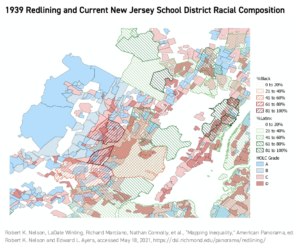
The effects of the racist practice of redlining on school segregation and funding in New Jersey are evident even today. The map below shows the 1939 HOLC grading for Essex and portions of Hudson, Union, and Bergen County. Blue areas were A-graded; red areas were D-graded. Among the considerations in assigning grades were shares of Black residents and immigrants (usually with reference to Italian immigrants), both of which led to rating downgrades.[12] On top of these gradings, the map is overlaid by the current (2018) school district boundaries with proportions of enrollments that are Black (red, left slash) or Hispanic/Latinx (green right slash).
East Orange is typical of the majority-Black school districts in this part of the state: many of its neighborhoods were redlined and deemed high-risk, leading to an inevitable decrease in property values. Other formerly redlined areas in Irvington, Orange, and Newark remain predominantly Black. Other areas, including those where neighborhoods were mostly A-graded, were and remain mostly white.
Willingboro
William Levitt (of Levittown fame) first established Willingboro in Burlington County as a post-WWII suburb of Camden and Philadelphia. His intention was to create a new community as lily-white as other Levitt communities around the country.[13] Levitt was not shy about his intentions, proclaiming in 1958 that he would not sell houses in Willingboro to Black residents.[14] Shortly after, the Reverend Willie James, a Black civil rights activist, who was turned away at Levitt’s developer’s sales office, sued to racially integrate the neighborhood. The matter eventually reached the New Jersey Supreme Court, which ruled in favor of the Reverend.[15] In 1967, the community was fully opened to Black homeowners. However, realtors quickly engaged in a classic behavior known as “block busting”: invoking fear in white families of declining property values and quality of life. Concurrently, predominantly white developments in neighboring communities expanded, using zoning restrictions (opposing multi-family units and constraining affordability) to maintain racial restrictions. The town attempted, unsuccessfully, to stop the racial turnover with a prohibition on “for sale” signs.[16] Soon after, the town’s demographics shifted, eventually becoming the majority Black community it is today.[17] As shown in the table above, Willingboro’s per pupil property values are lower than nearby majority-white school districts, a consequence of block busting that occurred only a few decades before.
Lawnside
Lawnside is among the few towns across the nation that was established as an African American community. This “free haven” was founded with the assistance of abolitionists and Quakers (who opposed slavery), eventually becoming a location along the Underground Railroad.[18] In 1926, Lawnside became an official borough of New Jersey and soon developed community institutions required for self-governance, after fighting to remain an autonomous Black community.[19] For all its successes at establishing itself as a self-governing Black community, remaining more middle-class than other Black communities near Camden or Philadelphia, Lawnside was also subject to racist forces of urban planning, such as being bifurcated by the eventual development of major interstates (I-295) and the New Jersey Turnpike.
Willingboro and Lawnside are often cited as examples of thriving Black middle-class communities. But even these communities stand in stark contrast with their more affluent majority-white neighbors on measures of wealth and income. Moorestown has approximately 2.5x the taxable wealth and income of Willingboro. Haddonfield has more than triple the income level and about 78 percent higher taxable property wealth than Lawnside. These disparities put Lawnside and Willingboro at a distinct disadvantage when funding their schools – a disadvantage that, again, is borne out of systemic, historic racism.
The Growth of Hispanic/Latinx Isolation in New Jersey
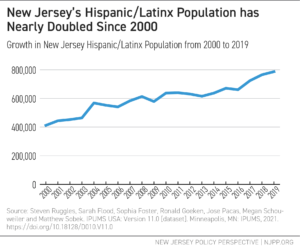
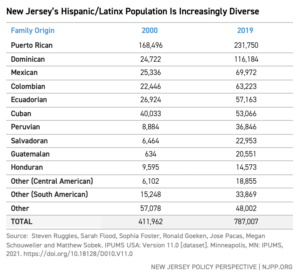
No discussion of school funding and racial/ethnic isolation in New Jersey would be complete without noting the rise of majority Hispanic/Latinx communities in the state. New Jersey’s Hispanic/Latinx population has grown dramatically in recent decades, becoming more complex in terms of race and national origin. New Jersey has long been home to a significant Puerto Rican population, concentrated primarily in larger cities like Paterson, Newark, Camden, and Trenton. In the past two decades, the state’s Dominican, Mexican, Columbian, Ecuadorian, and Cuban populations have grown, often concentrating by national origin in specific communities and school districts across the state.
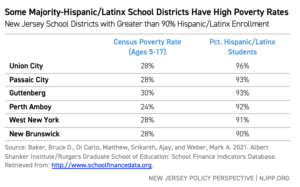
By 2018, 47 New Jersey school districts were majority Hispanic/Latinx, enrolling nearly 20 percent of the state’s students. Six of those districts were nearly entirely Hispanic/Latinx (over 90 percent) in their enrollments. These districts have high child poverty rates and many English Language Learners (ELLs).
Many majority-Hispanic/Latinx school districts are small, densely populated boroughs in the New York metropolitan area. Those tracts were redlined and over time became increasingly Black and, eventually, majority Hispanic/Latinx. Other outlying towns like Dover, Freehold Borough, and Bound Brook have also become majority Hispanic/Latinx over time with an influx of Peruvian and Ecuadorian immigrants. Along with locally governed zoning, the real estate industry has continued to play a role in steering Hispanic/Latinx immigrants toward specific communities and properties in New Jersey and away from others. In still other cases, secessions and school district reorganizations reinforced racial divides among districts.[20]
Racial/Ethnic Segregation and School Revenues: Comparing New Jersey to Other States
In statewide comparisons of school quality and educational outcomes, New Jersey often shares the top positions with Massachusetts and Connecticut. All three states are politically progressive but racially and economically segregated: New Jersey ranks 34th in racial educational integration, Connecticut 36th, and Massachusetts 42nd.[21] Despite their similarities, there are significant differences regarding racial segregation and school funding. Therefore, a comparison is instructive in helping to develop policies that equalize educational opportunities for New Jersey’s children.
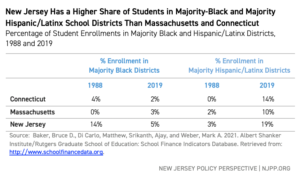
The table below shows the shares of student enrollments currently attending public school districts that are majority Black or majority Hispanic/Latinx, compared to 1988, the earliest data available. While the share of New Jersey students attending majority Black districts has declined, it has remained larger than in Massachusetts or Connecticut. Connecticut presently has only one majority Black school district, Bloomfield, while the state’s larger cities have become increasingly Hispanic/Latinx over time.[22] In all three states, the share of children attending majority Hispanic/Latinx districts has increased dramatically over the past 30 years.
Race/Ethnicity and Disparities in Wealth and Tax Rates
The table below shows the racial disparities in incomes, housing values, and effective tax rates in all three states – New Jersey, Connecticut, and Massachusetts – using U.S. Census Bureau data. Although politically liberal states, they remain highly segregated by race and have vast income inequality. The table summarizes the average household income and average housing values for Black, Hispanic/Latinx, and “other” homeowners (largely white) in each state. Across all three states, housing value gaps are largest for Blacks. Yet, the gap in Massachusetts is relatively small, while the largest gap by far is in Connecticut (for both Black and Hispanic/Latinx homeowners). New Jersey is positioned somewhere in the middle: better than it could be, but not as good as it should be.
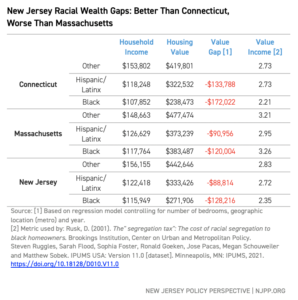
The value-to-income ratio characterizes how much value homeowners acquire through their homes relative to their income levels; higher values indicate that a homeowner has gained more wealth, relative to their income, through the value of their home. In Massachusetts, Black homeowners do not face this deficit: the housing wealth they have acquired, relative to their income, is similar to “other” (non-Black and non-Hispanic/Latinx) residents. But in both Connecticut and New Jersey, Black homeowners suffer from a deficit in property wealth; in other words, Black homeowners in these states have not been able to transfer the same amount of their income into the value of their homes as white homeowners. Hispanic/Latinx homeowners face a household value/income deficit in Massachusetts and New Jersey, but not in Connecticut.
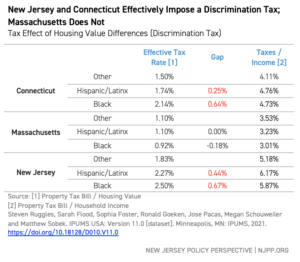
It’s important to note that the estimated “value gaps” here are for homes with the same number of bedrooms in the same metropolitan area and year. Yet, the gaps are still large, suggesting that racial isolation is driving the differences in property wealth and, consequently, a community’s capacity to raise revenues for its schools. These disparities in home values lead directly to disparities in taxation because a district with lower property values must levy a higher tax rate to raise the same amount of revenue as a town with higher values. The table below shows the differences in effective property tax rates by race & ethnicity for each state. In both Connecticut and New Jersey, Black and Hispanic/ Latinx homeowners are paying what is, in effect, a discrimination tax, with Black homeowners paying the highest effective rate.
Race/Ethnicity and Disparities in School Revenues
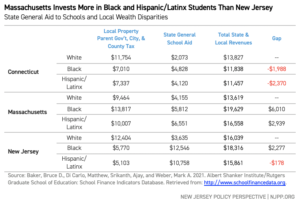
Statewide school funding systems can take multiple approaches to ameliorate these disparities in tax rates. One approach is to invest more school and municipal aid from the state to low-income communities. Because this aid is paid for with revenues from all of the state’s taxpayers, the burden to raise local school revenues lessens in low-income school districts and towns, which have lower property values and, therefore, less capacity to raise funds locally. State aid to schools, however, must be targeted appropriately and robust enough to address the racial and ethnic disparities in property wealth.
New Jersey’s state aid to schools helps to drive more total revenues to schools enrolling Black students. Unlike Connecticut, where Black students attend schools that receive $2,370 less per pupil in state and local revenue than white students, New Jersey’s Black students receive $2,939 more per pupil than white students. In contrast, New Jersey’s Hispanic/Latinx students receive $178 less per pupil than its white students; however, that gap is much smaller than the $2,370 gap suffered by Connecticut’s Hispanic/Latinx students.
Note, however, that New Jersey’s Black and Hispanic/Latinx homeowners still pay a higher tax rate, and a higher percentage of their income in property taxes, than what the state’s white homeowners pay. This is not the case in Massachusetts – and yet that state manages to drive more total revenue per pupil to Hispanic/Latinx students than white students. Further, Massachusetts’s Black students enjoy an even greater funding advantage, relative to whites, than New Jersey’s Black students.
The Cost of Equal Educational Opportunity
Comparisons of school spending raise an important question: how much should be spent to provide students with an equal opportunity to achieve educational success? To answer this question, Bruce Baker developed the National Educational Cost Model (NECM).[23] This model uses actual school spending, test outcomes, and student characteristic data to estimate the cost of students achieving a particular level of education outcomes (measured by test scores), given their different needs and in costs in different regions.
While the NECM has limitations, it does accomplish two important tasks: first, it provides evidence that schools with varying student bodies need varying amounts of funding to provide an adequate education; second, it provides guidance for policymakers in setting spending targets for different school districts. For example, in previous work, NECM derived estimates have been used to suggest ways that New Jersey could recalibrate its system of school aid distribution to better meet the needs of schools that enroll differing student bodies.[24]
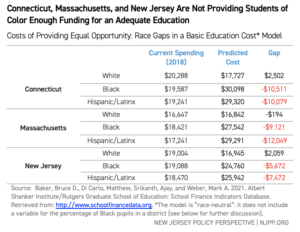
The table below shows the NECM’s predicted average cost of achieving current Massachusetts average outcomes in reading and math average for Connecticut, Massachusetts, and New Jersey, as well as how much each state actually spends. The figures are broken down by race and ethnicity, showing the differences in spending and estimated costs for white, Black, and Hispanic/Latinx students. Finally, the table shows the gap between the NECM estimated cost and the amount spent.[25]
The model shows all three states follow a similar pattern, although there are significant differences in the spending/cost gaps between the different states. In Massachusetts, for example, the average white student attends a district that spends approximately what is needed to achieve average outcomes. By contrast, the average Black student attends a district with a significant deficit toward providing equal opportunity; the average Hispanic/Latinx student faces the largest funding deficit. The patterns are similar in New Jersey, but the spending/cost gaps are smaller; again, Hispanic/Latinx students face the largest gaps. In Connecticut, both Black and Hispanic/Latinx students face similarly large funding gaps to achieve common outcome goals. The outcome goals set here – the average test scores for Massachusetts, one of the highest-performing states in the nation –are high ones.[26] But whether higher or lower goals, the relative positions of white, Black, or Hispanic/Latinx students stay the same.
Accounting for Racial Isolation in Educational Costs
NECM cost estimates differ by the variables it uses to describe students enrolled in different school districts. Poverty, for example, has a powerful effect on student outcomes; including a measure of poverty, therefore, provides a more precise estimate of the spending needed to achieve a desired outcome. The estimates above, however, come from a model that does not include student race; therefore, these gaps do not address any additional costs that may be associated with racial isolation of Black or Hispanic/Latinx communities.[27]
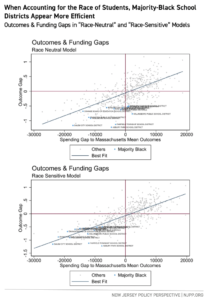
One signal that the cost projections are incomplete without accounting for racial inequities can be seen in the figures below. When we estimate a typical cost model but don’t include race (percentage of Black students) as a factor that might influence costs of equal opportunity, we tend to find that majority Black districts look relatively inefficient. That is, when racial isolation isn’t accounted for, majority-Black districts look like their funding is more adequate than it may be, and yet their performance lags (they invariably fall below the diagonal line).
However, before coming to this conclusion, one should remember that through historical discrimination and segregation, these districts have had additional costs imposed on them. Perhaps it’s not that these districts are less efficient; rather, systemic racism imposed additional costs on them to achieve common outcomes. When race is considered among the cost factors – in other words, when student race is added to the model that predicts educational costs – these districts no longer appear to be inefficient. It no longer looks, for example, like Willingboro has more than enough to achieve the desired outcomes but doesn’t because the district’s schools are inefficient; instead, Willingboro likely needs more resources, in part, because of its racial isolation.
We note here that we have not found the same effect for Hispanic/Latinx communities, perhaps because of the greater heterogeneity among predominantly Hispanic/Latinx communities. However, the models do already address differences in costs associated with English language proficiency; it may be that this variable captures the additional costs of educating students in ethnically isolated schools.
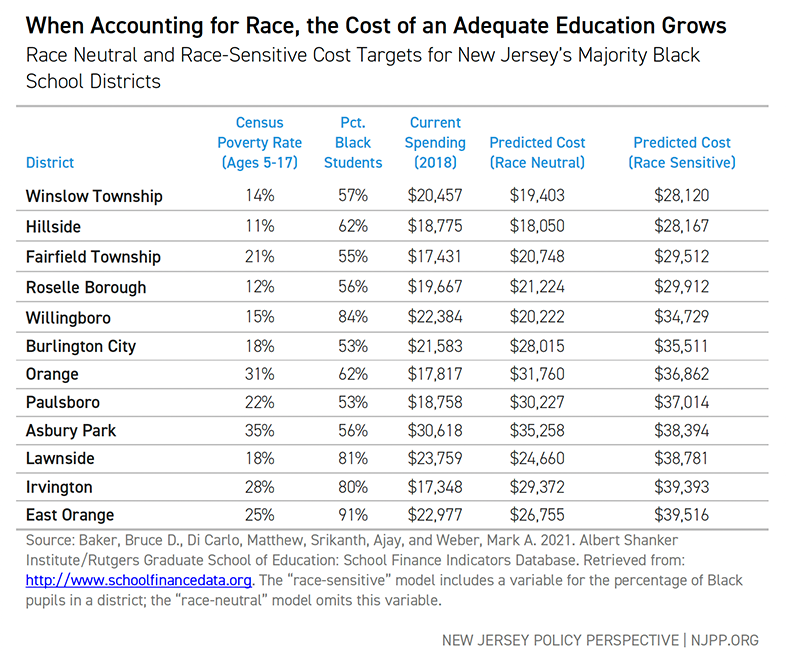
The following table provides alternative estimates of the per-pupil costs to achieve common (Massachusetts average) outcomes in reading and math using both a race-neutral cost model and a model that accounts for the percentage of Black students enrolled in a school district. Estimates are provided for New Jersey’s majority Black districts. East Orange, for example, spent just under $23,000 per pupil in 2018 and was estimated by the race-neutral model to require $26,755 to achieve Massachusetts mean outcomes. But, when taking race into account, that figure jumps to nearly $40,000 per pupil.
The margins of difference in the cost estimate when taking race into account are substantial; however, this is what our model, based on actual data, estimates is required to bring those districts into line with expected outcomes. The state should strive to achieve these spending targets, with consideration for race, through a school funding policy that ensures these targets can be reached at equitable taxation.
School Finance Reform: The Case for Reparations
Some might argue the approach of this report imposes a deficit orientation on Blackness and Black communities: that the assumption is that because a community or its schools have more Black students, they need additional resources. However, the deficit that exists today is the result of systemic and well-documented patterns of discrimination and segregation, which led to racial isolation, lost wealth, and opportunity denied through generations. This deficit is not simply an evil of the past: it continues to have profound effects on Black and Hispanic/Latinx students and communities right now. Providing aid to counter these multi-generational effects is a correction to a deficit imposed through racism; in effect, it is a reparation.
The term “reparation” is often used to describe payments specifically to Black family descendants of enslaved people, calculated in an amount to represent their financial losses resulting from enslavement. This report, however, presents a broader use of the term in response to the systemic racism of the recent past and present. The segregation and discrimination which has plagued New Jersey’s and our nation’s schools and communities has significant financial and educational consequences for Black and Hispanic/Latinx taxpayers and schoolchildren. Allocating funds to remove the funding gaps between school districts is one way to correct the educational disparities that have arisen due to systemic racism.
New Jersey remains highly segregated by race and income: the state has larger shares of students enrolled in majority Hispanic/Latinx and majority Black school districts than Connecticut or Massachusetts. While New Jersey has succeeded more than the other two states at progressively allocating state aid to reduce funding gaps, New Jersey’s current state aid to schools remains insufficient to fully close gaps in educational opportunity or fully mitigate racial inequities in property taxation.
Given this reality, this report presents four recommendations for New Jersey:
- New Jersey should develop measures to monitor wealth gaps by race and inequitable taxation on that wealth and consider developing a reparations package to provide tax relief to overtaxed Black and Hispanic/Latinx homeowners.
- New Jersey must commit to fully funding its state school funding formula, the School Funding Reform Act (SFRA). For over a decade, the state has refused to fund its own school funding law. Any meaningful reform of school funding must begin with the state meeting the obligations it has set for itself.
- New Jersey should recalibrate that formula to address current student needs and costs with respect to updated outcome goals. Only then will we know the extent to which SFRA is sufficient to offset racial disparities in taxation and equal opportunity to achieve common outcomes, such as the average test scores of Massachusetts.
- The recalibration of SFRA should include consideration of the additional costs associated with providing equal opportunity to achieve common outcome goals in the state’s racially isolated neighborhoods and schools. These costs may be identified through cost modeling methods like those cited herein and are consistent with recent studies of education costs and cost variation nationally[28] as well as in Kansas,[29] Vermont,[30] and New Hampshire.[31]
In addition, recent reporting finds that New Jersey faces an unexpected and substantial budget surplus.[32] The state should take this opportunity to address historic and system racism in school funding, to provide equitable educational opportunities for all students.
End Notes
[1] Weber, M., & Baker, B. D. (2020, November 17). School Funding in New Jersey: A Fair Future for All. New Jersey Policy Perspective. https://www.njpp.org/publications/report/school-funding-in-new-jersey-a-fair-future-for-all/
[2] Weber, M., & Baker, B. D. (2020, November 17). School Funding in New Jersey: A Fair Future for All. New Jersey Policy Perspective. https://www.njpp.org/publications/report/school-funding-in-new-jersey-a-fair-future-for-all/
[3] Andre M. Perry, Jonathan Rothwell, and David Harshbarger (2018). The devaluation of assets in Black neighborhoods. Brookings Institute. https://www.brookings.edu/research/devaluation-of-assets-in-black-neighborhoods/
[4] Weber, M. (2020, October 7). New Jersey’s School Re-openings Are Racially Unequal. New Jersey Policy Perspective. https://www.njpp.org/publications/blog-category/new-jerseys-school-re-openings-are-racially-unequal/
[5] Baker, B., & Cotto Jr, R. (2020). The under-funding of Hispanic/Latinx-serving school districts. Phi Delta Kappan, 101(6), 40-46. https://kappanonline.org/underfunding-Hispanic/Latinx-serving-school-districts-baker-cotto/
Baker, B. D., Srikanth, A., Green III, P. C., & Cotto, R. (2020). School funding disparities and the plight of Hispanic/Latinx children. Education Policy Analysis Archives, 28, 135. https://doi.org/10.14507/epaa.28.5282
[6] Aspen Institute. Glossary for Understanding the Dismantling Structural Racism/Promoting Racial Equity Analysis. Roundtable on Community Change. https://www.aspeninstitute.org/wp-content/uploads/files/content/docs/rcc/RCC-Structural-Racism-Glossary.pdf
[7] Oberfield, Z., Baker, B.D. (2021) Redistributing opportunity: The politics of progressive school spending (working paper); Chow, Kat. (June 8, 2018) Why More White Americans Are Opposing Government Welfare Programs. NPR. https://www.npr.org/sections/codeswitch/2018/06/08/616684259/why-more-white-americans-are-opposing-government-welfare-programs; Blake, J. (March 6, 2021). A drained swimming pool shows how racism harms White people, too. CNN. https://edition.cnn.com/2021/03/05/us/heather-mcghee-racism-white-people-blake/index.html
[8] Orfield, G., Ee, J., & Coughlan, R. (2017). New Jersey’s Segregated Schools (p. 43). The Civil Rights Project. https://www.civilrightsproject.ucla.edu/research/k-12-education/integration-and-diversity/new-jerseys-segregated-schools-trends-and-paths-forward/New-Jersey-report-final-110917.pdf
[9] Weber, M., & Baker, B. D. (2020, November 17). School Funding in New Jersey: A Fair Future for All. New Jersey Policy Perspective. https://www.njpp.org/publications/report/school-funding-in-new-jersey-a-fair-future-for-all/
[10] Baker, B. D., Weber, M. A., Srikanth, A., Kim, R., & Atzbi, M. (2018). The real shame of the nation: The causes and consequences of interstate inequity in public school investments. Rutgers, The State University of New Jersey. http://www.schoolfundingfairness.org
[11] New Jersey “equalizes” property values when calculating state aid to schools as a way to account for differences between communities in how they assess their property values. Cities and towns may choose to assess property values below, at, or above going market prices; equalization allows for more valid comparisons by comparing assessed values to listed selling prices in each community and adjusting property values accordingly.
[12] Robert K. Nelson, LaDale Winling, Richard Marciano, Nathan Connolly, et al., “Mapping Inequality,” American Panorama, ed. Robert K. Nelson and Edward L. Ayers, accessed June 12, 2021, https://dsl.richmond.edu/panorama/redlining/#loc=12/40.78/-74.295&mapview=graded&city=essex-co.-nj&area=D4
[13] Gans, H. J. (1982). The Levittowners: Ways of life and politics in a new suburban community. Columbia University Press.
[14] Patterson, M.J. (2012) On the Frontlines of Freedom: A Chronicle of the First 50 Years of the American Civil Liberties Union of New Jersey. Excerpt retrieved from: https://www.aclu-nj.org/about/50thanniversary/on-the-frontlines-of-freedom/on-the-frontlines-of-freedom-chapter-one-1
[15] Levitt & Sons, Inc. v. Div. Against Discrimination, Etc., 31 N.J. 514 (1960), 158 A.2d 177.
[16] Linmark Associates, Inc. v. Willingboro, 431 U.S. 85, 97 S. Ct. 1614, 52 L. Ed. 2d 155 (1977).
[17] Guliano, B. D. (1977). Banning of For Sale Signs and Its Effect on Fair Housing: Linmark Associates v. Township of Willingboro. Conn. L. Rev., 10, 980. “The percentage of nonwhites included in the population of Willingboro rose from 0.5% in 1960 to 11.7% in 1970 and to 18.2% in 1973. At the same time the white population showed a numerical decline from 38,326 in 1970 to 36,485 in 1973.” (p. 985)
[18] Rose, H. M. (1965). The all-Negro town: Its evolution and function. Geographical Review, 55(3), 362-381.
[19] Romisher, J. E. (2018). Youth Activism and the Black Freedom Struggle in Lawnside, New Jersey (Doctoral dissertation, Arts & Social Sciences: Department of History).
[20] Rasmussen, C. (2017). Creating segregation in the era of integration: School consolidation and local control in New Brunswick, New Jersey, 1965–1976. History of Education Quarterly, 57(4), 480-514.
[21] McCann, Adam (Jan 12, 2021). “States with the Most Racial Progress.” https://wallethub.com/edu/states-with-the-most-and-least-racial-progress/18428
[22] Putterman, Alex (February 19, 2021) “West Hartford is mostly white, while Bloomfield is largely Black; how that came to be tells the story of racism and segregation in American suburbs.” Hartford Courant. https://www.courant.com/news/connecticut/hc-news-west-hartford-bloomfield-housing-segregation-discrimination-20210214-eoobsguoybguznkoa4n2ravwli-story.html
[23]Baker, B.D., Di Carlo, M., Weber, M. (2021) The Adequacy of School District Spending in the U.S. Albert Shanker Institute. https://www.schoolfinancedata.org/wp-content/uploads/2021/03/SFID_DCDbrief_Mar2021.pdf
[24] Weber, M., & Baker, B. D. (2020, November 17). School Funding in New Jersey: A Fair Future for All. New Jersey Policy Perspective. https://www.njpp.org/publications/report/school-funding-in-new-jersey-a-fair-future-for-all/
[25] Note that the “Current Spending” figure is inclusive of the spending of federal and other revenues, and will therefore differ from the figures in the previous table.
[26] “The Nation’s Report Card,” National Assessment of Educational Progress. National Center for Education Statistics. https://www.nationsreportcard.gov/profiles/stateprofile?chort=1&sub=MAT&sj=&sfj=NP&st=MN&year=2019R3
[27] Baker, B. D. (2011). Exploring the sensitivity of education costs to racial composition of schools and race-neutral alternative measures: A cost function application to Missouri. Peabody Journal of Education, 86(1), 58-83.
Baker, B. D., & Green III, P. C. (2009). Equal educational opportunity and the distribution of state aid to schools: Can or should school racial composition be a factor? Journal of Education Finance, 34(3), 289-323.
Green, P., Baker, B., & Oluwole, J. (2008). Achieving racial equal educational opportunity through school finance litigation. Stanford Journal for Civil Rights and Civil Liberties, 4, 283-338.
[28] Baker, B.D., Di Carlo, M., Weber, M. (2021) The Adequacy of School District Spending in the U.S. Albert Shanker Institute. https://www.schoolfinancedata.org/wp-content/uploads/2021/03/SFID_DCDbrief_Mar2021.pdf
[29] Taylor, L.L., Jason Willis, Alex Berg-Jacobsen, Karina Jaquet, and Ruthie Caparas. (2018) Costs Associated with Reaching Student Achievement Expectations for Kansas Public Education Students: A Cost Function Approach. San Francisco: WestEd.
[30]Kolbe, T., Baker, B.D., Atchison, D., Levin, J. (2019) Pupil Weighting Factors Report. State of Vermont, House and Senate Committees on Education. https://legislature.vermont.gov/assets/Legislative-Reports/edu-legislative-report-pupil-weighting-factors-2019.pdf
[31] Baker, B.D., Atchison, D., Levin, J., Kearns, C. (2020) New Hampshire Commission to Study School Funding: Final Report. https://carsey.unh.edu/sites/default/files/media/2020/09/20-12685_nh_final_report_version_v5_draft_1.pdf
[32] Reitmeyer, John (June 10, 2021). “NJ has an extra $10 billion. The question is what to do with it.” NJ Spotlight News. https://www.njspotlight.com/2021/06/nj-has-an-extra-10-billion-the-question-is-what-to-do-with-it/