In this report, Dr. Bruce D. Baker of Rutgers University analyzes the impact of New Jersey’s School Funding Reform Act (SFRA) over the last decade and recommends policies that would strengthen the law and improve the state’s school funding system.
To read a PDF version of the full report click here.
To read a PDF version of the report summary, click here.
New Jersey’s School Funding Reform Act (SFRA) of 2008 was never a perfect law; in many ways, however, it remains a model state school finance policy:
- SFRA directs more funding toward the students who need it the most. Under SFRA, New Jersey distributes state aid more progressively across local public school districts with respect to students’ needs.
- SFRA directs more funding toward the school districts that can’t raise enough revenue locally. Because of SFRA, New Jersey distributes state aid progressively with respect to local income and property wealth, which serve as measures of local capacity to adequately fund schools.
Unfortunately, SFRA has been undermined by several factors through the years during and following the economic recession of 2008, including:
- Cuts and freezes to state aid. These cuts have led to larger and large shares of children attending districts falling well short of their adequacy budget targets.
- Failure to enforce a minimum local fair share. The failure to make sure each district raises its “fair share” of school funding through local taxes leaves some districts with even larger gaps between current spending and adequacy targets.
- Local property tax increase caps. These caps prohibit districts that are levying less than their required local effort – and spending less than adequacy targets – from raising their local property taxes so as to adequately fund their schools.
Figure 1: Total Student Enrollment by School District Adequacy (2008-2018)
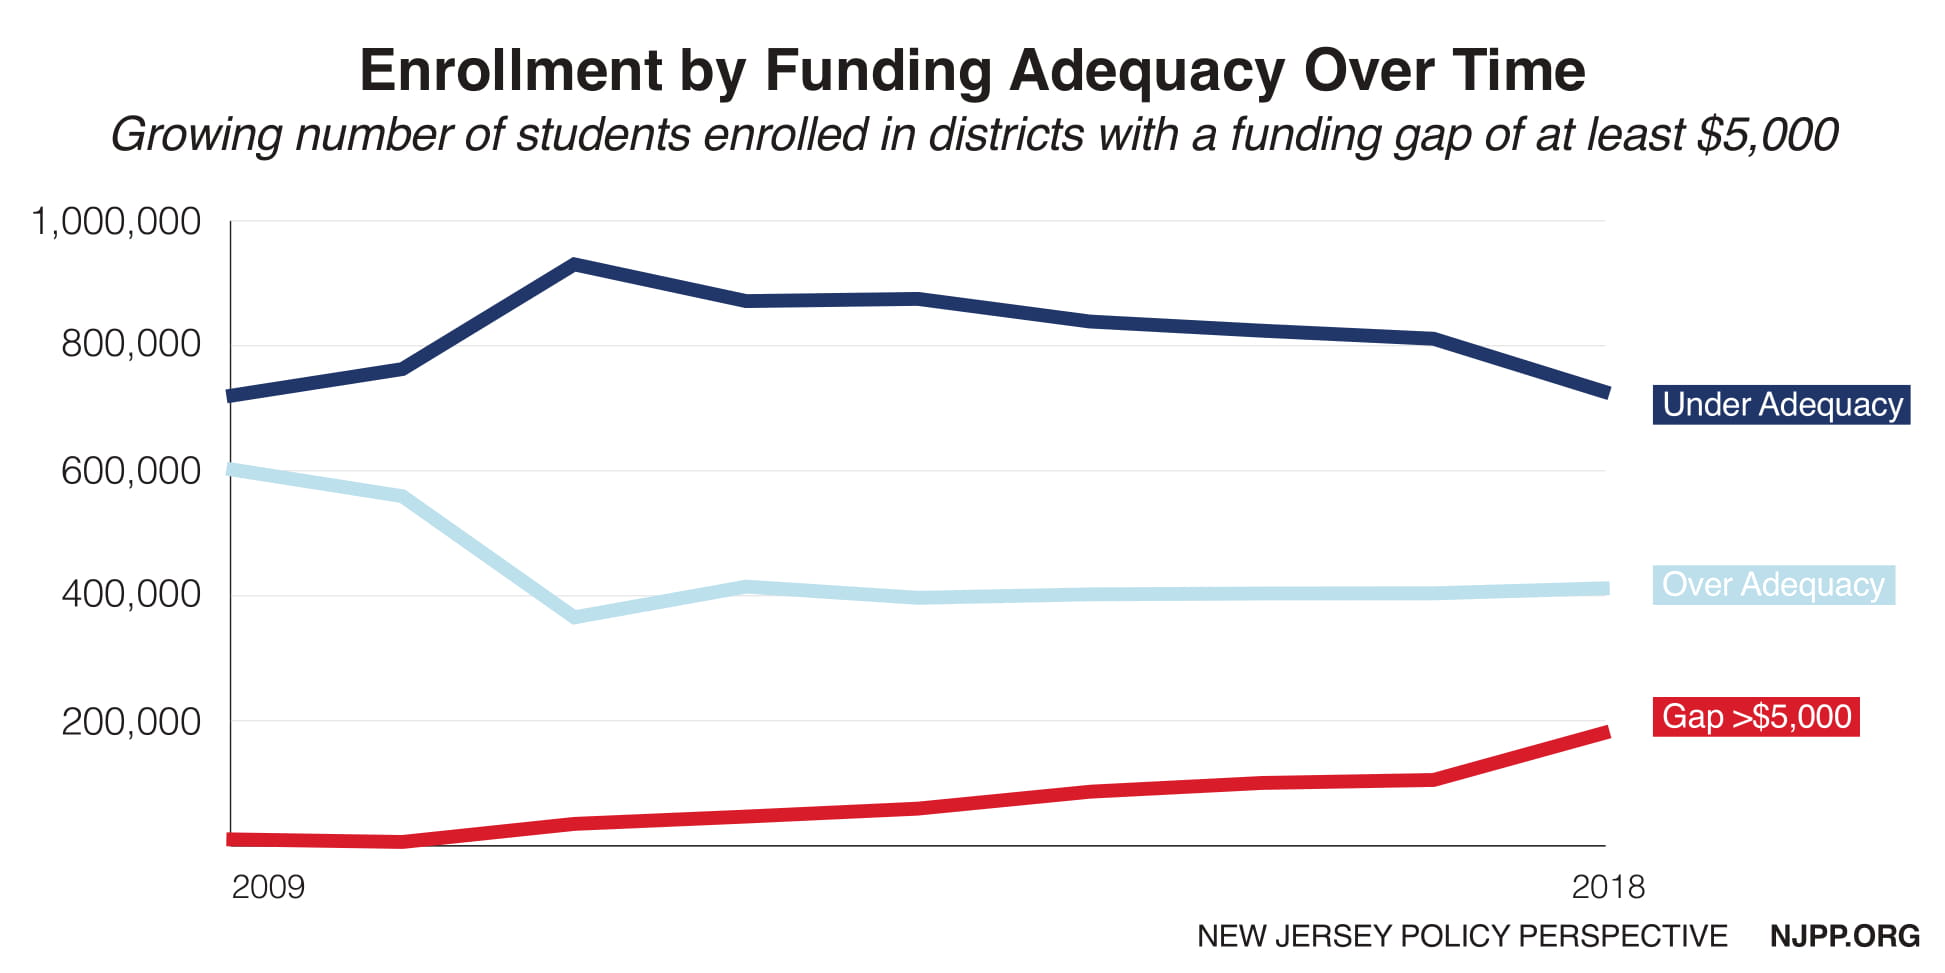
Figure 1 shows the numbers of children attending districts that are below adequacy and more than $5,000 per pupil below adequacy.[1] About 800,000 children attend districts below adequacy and nearly 200,000 children attend districts with adequacy gaps greater than $5,000 per pupil. These gaps alone require a minimum of $1 billion to close.
Rise and Fall of Progressive School Funding in New Jersey
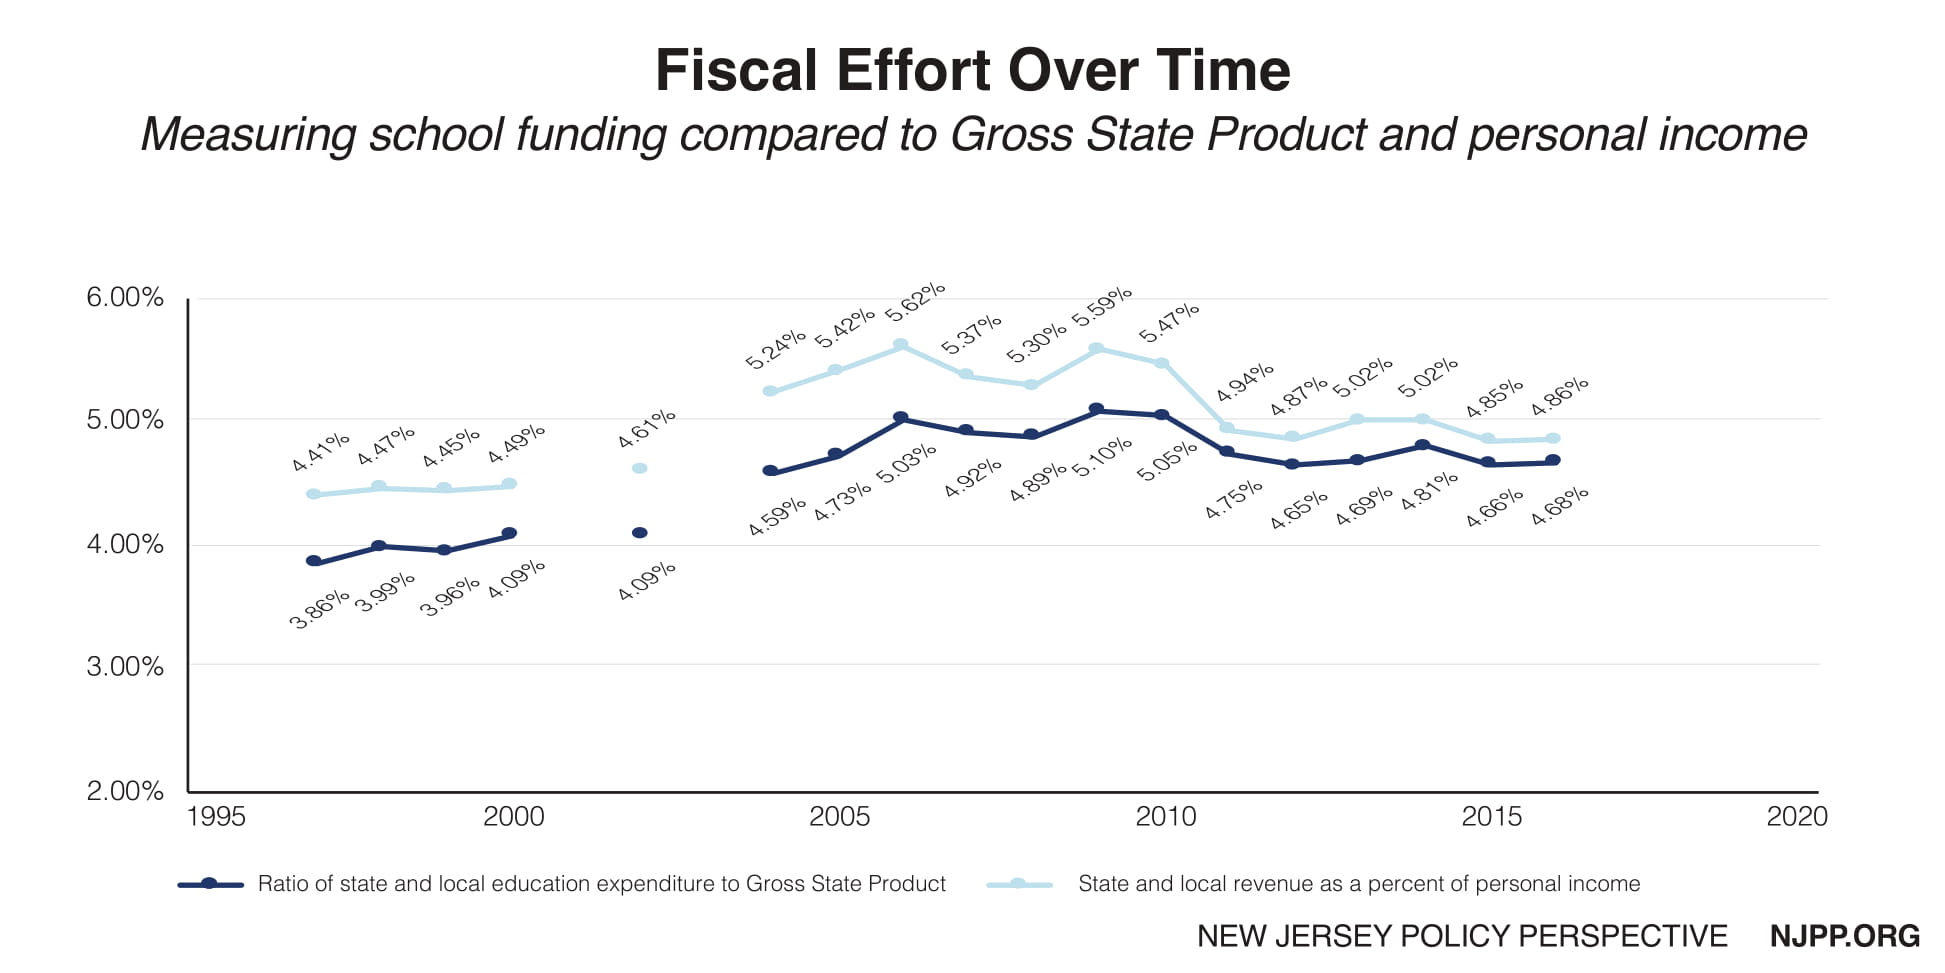
New Jersey reached its highest school funding effort level around 2009 with respect to GDP/State and 2006 with respect to personal income. Since that time, effort has declined, including a sharp decline from 2010 to 2012. Current effort levels are back to early 2000s levels, about halfway between their peak and pre-1998 levels. In 2015, New Jersey ranked 5th in the share of aggregate personal income spent on elementary and secondary education.
Figure 2: NJ School Funding Effort Levels (1996-2016)
How School Funding Affects Student Achievement
Figure 3: Average PARCC Scores by SFRA Adequacy Group (2015-2017)
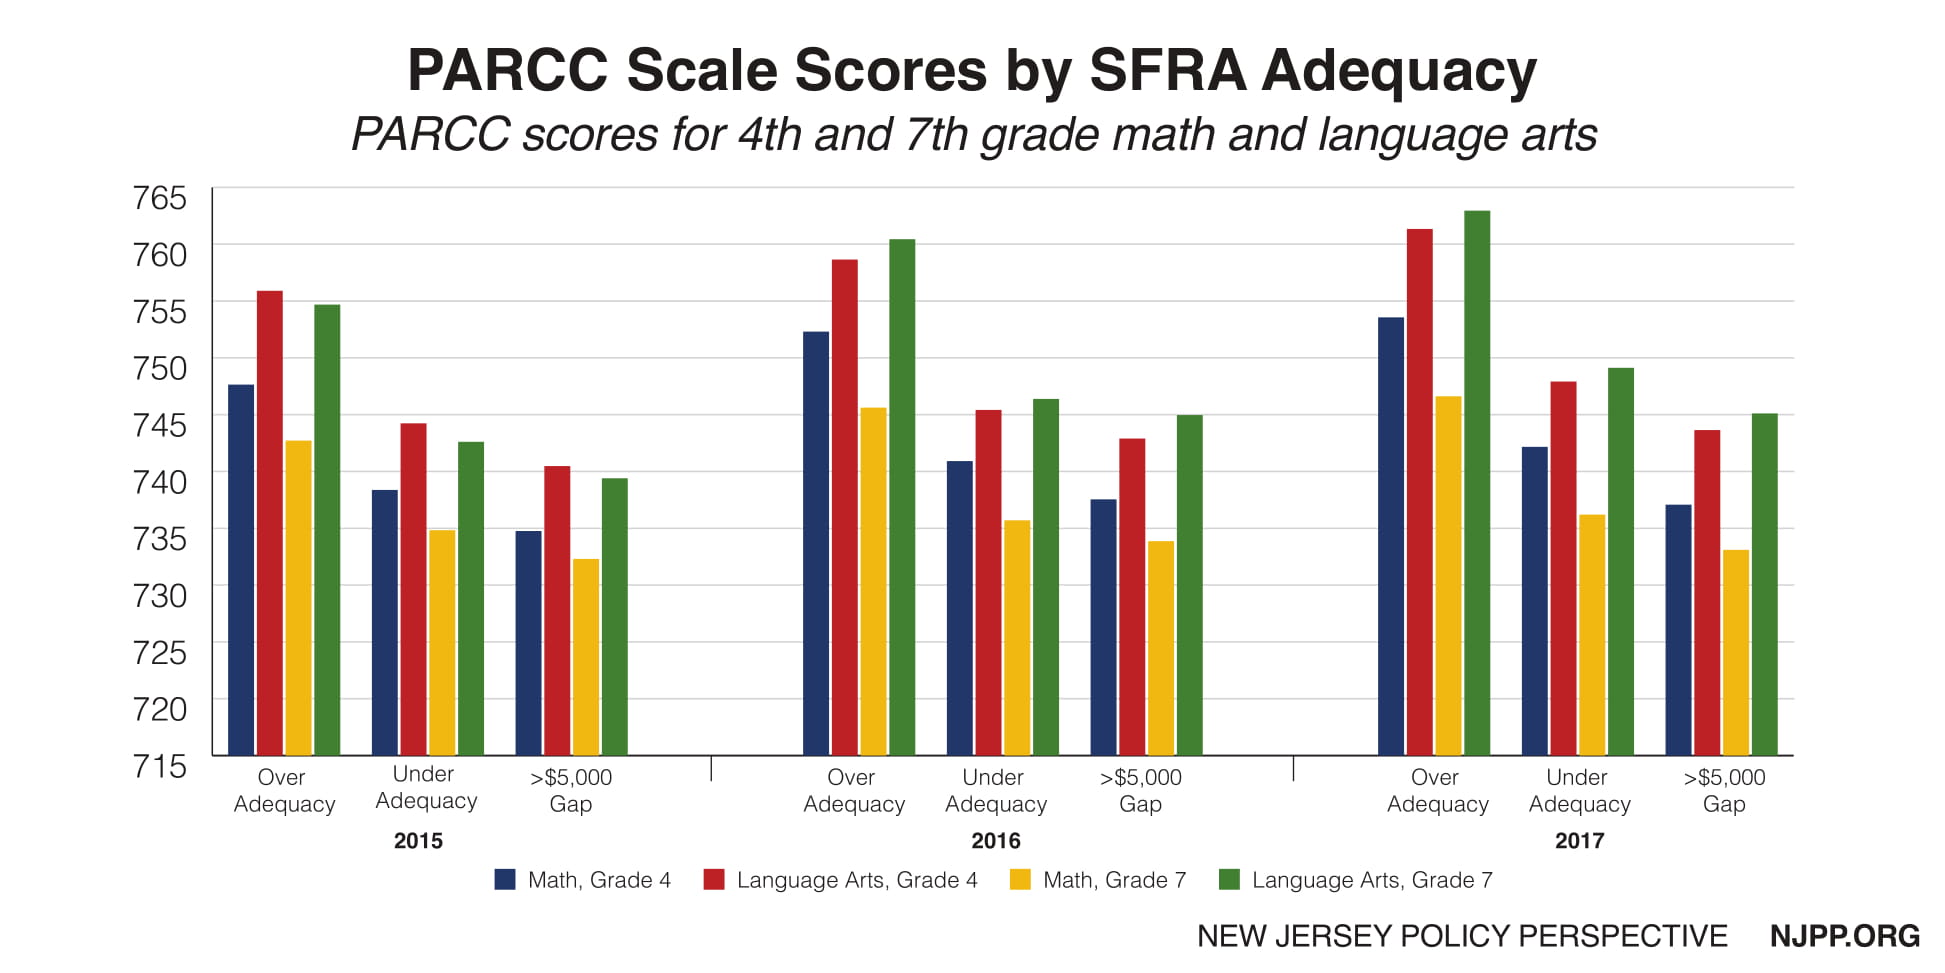
Figure 3 summarizes average PARCC scores for the past three years, showing lower average scores in schools in districts with larger adequacy gaps. Admittedly, this relationship is, to an extent, circular: districts serving higher-need populations tend to have lower scores, and also tend to have larger adequacy gaps. But therein lies the point. The goal of a progressive school finance formula is to leverage additional resources in order to assist in closing the funding gaps – and therefore, the outcome gaps between high-need and low-need districts. National data shows SFRA has helped to shrink these gaps – but state data shows New Jersey’s school funding system is still falling short of what is needed to equalize educational opportunity.
School Funding: New Jersey vs. the Nation
The evidence is clear: school funding matters. The maps below show how spending and outcomes are related in the lowest-poverty and highest-poverty districts.
The map in Figure 4 is based on a statistical model, using national data, that calculates how much the lowest-poverty districts (bottom 20 percent in poverty) actually spend compared to how much they would need to spend to achieve average national test outcomes. Darker green indicates more spending. The map in Figure 5 shows test score outcomes; darker blue indicates higher outcomes.
New Jersey’s most affluent districts make large investments in their schools compared to similar districts in other states. As a consequence, New Jersey’s lowest-poverty districts have some of the highest test score outcomes in the nation. New Jersey’s wealthiest districts spend more on their schools and get exceptional outcomes in return.
Figure 4: Spending Gaps for Lowest Poverty School Districts
Figure 5: Test Score Outcomes for Lowest Poverty School Districts
What about the New Jersey districts with the highest levels of poverty (top 20 percent)? As the map in Figure 6 shows, these high-poverty districts still don’t spend enough to match the districts with the lowest levels of poverty (darker red indicates lessspending than what is needed to attain average test outcomes). Nonetheless, as the map in Figure 7 shows, these least affluent districts still come close to matching national average educational outcomes (as indicated by the tan color, which signifies average outcomes).
Figure 6: Spending Gaps for Highest Poverty School Districts
Figure 7: Test Score Outcomes for Highest Poverty School Districts
Overall, New Jersey is in a good position with respect to the rest of the nation: the state is able to shoot for much higher than prior year national average outcomes. But a sustained commitment to adequate and equitable funding is necessary for the state to provide allof its students with equal educational opportunity.
Solutions to Improve SFRA
Short Term:
- Fully funding the SFRA formula to meet its adequacy targets.
- Requiring districts to fully fund their local fair share if they fall below adequacy targets.
- Using a competitive wage growth index instead of a consumer price index. New Jersey can only maintain a high-quality teacher workforce if it offers competitive wages. Keeping those wages competitive requires tying them to the wage increases of other college-educated professionals.
Medium Term:
- Replacing the current Geographic Cost Adjustment (GCA) factor (which is applied at the county level) with a similarly determined adjustment (Taylor’s ECWI) applied at the labor market level, to remove distortions along county lines within the same labor market.
- Returning special education funding to a system based on tiers of student need, with appropriately differentiated funding based on actual distributions of children with disabilities. This change should be combined with providing 100% of special education funding through the equalization formula.
Long Term:
- Recalibrating funding targets and cost adjustments tied to current outcome goals. Using current data and applying more rigorous cost analysis methods, New Jersey should reexamine the levels of resources needed for schools and districts to efficiently achieve its current educational goals.
- Reconsidering the role of charter schools and how they affect public school funding. The state should direct funding to charter schools based on costs and needs while simultaneously assessing their fiscal impact on the efficiency of the entiresystem of public schools.
- Integrating pre-K funding into the SFRA model.
- Considering a statewide, SFRA-like formula for financing the state’s community college system. This would enable the provision of free, equitable and adequate two-year public college programs for all who wish to attend.
2019 is the year to act – to create better schools and better lives for the children of New Jersey. This report provides a starting point for the Murphy administration and the Legislature to enact legislation that will lead to a better statewide school funding system and a better education for all of New Jersey’s students.
Endnotes
[1]As calculated in this report.