To read a PDF version of this report, click here.
Gov. Christie has proposed a radical change to New Jersey’s school aid formula that would dismantle four decades of efforts to target school aid to districts that serve concentrations of children from poor families. Labeled the “Fairness Formula,” his proposal is rooted in the argument that lower-income districts have failed so completely after decades of generous state funding that it’s time to reallocate their funds to more successful districts. In brief, he seeks to use school aid to lower property taxes in middle-income and wealthy districts at the expense of districts serving kids from poor families.
In September, the governor petitioned the New Jersey Supreme Court to reverse the court’s 40 years of strong decisions establishing that the state constitution mandates that the state provide funding to address the consequences of concentrated poverty in selected districts. He requests, moreover, that the court nullify statutes dealing with teacher tenure and to overturn collective bargaining contracts. Elsewhere, he described the continuation of funding for urban districts as “criminal.”
Of course, there is no way to predict how the Court will respond to the governor’s petition. One cannot guarantee a quick dismissal, and even if there is one, this issue won’t necessarily go away. The governor could go so far as to incorporate his formula in his 2018 budget proposal, which would be followed two days later with official notices to districts of their expected aid. But assuming that the Governor’s preferred formula would not be adopted via the legislative budget process, districts would be in a precarious position since school budgets have to be adopted in early April before the June 30 deadline for state budget adoption. Districts losing significant state aid would have to send layoff notices not later than May 15 before the budget is resolved, leading to chaos.
In the end, the governor’s proposal would reduce – even eliminate – educational opportunities for children from New Jersey’s poor and working-class families.
1. The proposal ignores indisputable evidence about the connection between poverty and educational achievement.
Beginning with the 1967 Coleman Report, there are now billions of data points that consistently point to the two factors that most heavily determine student achievement: the socioeconomic status of one’s parents and the socioeconomic status of one’s classmates. Know these two facts and one can predict with near-certainty how most students will perform on standardized tests.
The gold standard for tracking the academic achievement of large numbers of randomly selected students is the National Assessment for Educational Progress. A review of the reading and math tests in 2015 confirms that not one state’s students from poor families (its free and reduced lunch recipients) outperformed the students from middle-class and affluent families (those not eligible for subsidized lunches) in their own or any other state.[1]
New Jersey has operated since 1975 with a classification scheme to take these economic and demographic certainties into account to gauge how students in similar districts perform. Districts in the lowest grouping (“A”) have lower family incomes, parental educational and occupational levels, higher poverty and unemployment rates. Districts in the highest grouping (“J”) have low poverty rates with higher parental income and educational levels.[2] Given that there are eight groupings for reporting test results, that tests are required in seven grade levels and that there is both a math and language arts test in each grade (plus a science test in two grades), there are a total of 102 opportunities each year for districts in a lower-rated socioeconomic group to outperform a higher group. Over the two-year period of 2013 and 2014 (when there were 204 opportunities), this happened once, and by a tiny margin (by .1 of 1 percent on the scale score for high school math).[3]
A 204-to-1 bet is not a good one to place. And the notion advanced by the governor that “no child in this state is worth more state aid than another” ignores decades of evidence that schools with concentrations of children from poor families in fact face more daunting educational challenges.[4]
2. Children in urban districts are the innocent victims since the districts are unprepared to contend with devastating cuts in state aid.
By far, the biggest losers under Gov. Christie’s plan would be the 31 school districts formerly called the “Abbott” districts (based on 21 New Jersey Supreme Court decisions between 1985 and 2011). These districts educate about 20 percent of New Jersey’s students and receive about 55 percent of all state aid. Between them the districts would lose $2.5 billion in aid – a reduction of 43.6 percent.
Students in these districts are disproportionately poor, representing 41.6 percent of all students who are eligible for the free lunch program, and these districts enroll about half (47.9 percent) of the state’s English-language learner students. A majority of students in these districts (85 percent) are black and Latino, accounting for about two of every five black and Latino students in New Jersey.
And the poorer the district, the greater the loss. Gentrified Hoboken would actually see its aid increase by 20 percent; Camden – the poorest of the former Abbott districts – would lose 78.1 percent of its scheduled aid.
How a formula that would dismantle the work of districts charged with the education of the state’s most vulnerable children can be described as “fair” requires a Kafkaesque or Orwellian dictionary.
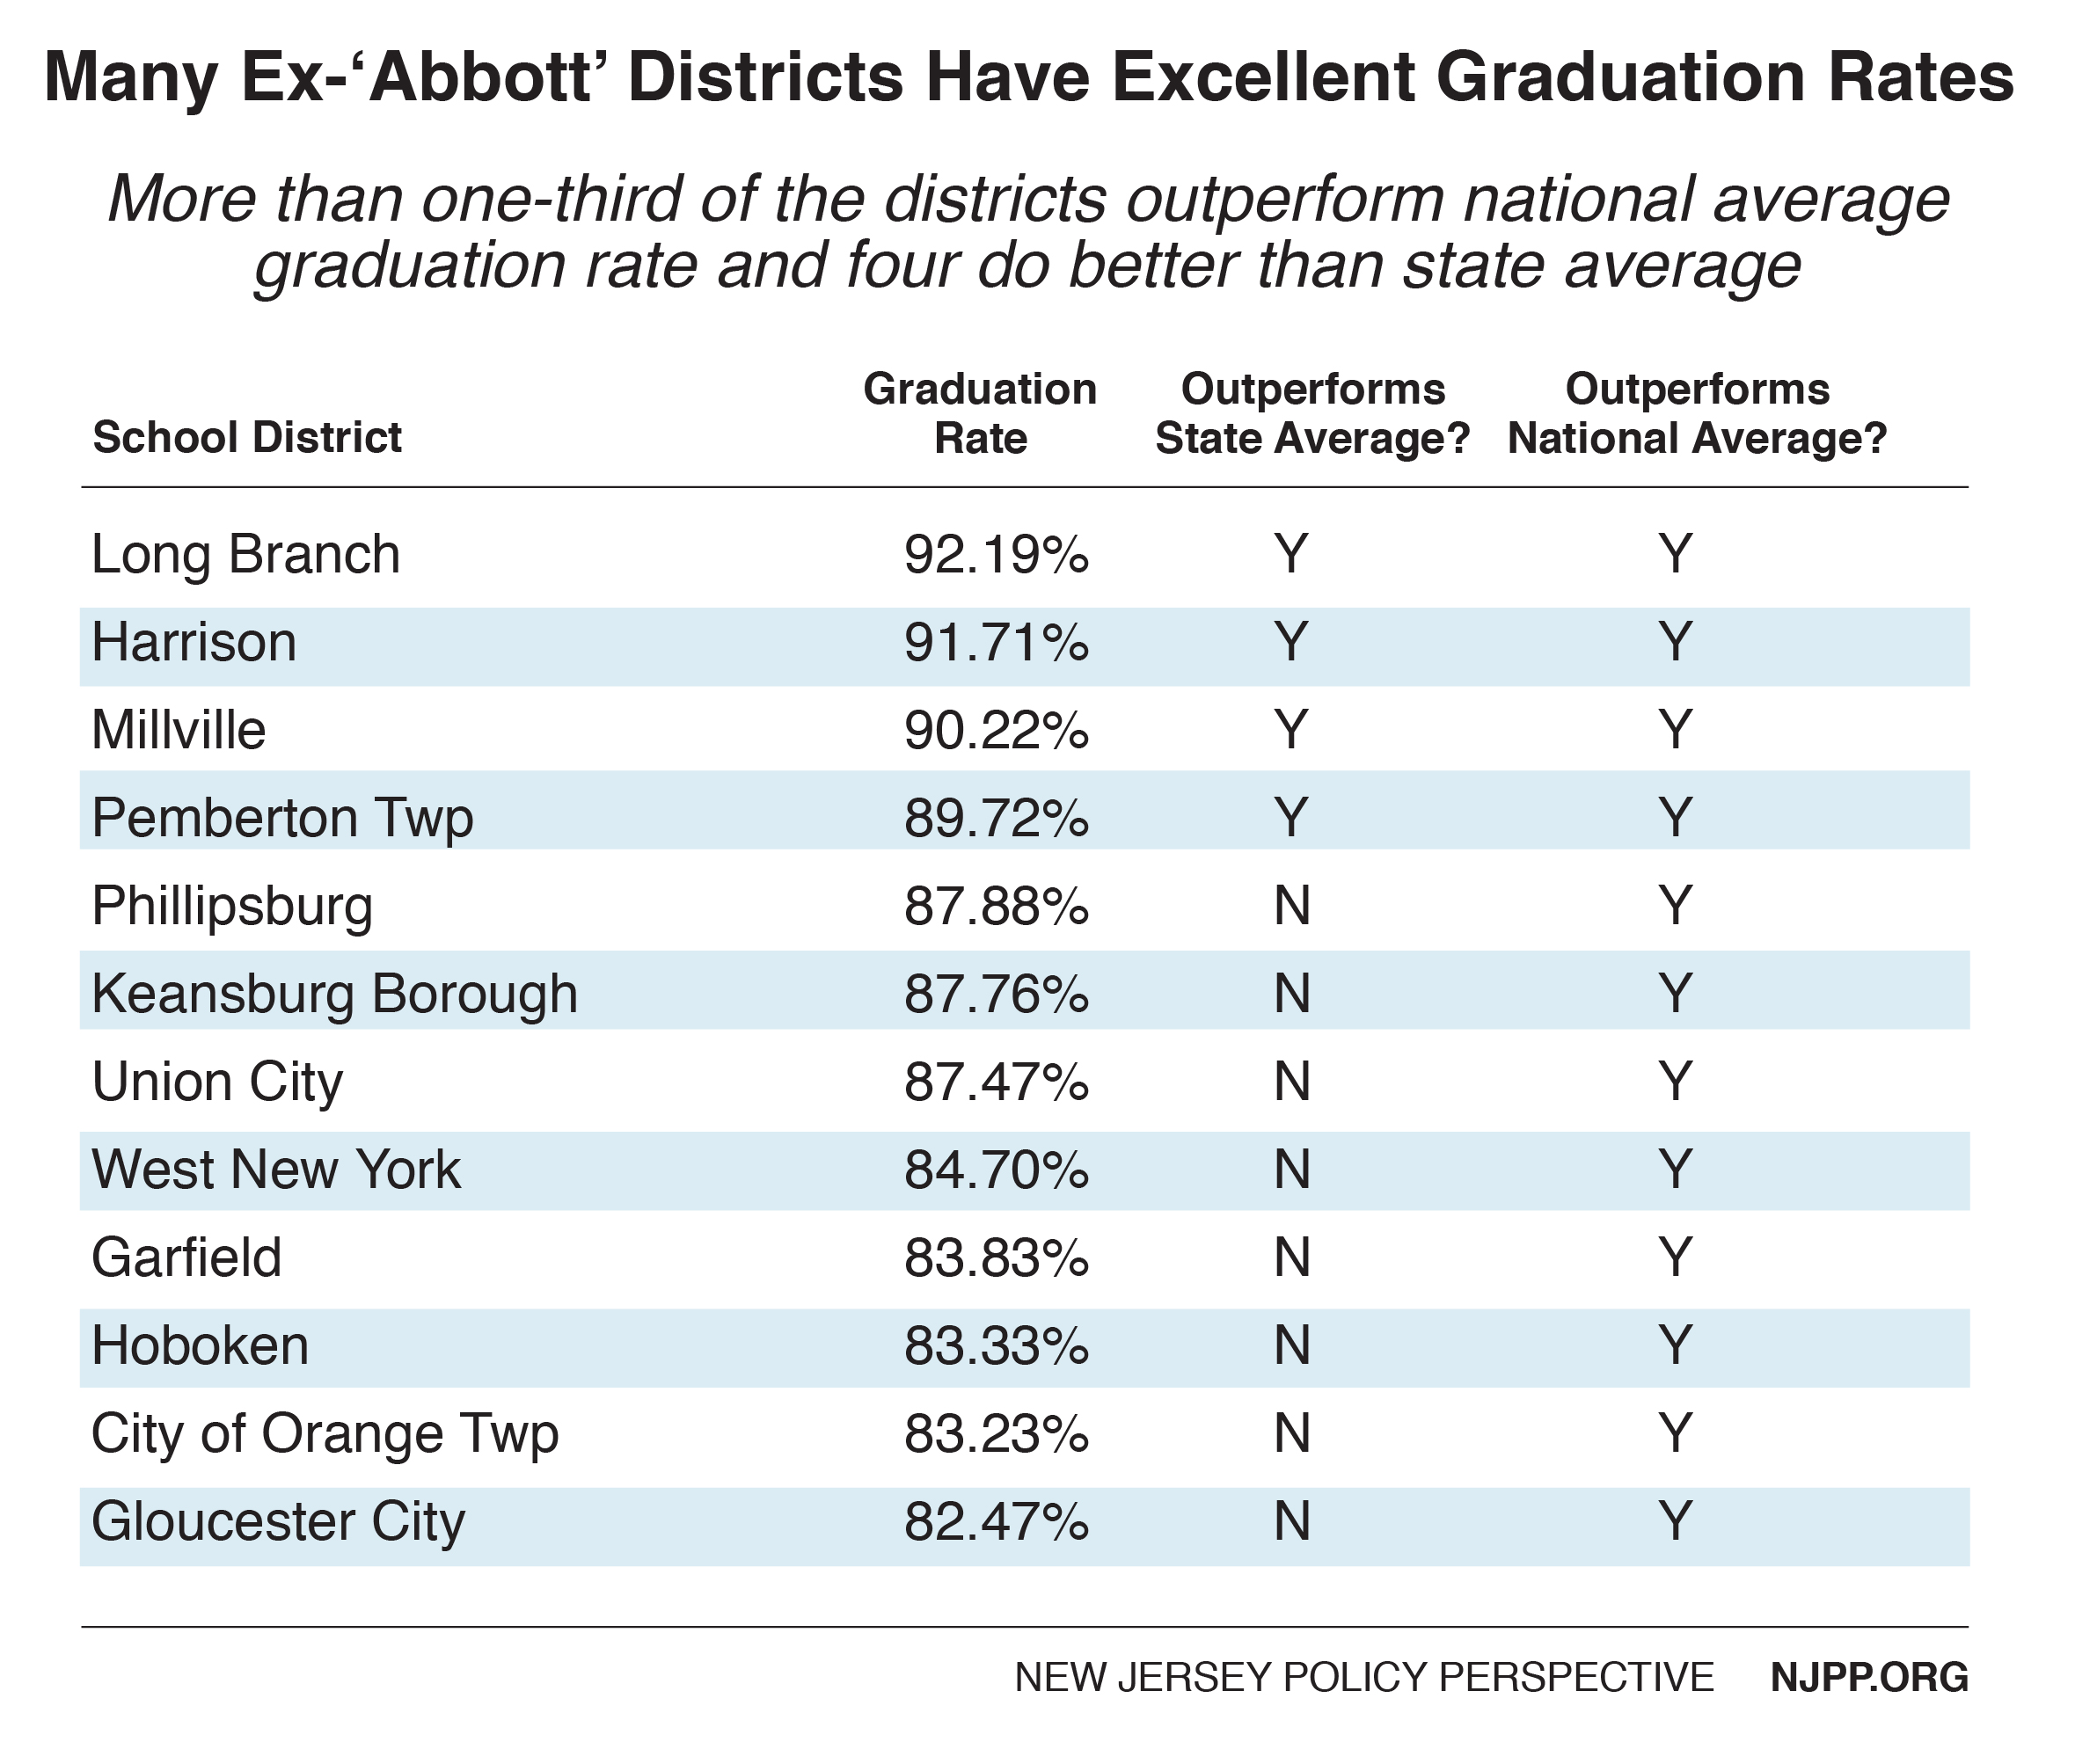
The governor’s claim of widespread failure in these districts ignores not only the indisputable difficulties of educating concentrations of poor children, but the fact that they are not uniformly poor-performing districts. In fact, more than one-third of them have a four-year average graduation rate that exceeds the national rate of 82 percent, and four of the 31 districts have a higher graduation rate than the state average (which is one of the nation’s highest).
Let’s take a look at Union City, which, as the governor has noted, comes very close to the state average for graduation rates – even with almost one-quarter of its students still learning English and one of the highest counts of children from very poor families in the state. The governor was right to spotlight Union City since it is one of the best-performing deeply poor school districts in the nation. As a reward, he proposes to slash aid to Union City by 56 percent – and offers no explanation for how the district would maintain its exceptional performance after losing more than half of its funding.
3. Children in over 100 working-class districts would also be harmed.
The governor builds his case on the court-ordered Abbott case that resulted in 31 districts receiving 55 percent of the state’s school aid. However, in his town hall tour he neglects to mention that an additional 110 school districts would also suffer a loss in state aid with the result that one-third of New Jersey’s students – not the mistaken 23 percent he cites – would go to school in districts with reduced state aid. Not surprisingly, these 110 districts also have larger shares of students from poor families and more students from non-English-speaking homes.
Take Dover in Morris County as an example. Eighty-six percent of its students are Latinos and 62 percent are free-lunch-eligible.[5] Even though it is one of the highest-performing “A” districts, it would lose one-sixth of its state aid ($6.2 million). Lindenwold in Camden County has an even higher count of very poor students (75 percent are free-lunch-eligible) and 83 percent are black and Latino.[6] Lindenwold would suffer a 19 percent reduction of $7.2 million in state aid under the governor’s proposal. Neither district could make up the loss from higher property taxes, with the result being a severe reduction in staffing and the consequences that flow from bigger class sizes and less individualized attention.
4. The proposal would spell the end of high-quality preschool for poor New Jersey families, removing an essential building block to help close the achievement gap.
The evidence is overwhelming that investing in high-quality preschool pays off better than just about any public investment. Kids from very poor families that attend good preschools are much more likely than their neighbors who do not to graduate from high school, stay out of jail and work full time.
New Jersey’s expansion of preschool opportunity is a direct result of the Abbott decisions, but the School Finance and Reform Act of 2008 extended preschool aid to another 81 districts with high counts of very poor kids. Unfortunately, the state has never paid for this preschool expansion. (The legislature in 2016 authorized a modest $25 million increase but the governor vetoed it out of the budget.)
The oft-cited excellence of the Union City schools begins with its emphasis on preschool (nine of ten Union City 3- and 4 year-olds attend) and its almost organic connection to the K-3 years. The result is that Union City’s 3rd graders outperform those in every other former Abbott district.[7] It is ironic and inconsistent that the governor would single out Union City for its excellent performance and then dismiss the foundation for that excellence – preschool – as “babysitting” and propose to effectively demolish that foundation by slashing the district’s state aid.
The governor’s blanket claim of city school failure ignores not just Union City’s progress, but that of other districts like Elizabeth, Long Branch and West New York that all educate many students from deeply poor families. All of them give special emphasis to connecting their preschool “grads” to intensive early literacy efforts in the K-3 grades.
5. The governor glosses over the root causes of New Jersey’s property tax problem.
Gov. Christie begins by arguing that the intervention of the state Supreme Court in school finance “has caused us to have the highest property taxes in the nation.” This is true: New Jersey does have the highest property taxes.
But this is also true, and unmentioned by the governor: New Jersey had the highest property taxes before the court’s orders on school finance kicked in in the 1997 fiscal year.[8]
There are many explanations for New Jersey’s historically high property taxes such as its population density, the excessive number of municipalities and school districts and its traditions of local control. For the majority of school districts, the local property tax has always been the primary source of funding – and that did not change with the court’s Abbott decisions.
The governor claims his proposal would lead to substantial property tax reductions in the state’s middle-class and affluent towns, as it would distribute state aid on a $6,599 per student basis. Nine out of the ten districts that would receive at least a 1,530 percent increase in state aid under the “Fairness Formula” are in the wealthiest groupings of the Department of Education classification scheme. In other words, the districts with the least challenging educational issues would receive the most money. Districts receiving the increased aid would be limited to using a small part of it to cover the 2 percent ceiling on increased school spending, with the balance mandated to reduce residential property taxes. To make the case clearer, assume one of those wealthy districts spends $15,000 per student with only $800 coming from the state, the balance paid via the property tax. If the governor’s plan were adopted, the district’s spending could rise to $15,300 per student but the property tax bill would be reduced by $5,499 per student, a 687 percent decrease.
However, not all of this aid will be available if the governor follows through on his pledge to protect state assistance for special education and charter schools. One might safely assume that assistance for transportation, security and health services at private religious schools would also be maintained. So, right off the top, the $6,599 number declines to no more than around $4,500 per student.
6. The governor misleads on urban charter schools.
There is a common assumption that charter and district schools – since they are located in the same municipality – educate kids from a uniform pool. They don’t.
Across the state, there are two categories of students that are noticeably missing from the charter school rolls: students who are classified with special education disabilities and English-language learners.
For example, in Newark’s district schools, 17.1 percent of students are classified for special education, including one in six with multiple disabilities or autism. The count in Newark’s charter schools is 9.7 percent, all of whom fell into the three least severe disability categories.[9]
When it comes to students who are English-language learners, the charter schools are close to AWOL. Just 0.9 of 1 percent of Newark’s charter students are English learners, while more than one in ten students (10.9 percent) in the Newark district schools are.[10] The governor’s solitary reliance on charter schools to address the problems of 141 districts receiving state aid cuts fails to even mention the need to address the education of thousands of immigrant and disabled students who are found overwhelmingly in districts suffering reductions in state aid.
To provide these contrasts between charter and district school profiles is not a blanket criticism of charter schools, nor an automatic defense of district schools. Many charters do not enroll a large enough student body to employ the highly specialized teachers and specialists to contend with large numbers of classified students, especially the severely disabled. To a lesser extent, the same prevails when it comes to educating large numbers of students not proficient in English. However, given the numbers of foreign-born families in charter-rich cities such as Paterson, Jersey City and Newark the modest to non-existent outreach by charters to English learners is noteworthy.
While charters in some cities like Newark and Camden might enroll students with similar economic profiles as students in district schools, this is not true in all major cities. In Jersey City, for example, the contrast is quite marked. Free-lunch-eligible students make up 48.6 percent of the 4,392 students enrolled in ten charters there, compared to 71.7 percent for the district as a whole.[11] The notion, therefore, that charter schools alone can make up for the slashing of district school budgets does not come close to addressing the consequences. In Jersey City’s case, the “Fairness Formula” would slash $216.7 million in aid, a cut of almost $7,800 per student or 51.8 percent.
Moreover, the core of the governor’s argument – that urban charter schools perform better than district schools for about half the money – is simply untrue. In fact, it turns out to be the reverse: charter schools receive significantly more funding than individual district schools.
The governor’s calculations fail to account for the fact that charter school funding comes directly out of their home district’s budget. They also fail to account for district payments to charter schools, out-of-district placements for special education, central office management and debt service when calculating the true cost of educating a child enrolled in an urban district.
Charter schools are protected by enabling legislation stating they will receive 90 percent of the district’s per-student operating budget. In Newark, for example, charter schools received $226 million in the 2015-6 school year to educate 13,752 students or $16,434 per student. This and other out-of-district payments, debt service and central office expenses left Newark’s public schools with $323 million to manage over 35,000 students at an average of $8,500 per K-8 students and $11,300 per high school student.[12] These numbers aren’t even close to the governor’s citation that Newark spends $22,000 for students enrolled in its district schools.
Endnotes
[1] NJPP analysis of The Nation’s Report Card 2015; available at https://www.nationsreportcard.gov/reading_math_2015/#reading/state?grade=4
[2] See New Jersey Department of Education for more detail (http://www.state.nj.us/education/finance/rda/dfg.shtml)
[3] NJPP analysis of “NJ ASK” and “HSPA” results from 2013 and 2014
[4] Gov. Chris Christie’s Office, Governor Christie: No Child Is Worth More Than Another, June 2016.
[5] NJPP analysis of New Jersey Department of Education enrollment data
[6] Ibid 4
[7] New Jersey Department of Education, Grade 3 New Jersey Assessment of Skills and Knowledge Spring 2014 – specifically the “NJASK 2014 State Summary” Excel file. Available at http://www.state.nj.us/education/schools/achievement/14/njask3/
[8] The Public Policy Institute of New York State, Just the Facts: Key Economic and Social Indicators for New York State, (1999-2000) http://www.ppinys.org/jtf99/table23.htm
[9] New Jersey Department of Education, 2015 Special Education Data – specifically the “District Classification Rates, Ages 3-21” Excel file. Available at http://www.state.nj.us/education/specialed/data/2015.htm
[10] NJPP analysis of New Jersey Department of Education enrollment data
[11] NJPP analysis of New Jersey Department of Education enrollment data
[12] Newark Public Schools, Budget Presentation, pp. 10-11.