On March 25, 2013, New Jersey Governor Chris Christie announced that the state would take over the Camden City School District, making Camden the fourth New Jersey district to come under state control following Jersey City (1989), Paterson (1991), and Newark (1995). Under state takeover, the Camden school board was relegated to advisory status to a state-appointed superintendent, who assumed the powers customarily held by the board of education and reported directly to the state commissioner of education.[i]
Over the subsequent eight years, the state implemented substantial changes in the district, some despite community opposition. These changes included closing eight Camden public schools and eliminating more than a thousand teaching and other staff positions.[ii] In June 2021, another three public schools are slated to close and up to 75 additional positions may be eliminated.[iii]
This report examines the impact of the state’s takeover on students’ standardized test scores, the criteria used most consistently by Camden’s state-appointed superintendents to gauge performance. The analysis finds no evidence that state control of the district improved standardized test scores in Camden.
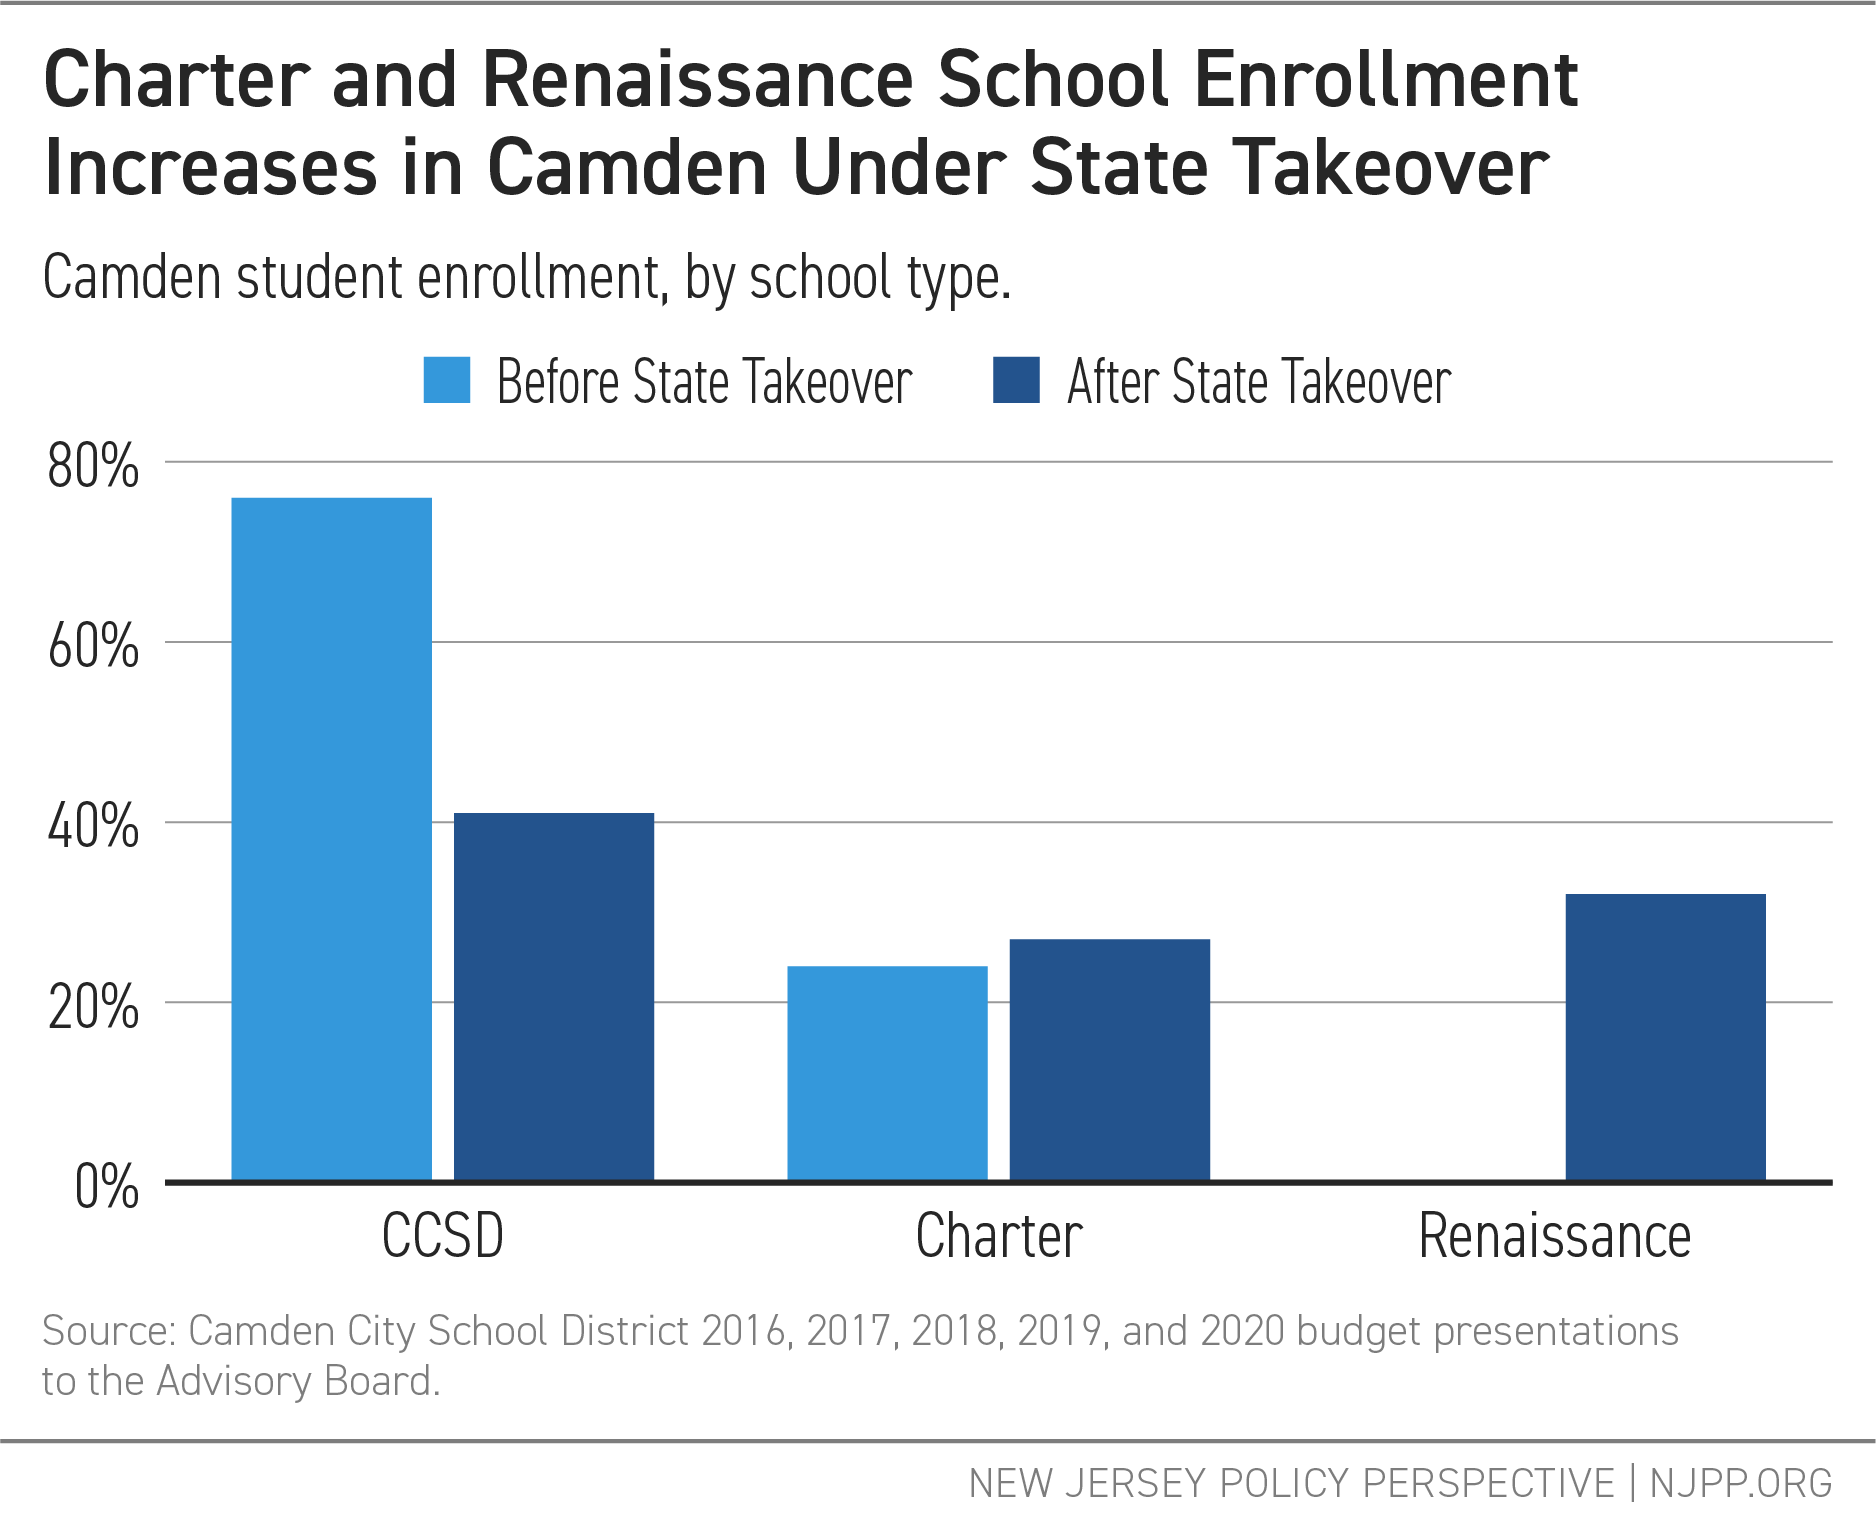
State Takeover’s Impact on the Composition of Camden School Enrollment
At the time of the takeover, 76 percent of Camden residents attending publicly funded schools were enrolled in the Camden City School District, with the remaining 24 percent enrolled in Camden-based charter schools. In September 2014, a new type of school opened in Camden, renaissance schools, which were managed by three charter school networks under long-term contracts with the district.[iv] By the 2019-20 academic year, Camden district enrollment had dropped to 41 percent, while renaissance school enrollment increased substantially to 32 percent, and traditional charter school enrollment increased slightly to 27 percent.[v]
State Takeover’s Impact on Camden Student Performance
This analysis of the impact of the state takeover on students’ standardized test scores combines data from district, renaissance, and traditional charter schools. This was done to reflect the large percentage of Camden students enrolled in renaissance and traditional charter schools and the ongoing movement of Camden students among the three types of publicly funded schools.[vi]
To estimate the impact of the state takeover on student test scores, this analysis examines the pattern of Camden student scores before and after the takeover against those from comparable school districts to separate the effect of the takeover from general trends that could impact test performance, such as changes to the standardized tests or broader economic conditions that reduce poverty.
Figures 1 and 2 illustrate the math and English Language Arts (ELA) standardized test scores of Camden’s district, renaissance, and traditional charter school students versus those of three separate comparison groups in the years before and after the state takeover. The solid vertical line indicates the 2012-13 school year, which was the last school year before the state government fully took over the Camden City School District. To compare test scores across school years, the y-axis represents normalized test scores by converting each school’s test score into standard deviations from the average performing New Jersey school. This change is important because, starting in the 2014-2015 school year, New Jersey switched from using the New Jersey Assessment of Skills and Knowledge (NJASK) standardized assessment to the Partnership for Assessment of Readiness for College and Careers (PARCC).
Figure 1: 3rd and 4th Grade Normalized Test Scores Before and After State Takeover
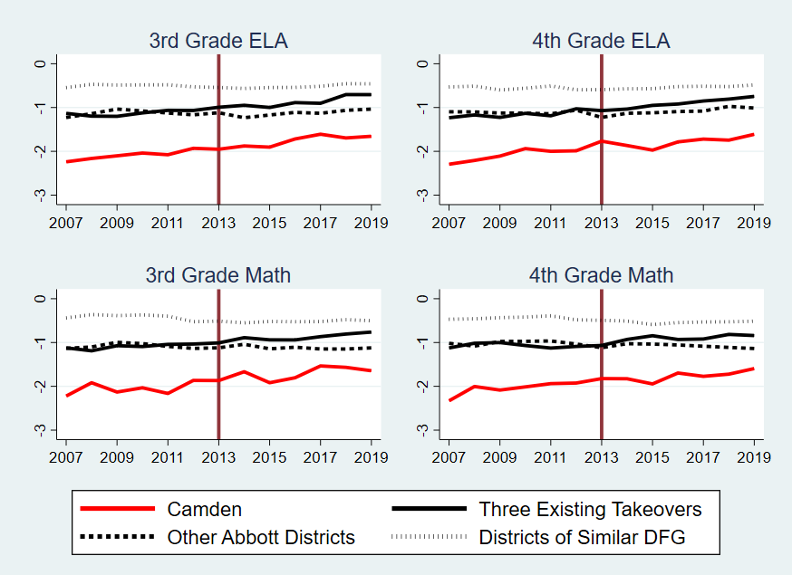
The first comparison group, represented by the solid black line in the figure, consists of the average scores for all district and charter schools within the three school districts previously taken over by the state (Jersey City, Newark, and Paterson).[vii] The second comparison group, represented by the bold dotted line, comprises all district and charter schools within the original Abbott school districts, which are the state’s historically high-poverty and under-resourced school districts. This group is limited to the original Abbott districts that are still designated as “in-need” and have not previously been taken over by the state government (see Appendix A). The last comparison, represented by the dotted line, is all district and charter schools located within the “type A” or “type B’ district factor group districts – designated by New Jersey as the subset of lowest-income school districts.[viii]
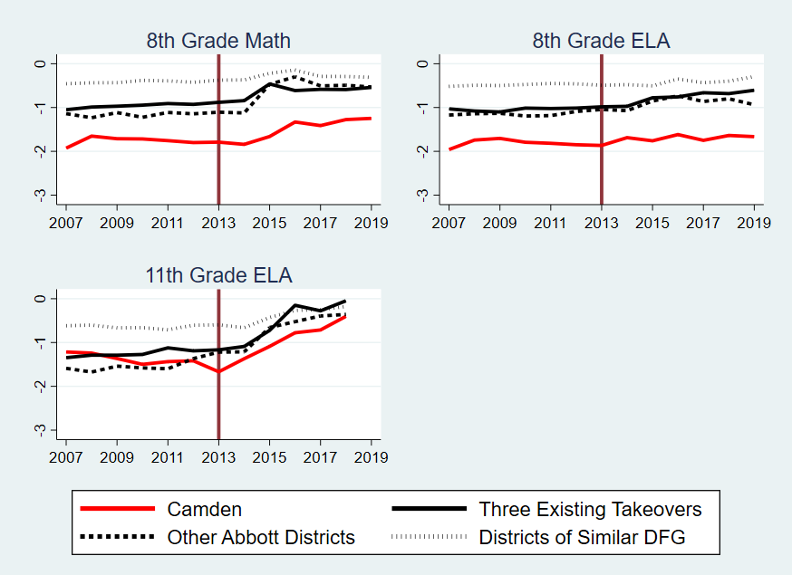
Figure 2: 8th and 11th Grade Normalized Test Scores Before and After State Takeover
Key Findings
Camden City student test scores are lower than those of the three comparison groups in both math and ELA for all years before and after the state takeover. For example, as shown in Figure 1, Camden schools underperformed all other comparison groups in math and ELA in 3rd and 4th grades by more than an entire standard deviation. The only exception to this claim, shown in Figure 2, is for 11th grade ELA, where Camden schools performed better than schools in the existing “takeover” school districts during the years before the state takeover of Camden public schools. However, by the 2011-12 school year, Camden schools were performing worse than all comparison groups, which continued throughout the years after the state takeover.
Camden test scores started to trend in a positive direction even before the state takeover. As shown in Figure 1, Camden had positive growth in standardized test scores for all subjects. However, this steady growth started at least six school years before the state takeover. This suggests that something was happening to the school district before the state takeover that was causing positive trends in 3rd and 4th grade math and reading scores, which could not be attributed to the state takeover. In other words, there is no evidence that the steady growth in 3rd and 4th grade test scores for Camden City schools was the result of the state takeover.
Both Camden City schools and its comparison groups experienced positive spikes in math and ELA in 8th and 11th grades. For example, Figure 2 shows a positive spike in 11th grade ELA test scores for Camden City schools starting in the first year of the state takeover. However, Figure 2 also shows similar positive spikes in 11th grade ELA test scores for the three other comparison groups. This suggests that the Camden City schools’ gains reported in Figure 2 were not unique to Camden City schools because other lower-income schools across the state also experienced similar academic gains in these subjects in the years following the state takeover. Therefore, there is no evidence to suggest that the gains in Camden City schools, reported in Figure 2, resulted from the state takeover. Instead, it is possible that something impacting all low-income schools was causing these academic improvements. For example, Shores and Steinberg find that the Great Recession had the largest negative impact on student achievement for those U.S. school districts serving the most economically disadvantaged students.[ix] Therefore, it is not surprising that Figure 2 reports academic improvements following the Great Recession for many of the highest-poverty schools in the state, not just Camden City schools.
There is No Evidence That the State Takeover Improved Test Scores in Camden
Overall, our results suggest no evidence that the state takeover improved standardized test scores in Camden City schools. These results are particularly concerning because state takeovers disenfranchise district residents. Other studies have found that takeovers also disproportionately impact communities of color.[x] To justify such an intervention, there should be clear evidence of performance gains that could not be achieved under local control. That evidence is absent in Camden.
Appendix
Table 1: The List of Abbott Districts (Special Needs Districts) in New Jersey
| Panel A: Abbott Districts Eligible for “Special Needs” Re-designation | |||
| Asbury Park | Bridgeton | Camden | East Orange |
| Irvington | Keansburg | New Brunswick | Newark |
| Orange | Passaic | Paterson | Perth Amboy |
| Plainfield | Pleasantville | Salem City | Trenton |
| Union City | West New York | ||
| Panel B: Abbott Districts Not Eligible for “Special Needs” Re-designation | |||
| Burlington City | Elizabeth | Garfield | Gloucester City |
| Harrison | Hoboken | Jersey City | Long Branch |
| Millville | Neptune | Pemberton Township | Phillipsburg |
| Vineland | |||
In 2005, the Office of Legislative Service (OLS) conducted an analysis on the 31 Abbott districts to identify those that would continue to be eligible for special needs designation on the basis of their levels of poverty, and those that would be dropped from the original list of special needs districts.[xi] As Camden continued to be eligible for the status, we confine the selection of our control group to that cluster, which is the first panel in the table above. We do not include Paterson or Newark in the “other Abbott districts” comparison group because they are included in the “three existing takeovers” comparison group.
End Notes
[i] Katz, Matt & Vargas, Claudia (2013, March 25). Christie to announce state takeover of Camden schools, The Philadelphia Inquirer, Pg. A01.
[ii] City of Camden School District Comprehensive Annual Financial Report for fiscal year ending June 30, 2020.
[iii] Bill Duhart (2021, March 5). N.J. city will close 3 schools, but spare a 4th thanks to additional state aid, NJ.com. https://www.nj.com/news/2021/03/nj-city-will-close-3-schools-but-spare-a-4th-thanks-to-additional-state-aid.html.
[iv] New Jersey renaissance schools operate only in Camden.
[v] Camden City Schools District 2016, 2017, 2018, and 2020 budget presentations to the Advisory Board.
[vi] In a forthcoming article, we disaggregate the test scores by type of publicly funded school and by individual renaissance school. The results show no consistent differences in test score trends post takeover between the district, renaissance, and traditional charter schools.
[vii] The Jersey City school district was returned to full local control in 2018; Newark in 2020; and Paterson in 2021.
[viii] The state of New Jersey determines district factor groups by ranking all NJ school districts based on socioeconomic characteristics, and the lowest-ranked school districts (i.e., poorest) are labeled either “type A” or “type B.”
[ix] Kenneth Shores, and Matthew P. Steinberg. (2019). “Schooling During the Great Recession: Patterns of School Spending and Student Achievement Using Population Data”, AERA Open, https://doi.org/10.1177%2F2332858419877431.
[x] Morel, Domingo (2018). Takeover: Race, Education, and Democracy. New York, NY: Oxford University Press.
[xi] The Office of Legislative Services. 2005. Analysis of the New Jersey Budget: Department of Education, Fiscal Year 2006 – 2006. https://www.njleg.state.nj.us/legislativepub/budget/educ06.pdf