By Sheila Reynertson and Shekeima A. Dockery
To read a PDF version of this report, click here.
One of the most important ways to improve the wellbeing and economic potential of New Jersey’s children is to enhance the quality of learning and care in the state’s early childhood education and care programs. An effective way to encourage the delivery of high-quality child care in New Jersey is to reimburse higher-quality providers at higher rates. This report describes the characteristics of such a “tiered reimbursement system” and estimates the investment that would be required to make it a success in the Garden State.
Funding New Jersey’s Early Childhood Education and Care System
New Jersey appropriates over $1 billion a year on day care and preschool services for children across the state.[1] In the 2016 budget year, New Jersey appropriated about $1.3 billion through two avenues.
Approximately $580 million of this funding was directed through the Department of Human Services for child care subsidies. Subsidies serve low-income New Jersey families, including those who are current or recent Temporary Assistance for Needy Families (TANF) recipients and those with children participating in child care services in the 31 “Abbott” school districts.[2]
The rest of the money was directed through the Department of Education, and included preschool aid for districts that received special early learning funding and funding for other early childhood education programming.
The $1.3 billion does not include smaller chunks of early childhood funding provided through four departments: the Department of Health, which directs some child care funds toward children who may face abuse; the Department of Children and Families, which directs funding toward children who may have developmental disabilities; the Department of Agriculture, which contributes funds to providing food for children attending care centers; and the Department of Environmental Protection, which reserves some funds so that child care centers can address hazardous waste on their sites.[3]
But even after excluding these funds, we assume that our figure of $1.3 billion is an overestimation of dollars that go to early childhood care. New Jersey’s Office of Management and Budget and individual departments don’t universally break down child care by age and, in some programs, child care funds can be used for individuals up to 19 years old.[4]
A Closer Look at Subsidies
A portion of the funds used to support the child care assistance subsidies are federal dollars allocated through the Child Care Development Block Grant. Most recently reauthorized in 2014, the grant helps states give low-income families the resources they need to obtain child care and return to the workforce.[5] States add local dollars to the federal money to pay providers who accept children from qualifying low-income families.
To guarantee that low-income families using subsidies have access to high-quality care and encourage child care providers to improve their services, states have developed systems to rate and incentivize them. More specifically, states have been experimenting with reimbursing higher-quality providers at higher rates.[6]
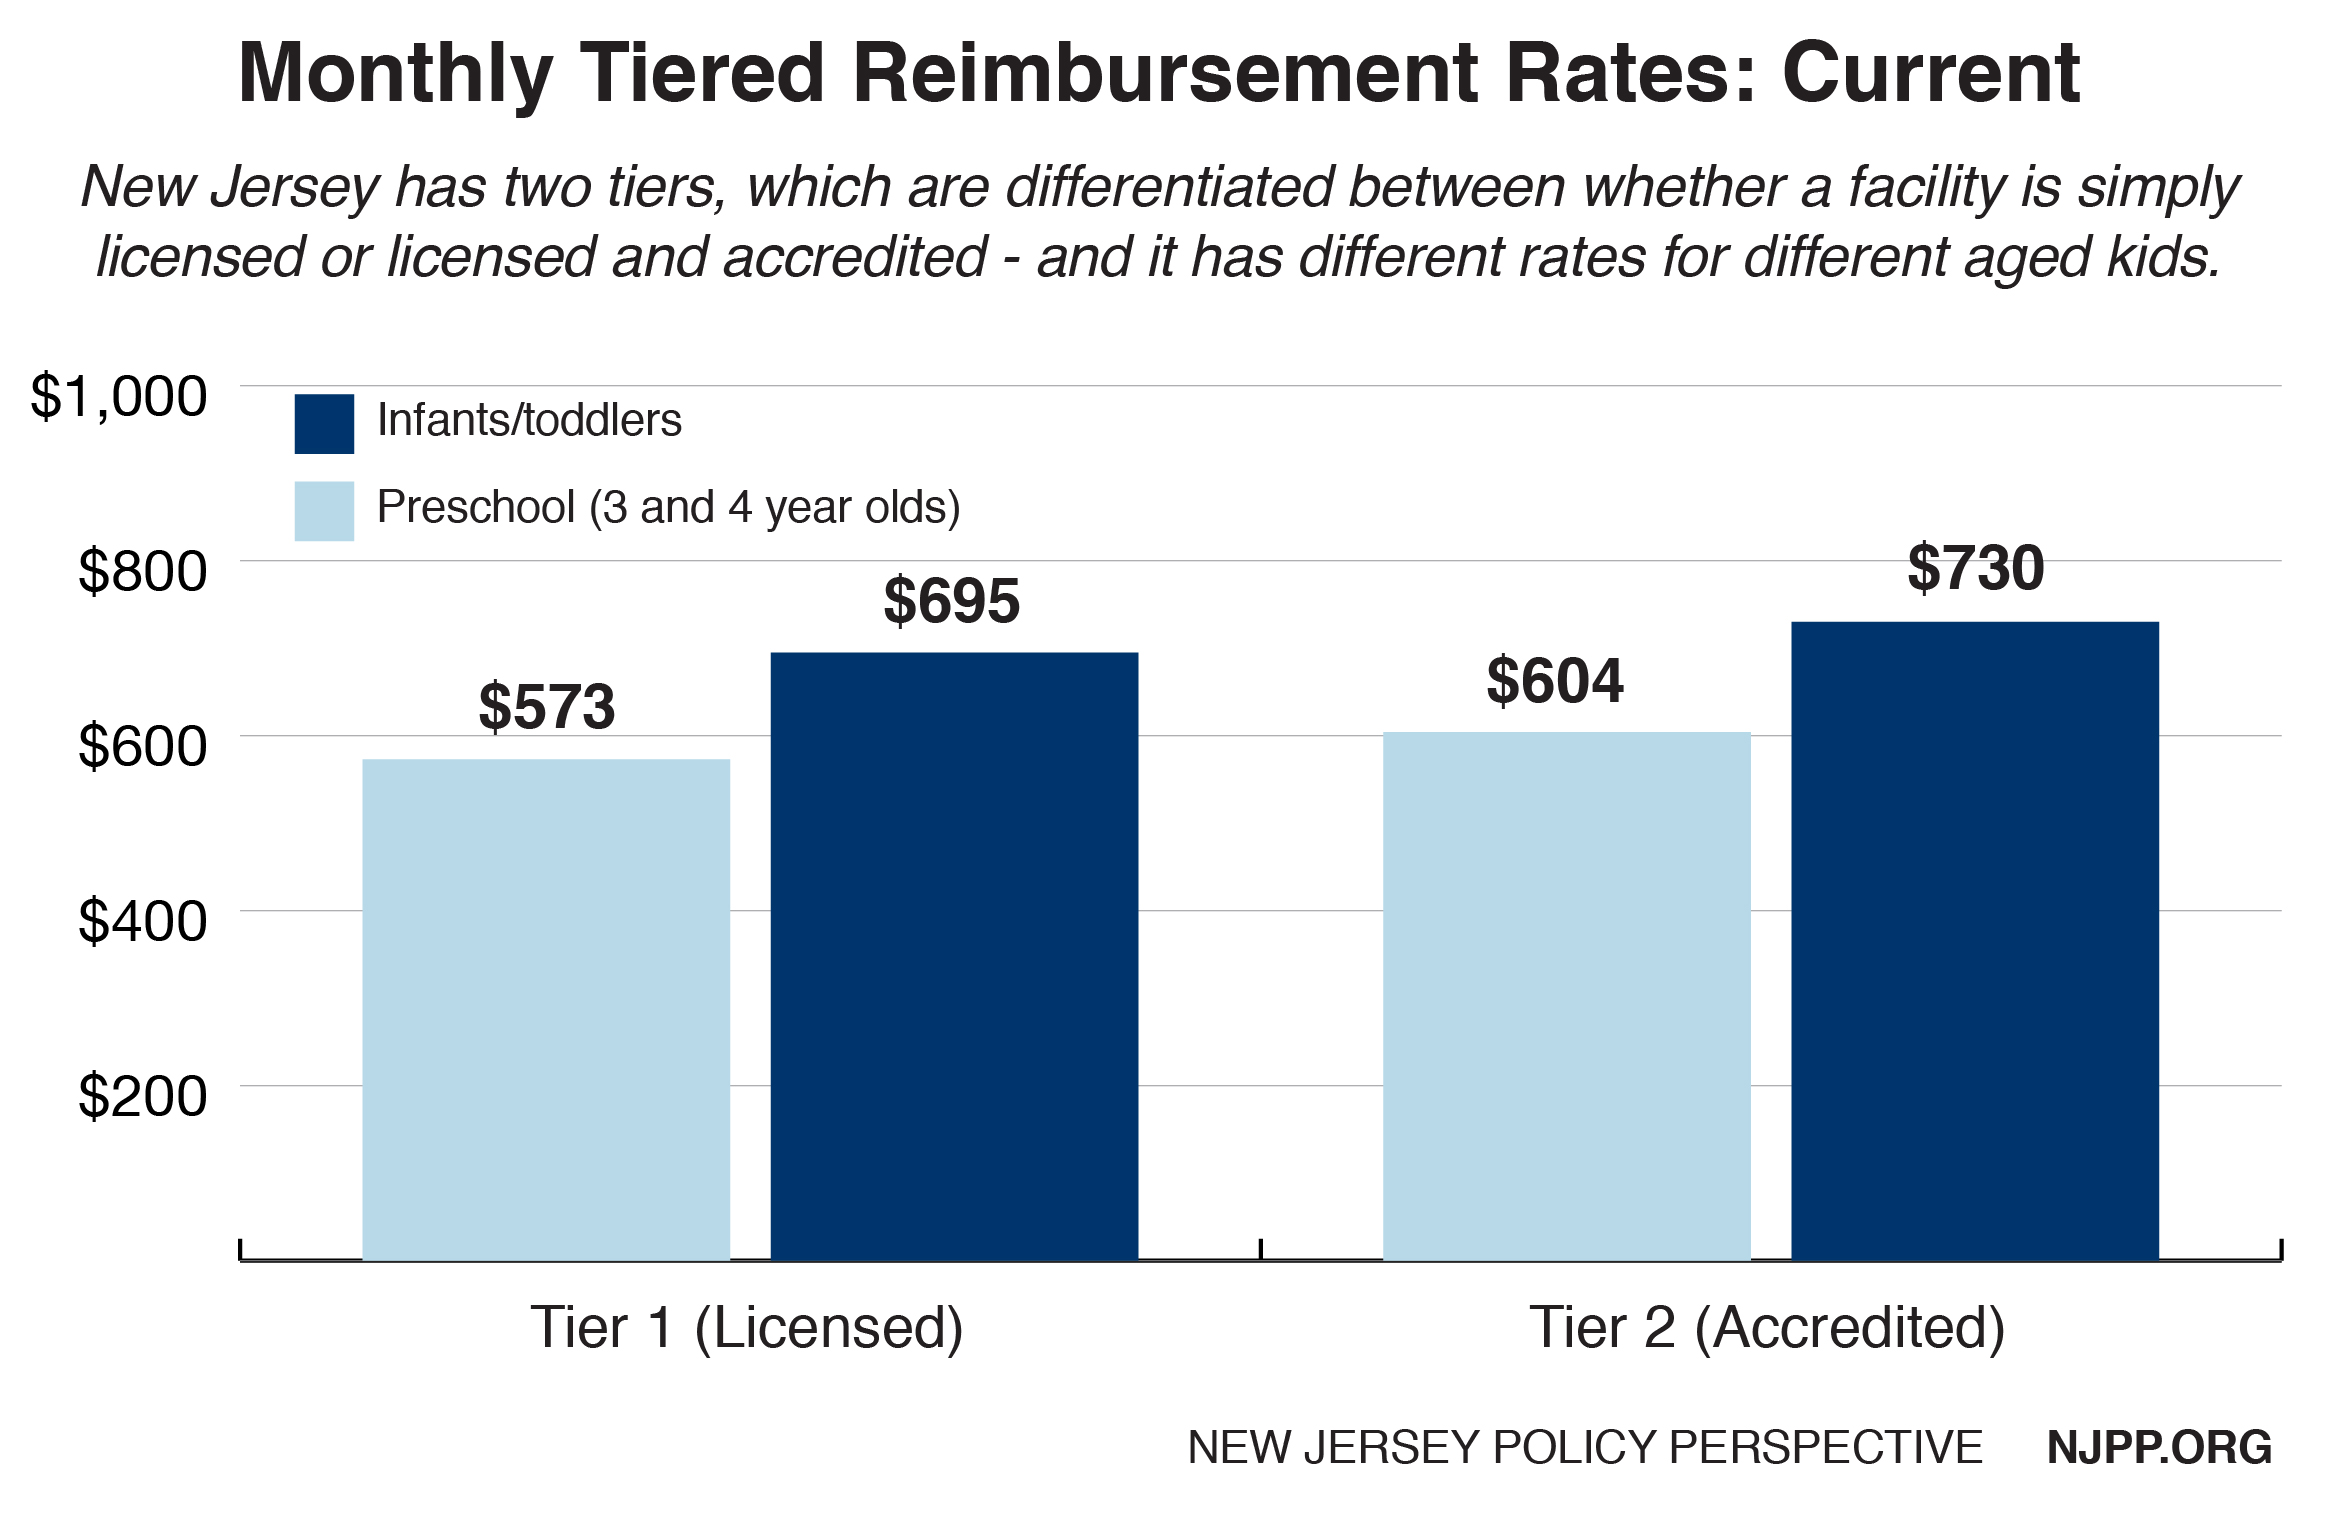
These “tiered reimbursement systems” distinguish between different levels of child-provider quality as determined by a Quality Rating and Improvement System (QRIS). New Jersey has a QRIS – called Grow NJ Kids – but it has not been incorporated in statewide reimbursement standards. Currently, the state operates a two-tiered reimbursement model using a simple metric – accreditation status. Providers who meet certain basic standards set by the accrediting entity are paid 5 percent more than providers who do not. (For more on Grow NJ Kids, visit www.grownjkids.com.)
Determining Quality Through a QRIS
There has long been consensus in the education community that high-quality early childhood care can have life-changing effects for children – particularly low-income kids.[7] However, determining quality of care can be difficult. A QRIS addresses the difficulties by providing a standardized way to determine a provider’s quality and set them on a path to improve. The federal Administration for Children and Families identifies QRIS as having five components: clear standards, accompanying financial incentives, monitoring practices, support for program participants and consumer education. While these five elements remain consistent across different systems, the way that states carry them out vary.[8]
Most states use numbers in a QRIS to distinguish between provider status, with higher-quality providers receiving higher rankings. For instance, in Pennsylvania’s QRIS, level 4 providers are of higher quality than level 2 providers. To qualify rating levels, states use “blocks,” “points,” or combination models. In a blocks model, QRIS levels are standardized, and providers must meet all specified requirements for a given level before moving on to the next. In a points model, providers earn points for reaching certain standards, and quality levels are determined by the number of points received. In both models, variables determining levels and points are evidence-informed. Models adopted by individual states have varied widely in terms of variables measured, rigor of the data collected and data collection methods.[9]
It is important that the structure and underlying logic models of a QRIS are commonly validated and connected to core principles of child development. Publicly available QRIS ratings allow consumers to be informed about the quality of their provider choices, allow state or municipal leaders to be aware of the quality that providers – who sometimes receive government funding – are providing, and hold providers accountable for the work they do.[10]
These systems were created using research supporting the importance of good child care. However, states’ evaluations are scarce and many have yielded ambiguous results.[11] It is not clear that the evidence-informed systems necessarily create tangible outcomes. Research suggests that some validation studies with positive results may be lacking in rigor.[12] Uncertainties aside, experts have acknowledged that there is some correlation between positive child development and certain features that are commonly included in a QRIS. These features include teacher quality, use of research-informed curriculum and assessments, classroom time and class environment.
Reimbursement Tiers
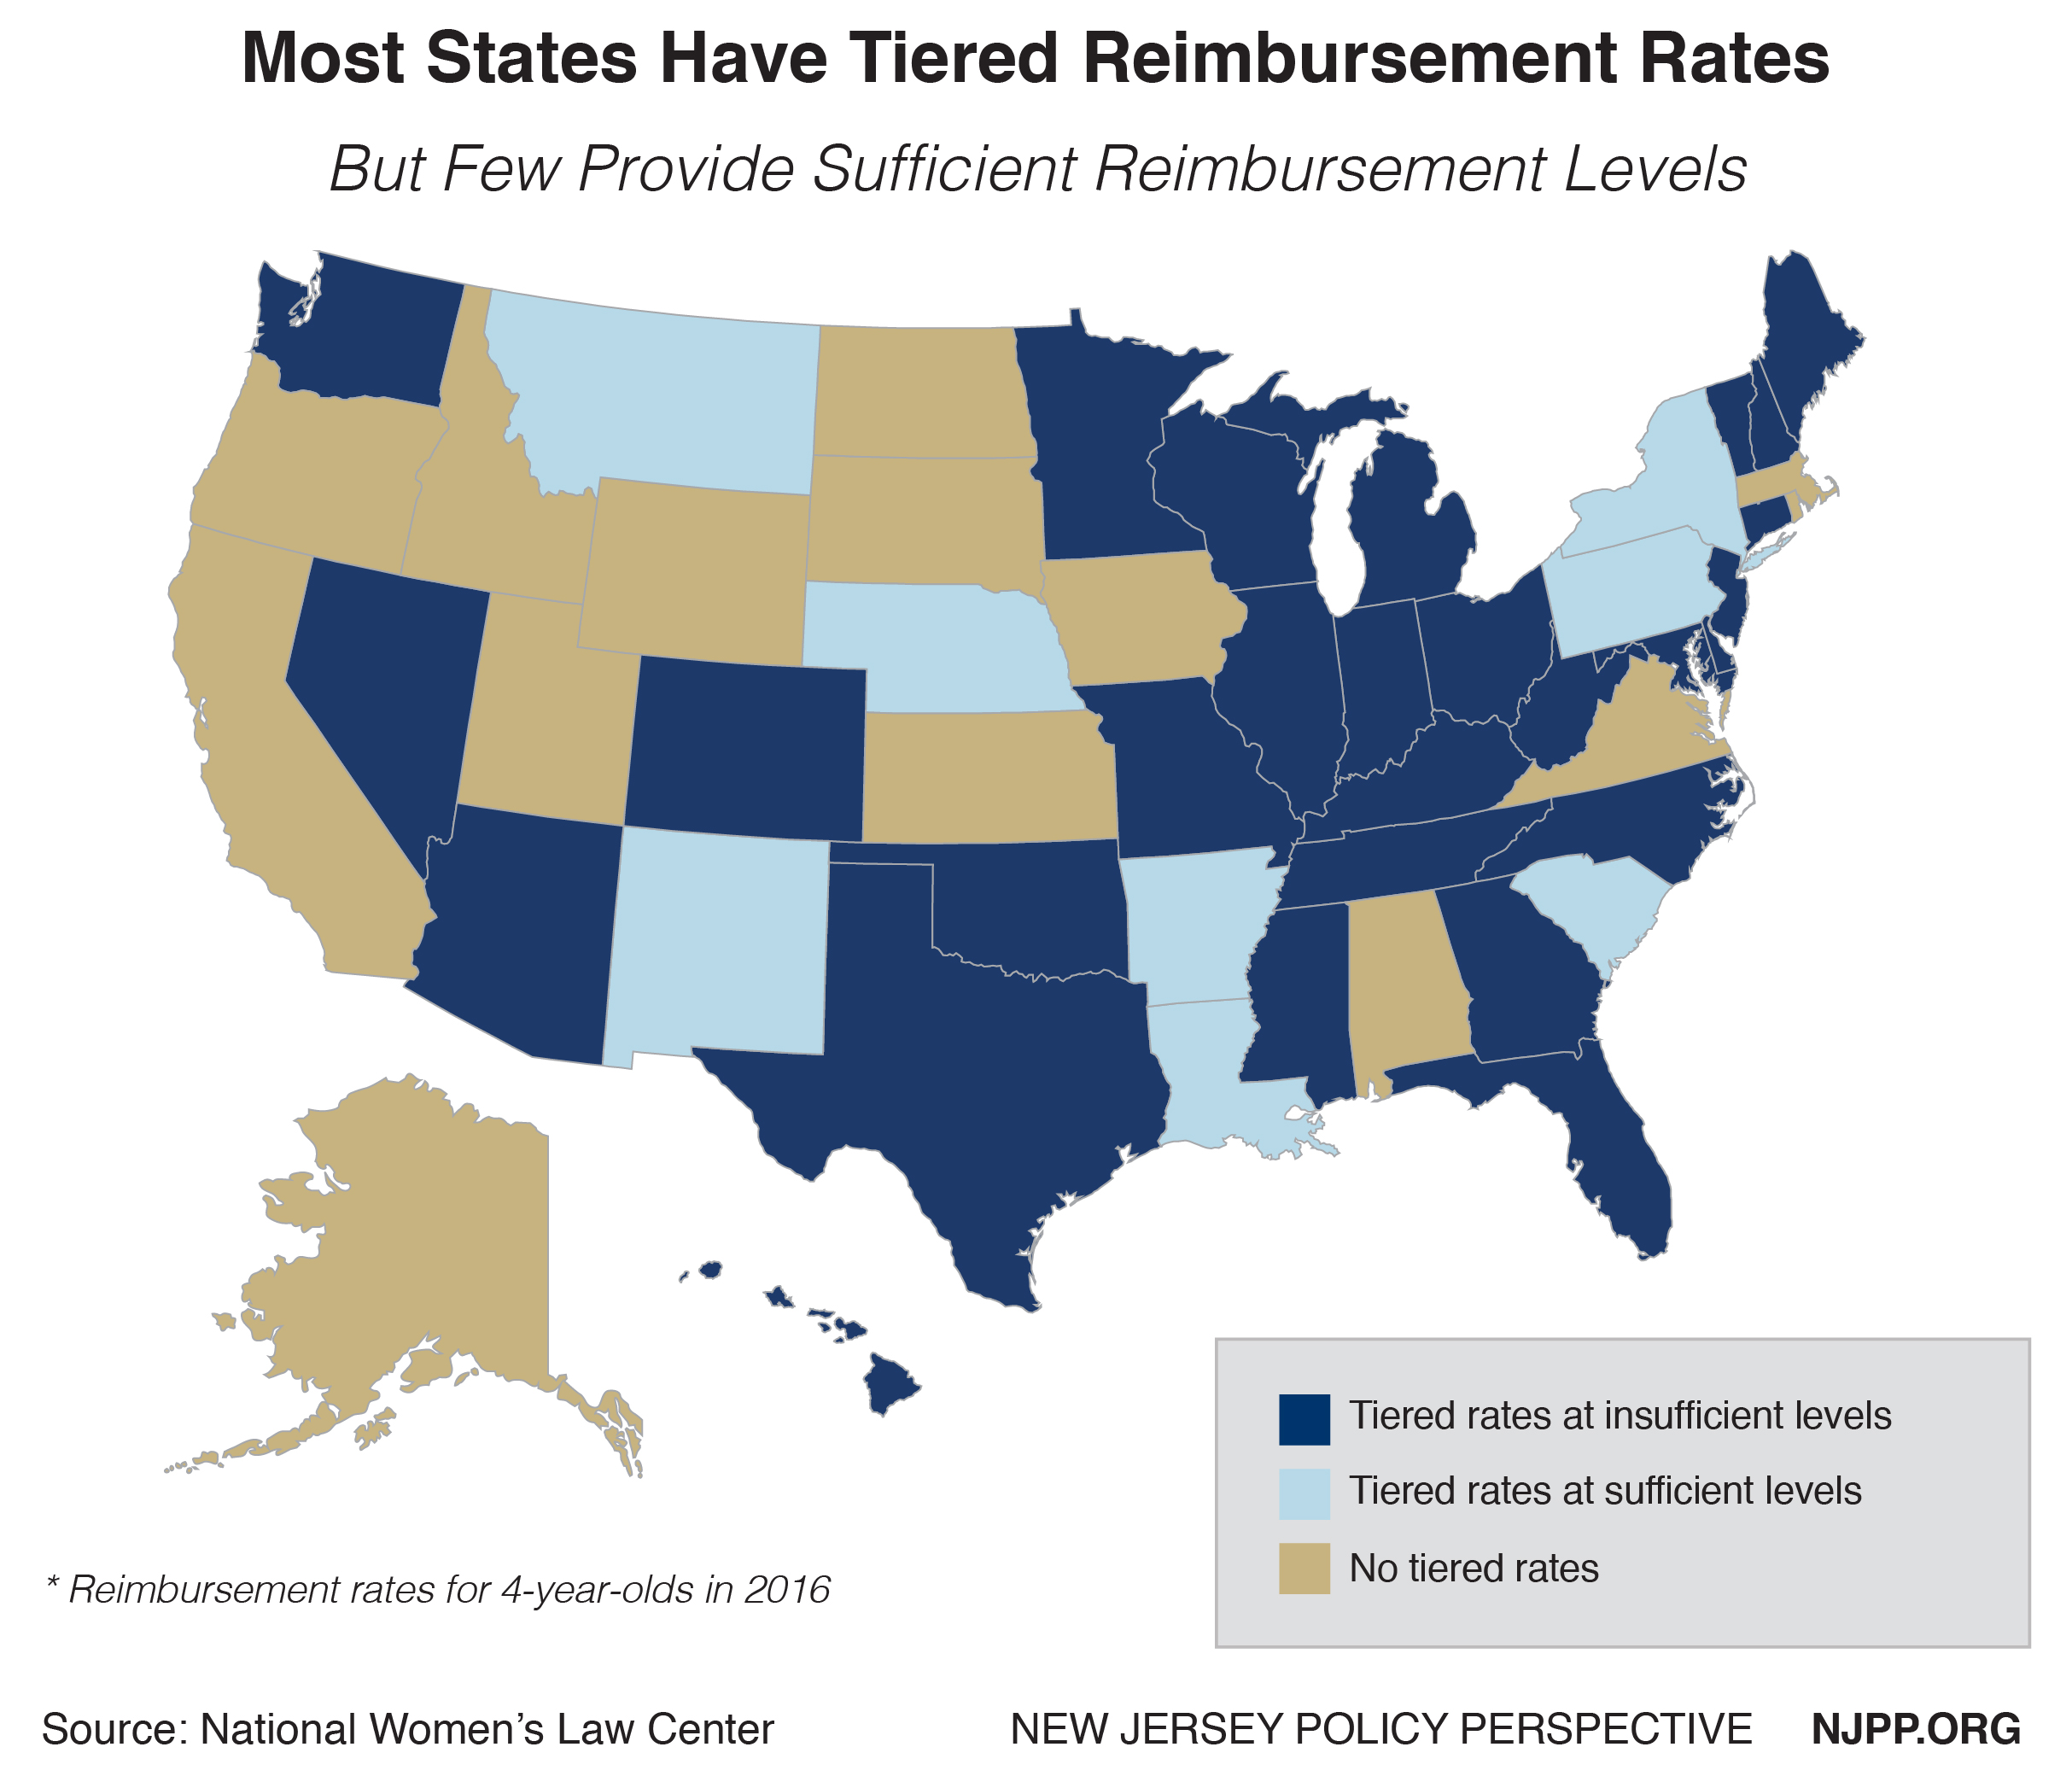 To comply with the financial incentive component of QRIS utilization, some states have developed tiered reimbursement systems based on provider quality. In 2016, 38 states – including New Jersey, with its two-tiered system – had implemented such reimbursement strategies.[13]
There is general agreement that the difference between tiered rates must be significant enough to encourage providers to improve and serve more families using subsidies.[14] However, there does not seem to be a consensus around an ideal rate schedule.[15]
A Georgetown University study found a significant correlation between states with substantial differences between rates for accredited care centers and the number of applications for accreditation. The study found a statistically significant increase in accreditation participation when the rate differential was at least 15 percent higher than the base rates.[16] If we assume that these findings are applicable to systems with multiple tiers, New Jersey should consider a tiered reimbursement system with rate differentials of at least 15 percent.
Base Rates
The base rate of any proposed tiered reimbursement system should be robust enough so that providers can offer adequate services and pay fair wages.
The guidelines set by the federal Administration for Children and Families provide some guidance on how states can determine that value. They suggest that states perform a market study of child care costs and reimburse providers at the 75th percentile of that market rate to allow subsidy program participants to have a wide range of provider choice.[17]
As of 2016, most states use base reimbursement rates below the 75th percentile of the market rate and differentiate reimbursement rates along with age group and type of facility.[18] And New Jersey is no exception: the reimbursement rate for infants is at the 19th percentile of the market rate,[19] and the rate for preschoolers falls 41 percent below the 75th percentile – the second largest gap in the nation, after Missouri’s gap of 42 percent.[20]
The market rate need not be the only factor of consideration when determining appropriate base reimbursement rates. There is not widespread consensus on the cost of child care, but New Jersey could consider using existing cost estimates. A now 15-year-old estimate using national data determined that the yearly cost of high-quality preschool could range from about $7,000 to $12,000 per child.[21] And a recent Advocates for Children of New Jersey report estimates that families pay between approximately $10,000 and $15,000 per year for child care.[22]
A Fair and Effective Reimbursement Rate Schedule: Two Versions
Using the New Jersey Market Rate
The rate schedule below uses five rating levels like New Jersey’s existing QRIS – Grow NJ Kids – with Levels 1 and 2 as bases. The reimbursement rate estimated for the base levels is at the 75th percentile of the New Jersey market rate as determined by the 2012 market rate survey. Each subsequent level has a reimbursement rate increase of 15 percent.
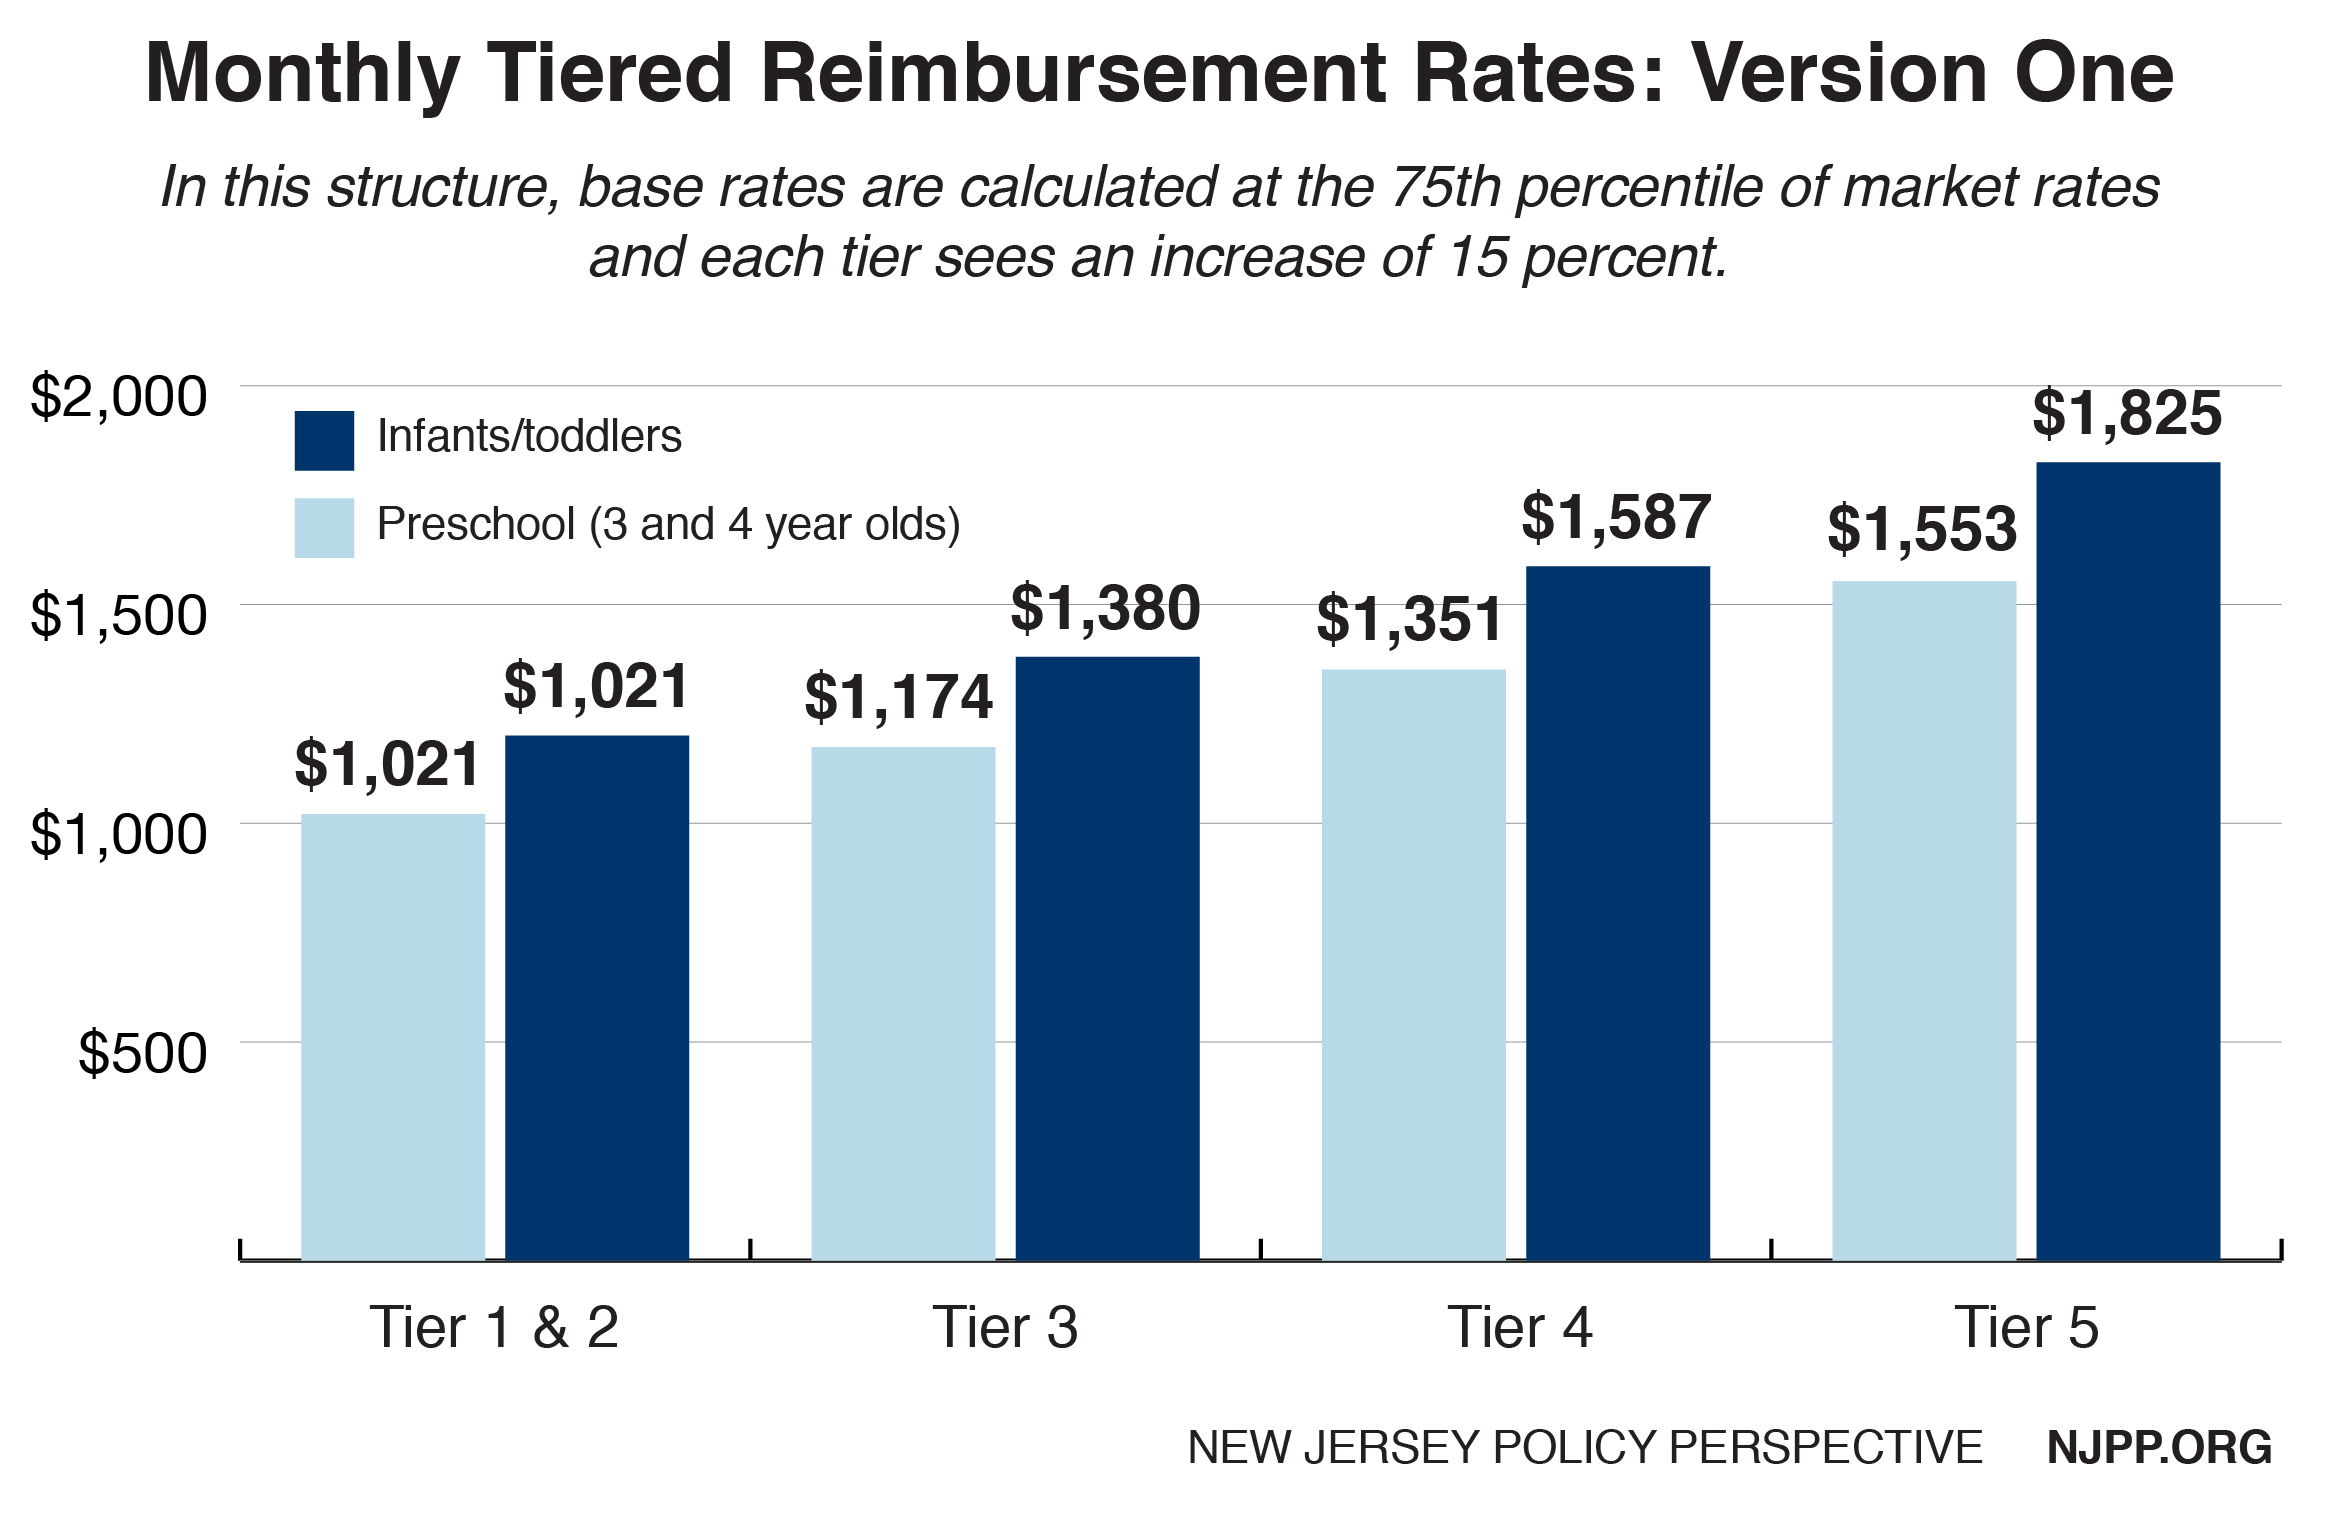
A recent report by Advocates for Children of New Jersey estimates the cost of care for the five levels of Grow NJ Kids to be slightly lower than the reimbursement estimates above. However, the figures above are compatible with their estimates of inflation-adjusted cost of tuition in New Jersey.[23]
Using the Abbott Districts as a Benchmark
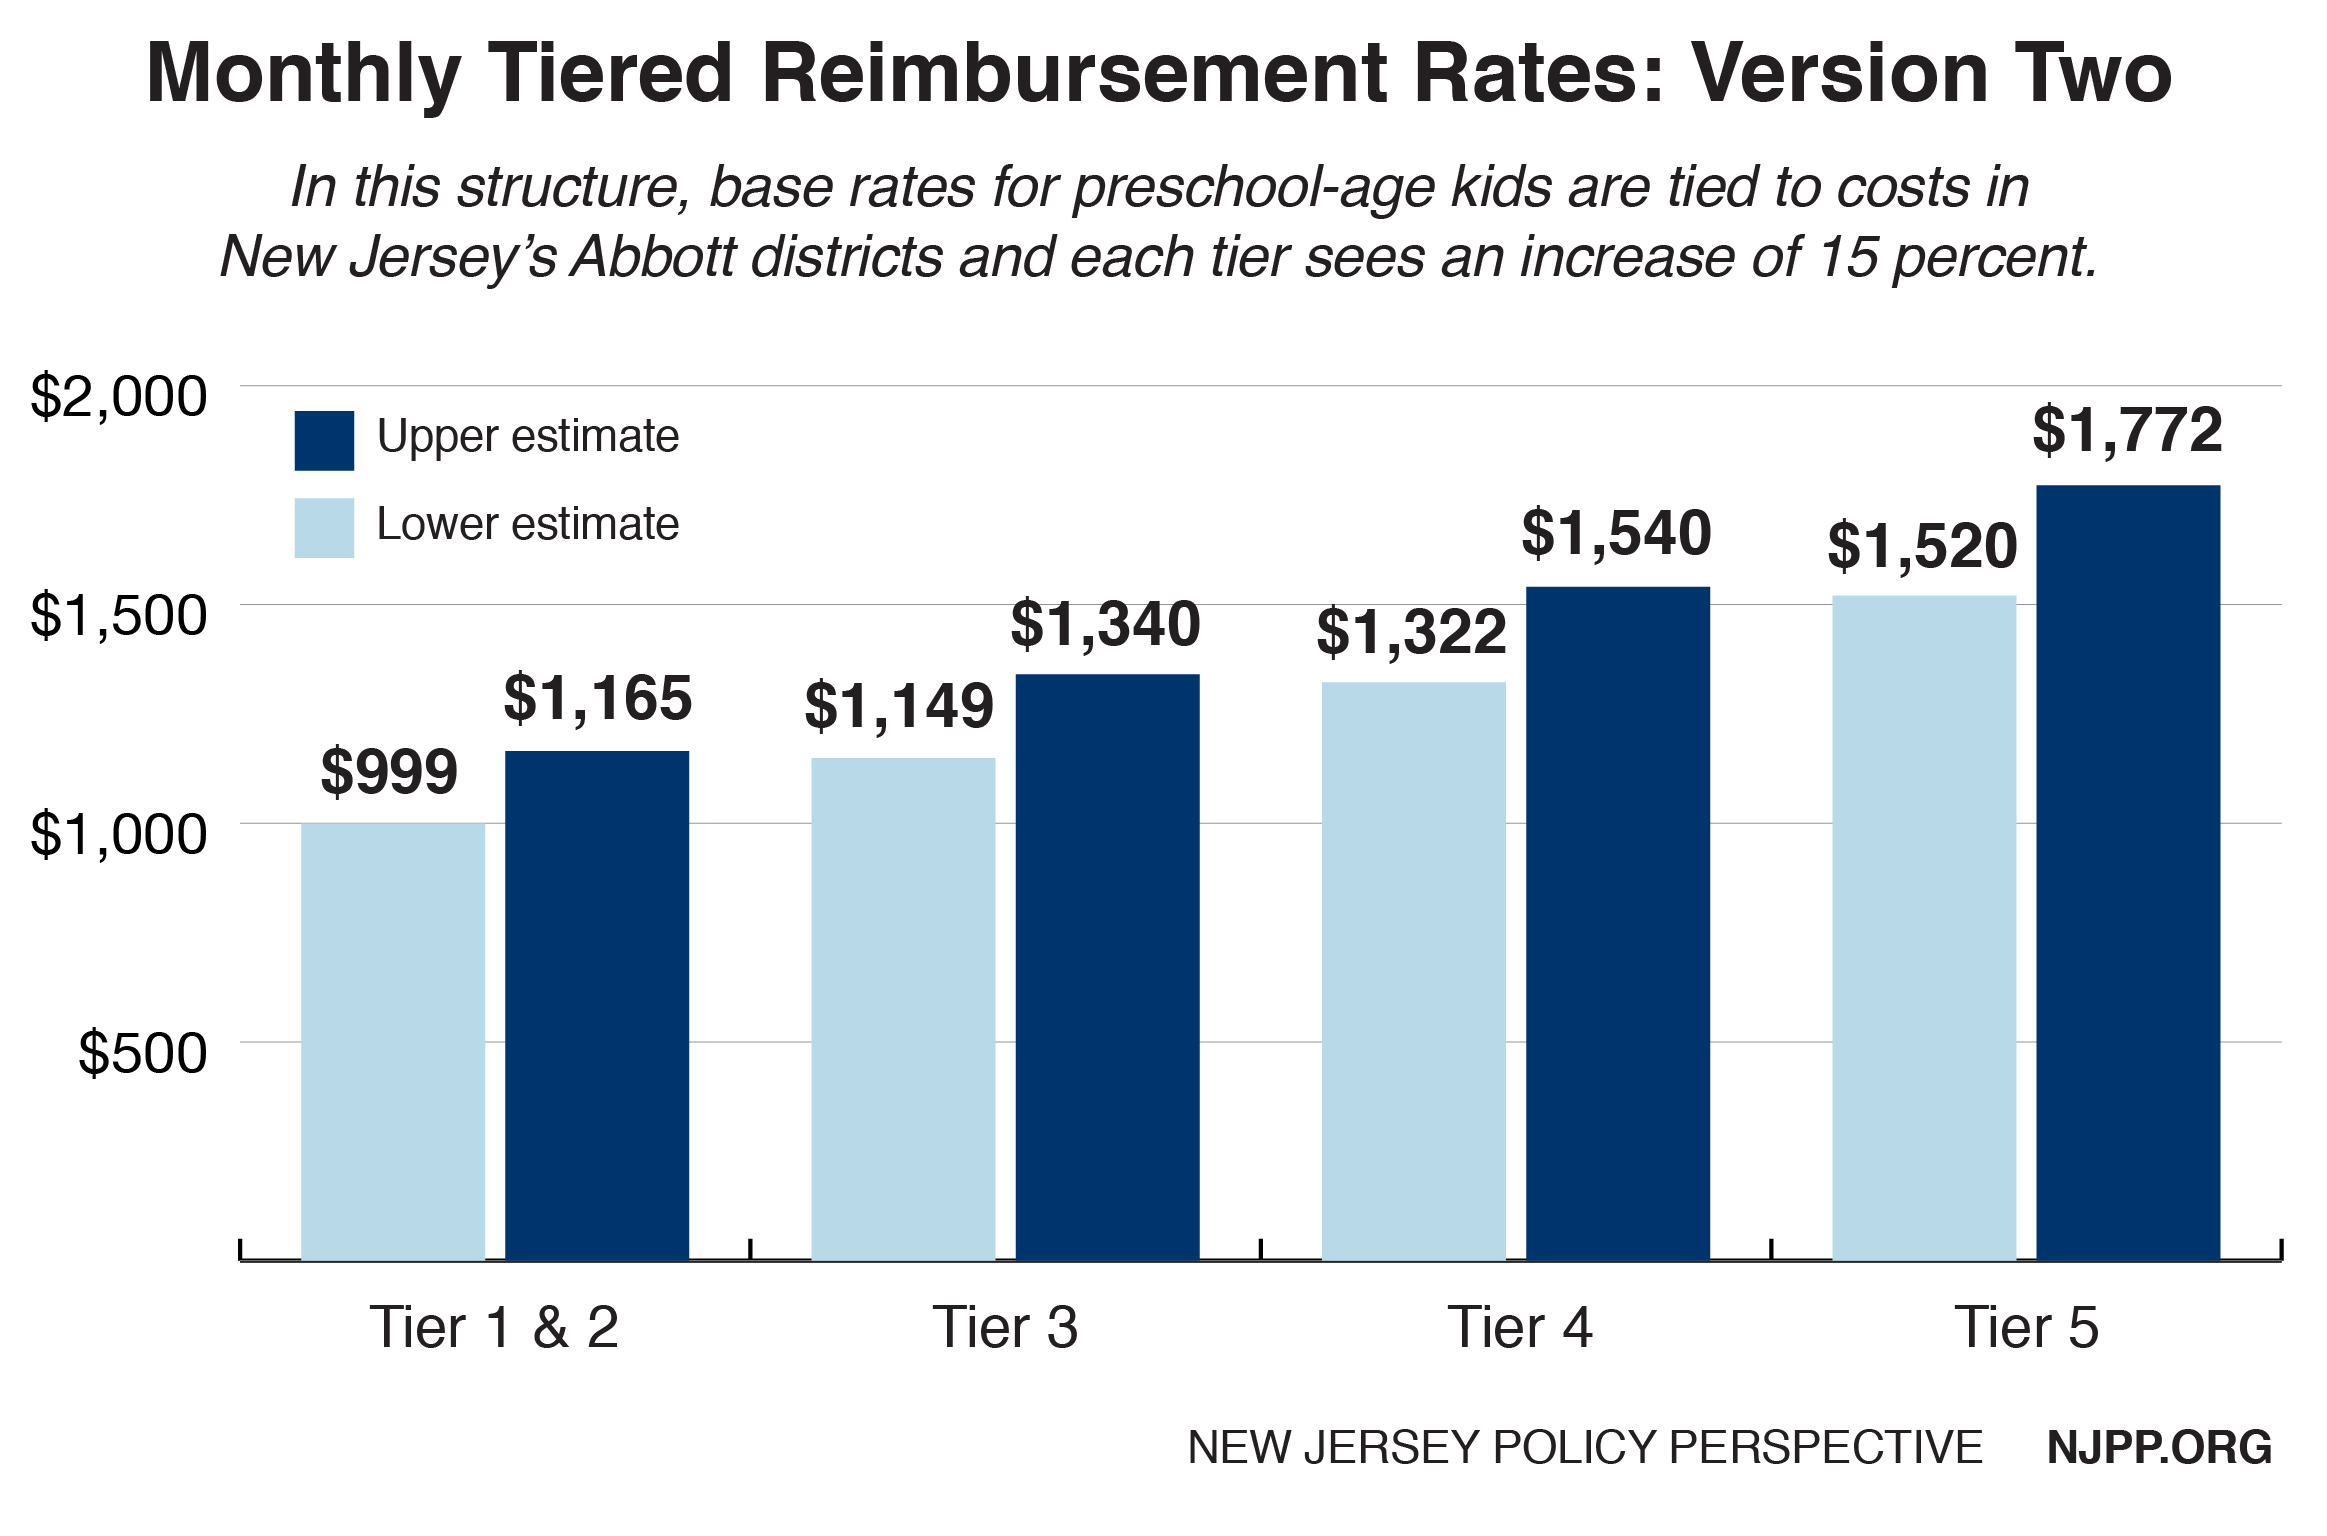
New Jersey already has an existing framework to estimate the cost of providing high-quality child care. The services offered through the 31 Abbott district preschools are well standardized, monitored, widespread and grounded in child development research. What’s more, research using rigorous evaluation methods has determined that children attending Abbott preschools garner benefits that last well into their elementary school education.[24]
Using these districts as a benchmark, the estimated annual cost of high-quality preschool for private providers is $13,978 per child.[25] Public providers in the Abbott districts with access to public resources have slightly lower average annual costs, at $11,993 per child. If New Jersey were to use these cost estimates, base monthly reimbursement rates for preschoolers would range from about $1,000 to $1,165, with each subsequent level increasing by 15 percent. (Estimates do not include the cost of grants and rewards.)
Looking to Other States: Three Case Studies
Pennsylvania, North Carolina and Delaware have had success in improving child care provider quality by tying together a QRIS and a tiered reimbursement system. While it is not possible to determine which parts of their systems are responsible for specific improvements without more rigorous evaluations, it is worth examining these three states’ systems.
Pennsylvania
In response to a pattern of eroding quality in early child care in the 1990s, Pennsylvania piloted its Keystone Standards Training/Professional Development Assistance Resources and Support (STARS) quality rating system. The Keystone STARS system was designed to rate the quality of providers, give them financial assistance and create opportunities for child care workers’ professional development. Keystone STARS implemented tiered reimbursement tied to provider quality in 2007.[26]
The STARS system distinguishes quality across four blocked tiers and rewards higher performing providers with daily reimbursement add-on rates that increase along with STAR designation or level.
Results from Keystone STAR evaluations show that the rating component may have a positive effect on provider quality and student performance. In 2006, researchers at the University of Pittsburgh found that providers participating in Keystone STARS were rated as being of higher quality than non-participants. Furthermore, they found participant facilities continued to improve on the STARS metrics once enrolled.[27]
Results of a later study from the Consortium for Policy Research in Education found that preschool-aged children attending STAR 3 and STAR 4 facilities performed modestly better than their peers in STAR 1 and STAR 2 facilities.[28] The Keystone STARS program was found to reverse the trend of decreasing provider quality. Similarly, reports from Pennsylvania’s Office of Child Development and Early Learning note that children receiving high-quality care reach key developmental milestones. A 2010 report noted that over 97 percent of preschool-aged children in STAR 3 and 4 facilities reached – or were on track to reach – their literacy, numerical and social benchmarks.[29]
North Carolina
North Carolina was among the first states to adopt a QRIS.[30] Unlike Pennsylvania, all licensed care facilities in the state must comply with the state’s 5-level Star Rated License system. Level 1 providers must meet the minimum requirements for licensure, and providers in levels 2 through 5 may voluntarily meet additional requirements.[31] There has not been an evaluation of North Carolina’s QRIS results, though the system was validated soon after its implementation.[32] Instead of performing a statewide market rate survey, the state determines market rate by county and provider quality level.
Worth noting is North Carolina’s robust, interconnected early child care system. In addition to a standard child subsidy program, the state operates a parallel program – Smart Start – that provides services including child care provider development and care subsidies for families.[33] It is a one-stop system that works with private funders, nonprofits and communities to provide wraparound services for children.[34]
Though the Smart Start program has not undergone a rigorous evaluation using randomization, it has shown promising results including an increase in access to child care for vulnerable populations and the quality of child care providers.[35] Children who attended Smart Start facilities were also found to be more prepared for kindergarten.[36]
Delaware
Implemented in 2007, the Delaware Stars for Early Success program uses a hybrid points and block model to determine child care provider quality across five levels. Providers voluntarily enter the program at STAR level 1 and move to level 2 after completing an orientation process. To reach levels 3 through 5, providers must obtain certain quality-related benchmarks as defined by the QRIS. [37] The state began to provide tiered reimbursement in 2011, but only to providers rated in the top three levels.[38]
A 2016 evaluation of the Delaware program found that there were only slight differences in child developmental outcomes between provider quality STAR ratings. Children participating in Star 5 programs outperformed children in Star 2 programs by a small margin in a key development indicator, but there was no definitive evidence that higher-rated providers created better outcomes for children than lower-rated providers.[39]
The Path Toward a Robust Tiered Reimbursement System
To successfully maintain a robust and effective QRIS system, New Jersey must give providers sufficient incentive, information and support to comply with the system and make quality improvements. At its core, a successful QRIS system must incorporate well-funded grant programs and easy-to-access professional development opportunities so that struggling providers can improve. The state must also monitor and evaluate participating providers while keeping the QRIS system updated with new research and findings. The most effective implementation of a QRIS and tiered reimbursement system can only happen with significant state investment.
Funding a robust tiered reimbursement system
Even with specific targets for reimbursement levels, it is difficult to make an appropriate estimate without more information. Current publicly available data does not disaggregate data between children receiving full-time care and those who are not. Therefore, the following estimate should not be seen as conclusive.
According to the 2018 state budget, New Jersey provided child care subsidies for 57,094 families in fiscal year 2016. A 2014 National Center for Children in Poverty (NCPP) profile determined that the average New Jersey family has 1.83 children.[40] Using these figures, and the average monthly cost of care using the non-Abbott rate schedule above, a robust tiered reimbursement system would require an annual $1.6 billion investment. The state could fund this system by increasing tax revenues or pursuing public-private partnerships.[41] Given the program costs, a public-private partnership may be a better option to successfully launch such an initiative using North Carolina’s Smart Start system as a model.
Addressing structural barriers to quality child care
When implementing a tiered reimbursement system, and ranking child care providers based on quality of care, policymakers must take extra care to ensure that these systems don’t perpetuate larger-scale structural barriers to quality child care by rewarding those who are already well-positioned to succeed.
- In a progressive tiered reimbursement system, funds should be focused more toward centers that need support than those that are being rewarded for good performance. Grants and aid money should be generously given to providers that are lower quality. Rewards and further investments in high-quality providers should be limited and dispersed with consideration.
- Child development is not the only important indicator. Throughout their evaluations, states used child developmental outcomes to understand the performance of their reimbursement systems and child care programs. While it is important that children have the support, they need to reach the appropriate developmental outcomes, it is equally important to remember that child care services should be beneficial for the complete wellbeing of children and their families. Child care should not be limited to education services, and instead should be robust and include, for example, health and wellness interventions. Furthermore, as families use child care services to free up the time of adults, it should be affordable and easily accessible. Access and depth of services provided should be included in any re-envisioning of New Jersey’s child care system.
- Teacher diversity and cultural competence are important components of quality early child care and education. In quality programs, teachers who “look like” the children they serve foster learning environments that affirm children’s cultures, which can have a major effect on children’s school readiness.
- Early child care is not the only child care. A focus on early childhood wellbeing is important as it can have long lasting impacts. However, older children are also in need of comprehensive care services.
- Increased funding. Funding scarcity contributes to large-scale inequality. When we try to cut costs, we diminish service quality and availability for vulnerable populations. Any proposed investment in New Jersey’s child care system must avoid shifting funding from one area to another, and should aim to increase funding for all child care services for children ages 0-18. There is no doubt that New Jersey must invest considerably more in its child care system.
Endnotes
[1] This definition of child care refers only to the daily care services provided to children so that their guardians can work.
[2] For more on New Jersey’s Abbott districts, see Education Law Center, Abbott Overview, (Accessed May 30, 2017), http://www.edlawcenter.org/cases/abbott-v-burke/abbott-v.-burke-overview.html
[3] State of New Jersey, The Governor’s FY 2017 Budget: Detailed Budget, February 2016, http://www.nj.gov/treasury/omb/publications/17budget/pdf/FY17BudgetBook.pdf
[4] New Jersey Department of Human Services, SFY 2014 Maximum Child Care Payment Rates, August 2014, http://www.state.nj.us/humanservices/dfd/programs/child/forms/sfy14_max_cc_pay_rates.pdf
[5] National Association for the Education of Young Children, Child Care and Development Block Grant, (Accessed May 30, 2017), https://www.naeyc.org/policy/federal/ccdbg
[6] National Women’s Law Center, Building Blocks: State Child Care Assistance Policies, 2015, https://nwlc.org/wp-content/uploads/2015/11/CC_RP_Building_Blocks_Assistance_Policies_2015.pdf
[7] Society for Research in Child Development, Investing in Our Future: The Evidence Base on Preschool Education, October 2013, https://www.fcd-us.org/the-evidence-base-on-preschool/
[8] U.S. Department of Health and Human Services, Administration for Children and Families, QRIS Resource Guide, (Accessed May 30, 2017), https://qrisguide.acf.hhs.gov/
[9] Early Childhood Research Quarterly, What Do Quality Rating Levels Mean? Examining the Implementation of QRIS Ratings to Inform Validation, 2015, http://www.sciencedirect.com/science/article/pii/S0885200614000878
[10] Ibid at 9
[11] Build Initiative, QRIS 3.0 Tools and Resources: Finance and Quality Rating and Improvement Systems, 2017, http://buildinitiative.org/Portals/0/Uploads/Documents/Resources/QRIS%203/FinanceQRIS.pdf
[12] RAND Education and RAND Labor and Population (Prepared for the Delaware Office of Early Learning), Validation Studies for Early Learning and Care Quality Rating and Improvement Systems: A Review of the Literature, May 2014, https://www.rand.org/content/dam/rand/pubs/working_papers/WR1000/WR1051/RAND_WR1051.pdf
[13] Ibid at 6
[14] National Women’s Law Center and CLASP, A Count for Quality: Child Care Center Directors on Rating and Improvement Systems, 2014, http://www.clasp.org/resources-and-publications/files/ACountforQualityQRISReport.pdf
[15] Child Trends and Mathematica Policy Research (Prepared for Office of Planning, Research and Evaluation, Administration for Children and Families, Department of Health and Human Services), The Child Care Quality Rating System Assessment: Compendium of Quality Rating Systems and Evaluations, April 2010, https://www.acf.hhs.gov/sites/default/files/opre/qrs_compendium_final.pdf
[16] Foundation for Child Development, Money, Accreditation, and Child Care Center Quality: Working Paper Series, August 2000, http://files.eric.ed.gov/fulltext/ED446851.pdf
[17] Ibid at 15
[18] Ibid at 6
[19] New Jersey Department of Human Services, Division of Family Development, Office of Child Care, New Jersey Child Care Development Fund (CCDF) Plan with Conditional Approval Letter for FY 2016‐2018, June 2016, https://www.acf.hhs.gov/sites/default/files/occ/new_jersey_stplan_pdf_2016.pdf
[20] Ibid at 6
[21] National Conference of State Legislatures, Investing in Our Future: A Guide to Child Care Financing, June 2002, http://files.eric.ed.gov/fulltext/ED475674.pdf
[22] The range is $11,664-$14,962 for infants; $11,065-$14,062 for Toddlers; and $9,702-$11,937 for preschoolers. From Advocates for Children of New Jersey, Quality Cost How Much? Estimating the Cost of Quality Child Care in New Jersey, April 2017, http://acnj.org/downloads/2017_04_25_Quality%20Costs%20How%20Much_reduced.pdf
[23] Ibid at 22
[24] National Institute for Early Education Research Rutgers—The State University of New Jersey, Abbott Preschool Program Longitudinal Effects Study: Fifth Grade Follow-up, March 2013, http://nieer.org/wp-content/uploads/2013/11/APPLES205th20Grade.pdf
[25] Clive Belfield and Health Schwartz, The Cost of High-Quality Pre-School Education in New Jersey, December 2007, http://files.eric.ed.gov/fulltext/ED504894.pdf
[26] Pennsylvania Department of Public Welfare, Office of Child Development and Early Learning, Keystone Stars Reaching Higher for Quality Early Learning: Program Report, 2010, https://www.pakeys.org/uploadedContent/Docs/STARS/outreach/2010%20STARS.rpt.final.pdf
[27] University of Pittsburgh Office of Child Development Pennsylvania State University Prevention Research Center, Evaluation of Pennsylvania’s Keystone STARS Quality Rating System in Child Care Settings, December 2006, http://www.pakeys.org/docs/Keystone%20STARS%20Evaluation.pdf
[28] Consortium for Policy Research in Education, An Inquiry into Pennsylvania’s Keystone STARS, November 2015, http://www.cpre.org/sites/default/files/stars_inquiry_report_1.6.16_final.pdf
[29] Ibid at 26
[30] Ibid at 12
[31] North Carolina Department of Health and Human Services, Child Development and Early Education, North Carolina Star Rated License System, (Accessed May 30, 2017), http://ncchildcare.nc.gov/parents/pr_sn2_ov_sr.asp
[32] Frank Porter Graham Child Development Center, University of North Carolina-Chapel Hill, Validating North Carolina’s 5-Star Child Care Licensing System, 2001, http://fpg.unc.edu/sites/fpg.unc.edu/files/resources/reports-and-policy-briefs/FPG_SmartStart_Validating-NC-CC-Licensing-System-February2001.pdf
[33] North Carolina Department of Health and Human Services, Child Development and Early Education, North Carolina Star Rated License System: FAQs, (Accessed May 30, 2017), http://ncchildcare.nc.gov/parents/pr_sn2_fafaq.asp; North Carolina Department of Health and Human Services, Child Development and Early Education, North Carolina Star Rated License System:Providers, (Accessed May 30, 2017), http://ncchildcare.nc.gov/providers/pv_providres.asp
[34] The North Carolina Partnership for Children, Inc., In Your Community, (Accessed May 30, 2017), http://www.smartstart.org/smart-start-in-your-community/
[35] The North Carolina Partnership for Children, Inc., North Carolina’s Smart Start: Implications for Public Policy, 2002 https://www.purdue.edu/hhs/hdfs/fii/wp-content/uploads/2015/07/s_wifis17c05.pdf
[36] Harvard Graduate School of Education, Harvard Family Research Project, North Carolina’s Smart Start Initiative: A Decade of Evaluation Lessons, 2004, http://www.hfrp.org/var/hfrp/storage/original/application/f2dd8f1de9603d4c6971851bf8c24ce5.pdf
[37] RAND Corporation, Evaluation of Delaware Stars for Early Success: Final Report, 2016, https://www.rand.org/pubs/research_reports/RR1426.html
[38] Delaware Department of Health and Social Services, Child Care and Development Fund (CCDF) Plan for State/Territory: Delaware, FFY 2016-2018, 2016, http://dhss.delaware.gov/dss/files/ccdfplan_ffy2016_2018.pdf
[39] Ibid at 37
[40] National Center for Children in Poverty, New Jersey Demographics for Low-Income Children (Calculated from the 2010-2014 American Community Survey), http://www.nccp.org/profiles/NJ_profile_6.html
[41] Pennsylvania Department of Education, Pennsylvania Build Initiative, Child Care Subsidy Rate Policy Task Force, Report of the Build Subsidized Child Care Rate Policy Task Force: Recommendations for Action, June 2004, http://files.eric.ed.gov/fulltext/ED517022.pdf